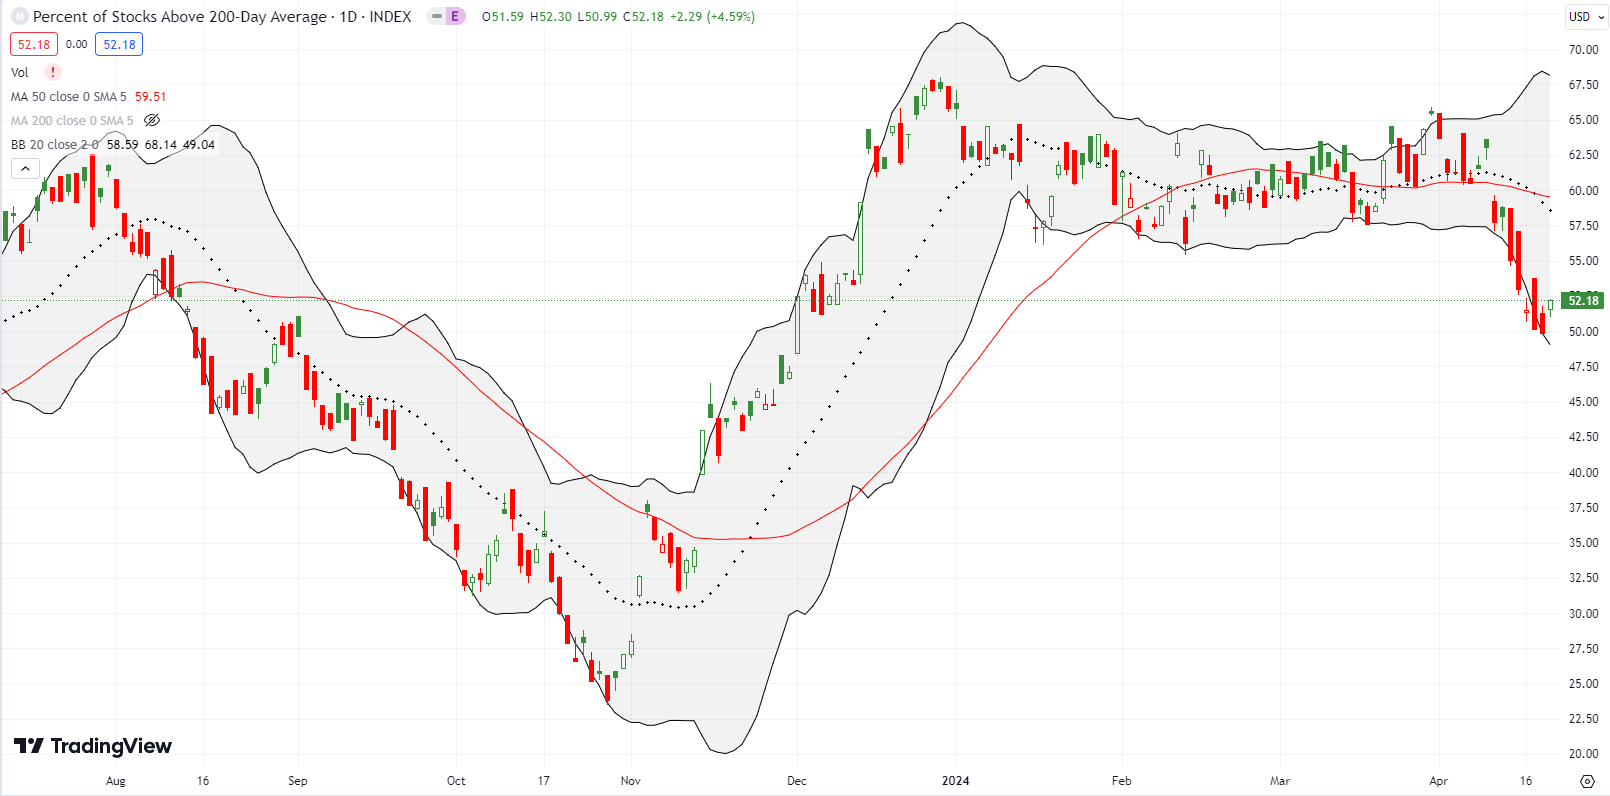
Stock Market Commentary
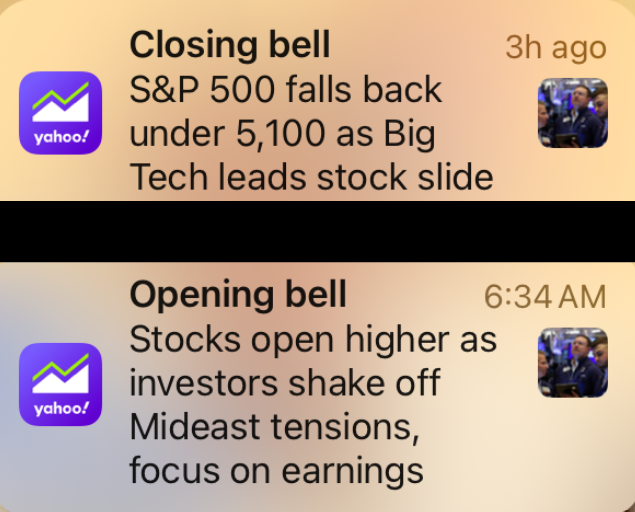
Last week was an intense week of trading. The ever-escalating conflict in the Middle East disturbed markets. However, the initial negative reaction in futures market was mostly erased by the time of the market open on Thursday. The indices even managed to gain ground before getting faded. Thus, the market still fundamentally cares less about pain and misery in geo-politics and instead cares more about domestic developments. For my purposes, the big domestic development comes in the form of the price action which confirmed bearish signals. Still, conditions can change in favor of buyers just as quickly as they changed in favor of the bears. On Friday, market breadth jumped at the same time the S&P 500 sank. The resulting bullish divergence sets up the tantalizing prospect of some kind of bottom for stocks less than two weeks into the current selling cycle, especially given market breadth may have already gotten “oversold enough.”
Regardless what unfolds in the coming days and weeks, the stock market already feels eons away from the celebratory breakout that ended Q1.
The Stock Market Indices
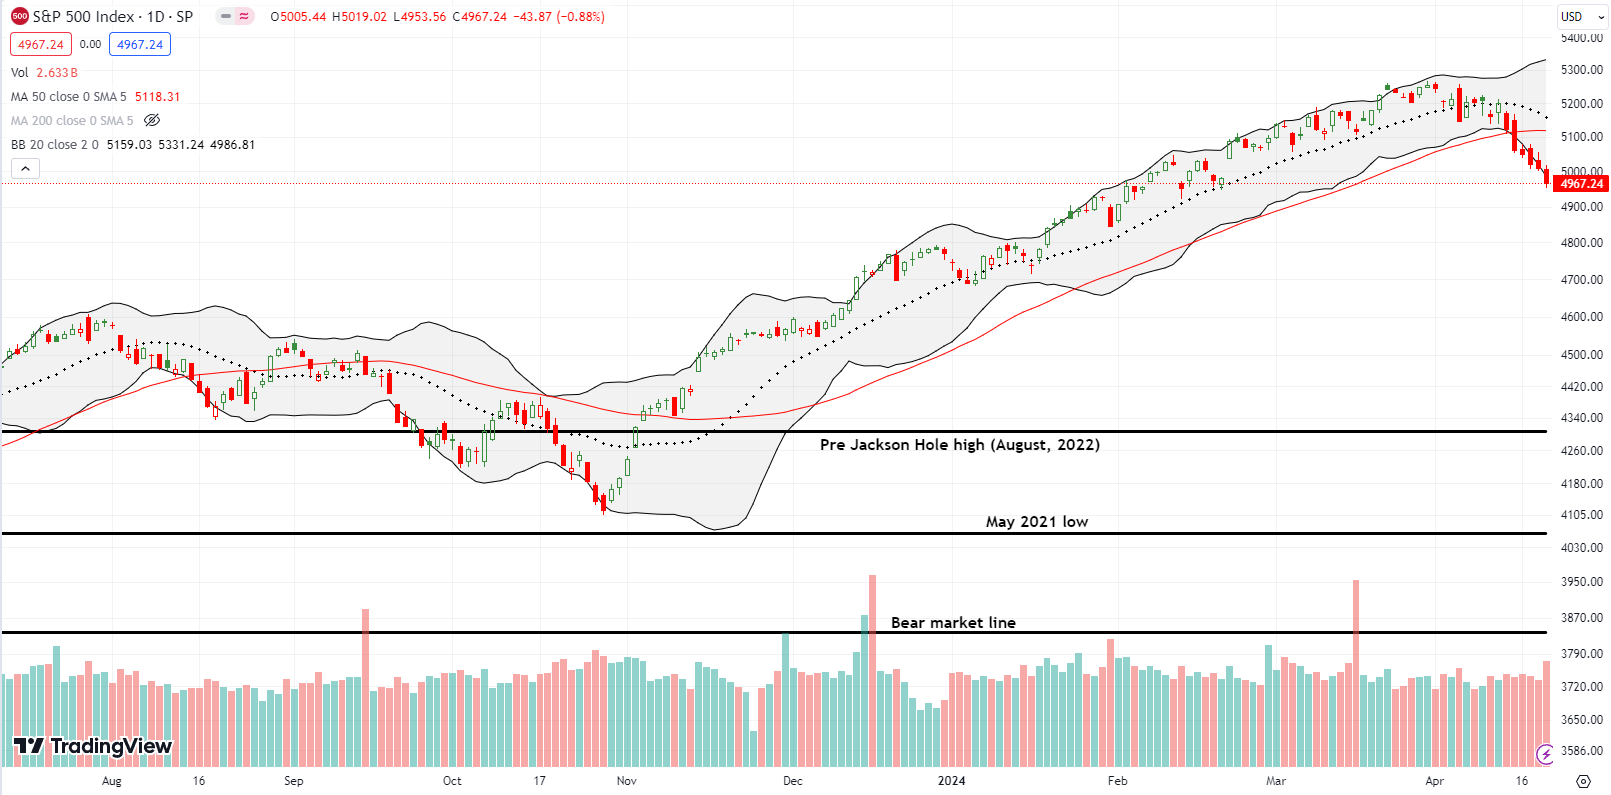
The S&P 500 (SPY) managed to lose ground every day of the week. The index is on a 6-day losing streak that has created an orderly slide along the lower Bollinger Band (BB). Although the overall decline is relatively small at 4.5%, the persistent tags and breaks below the lower BB reveal intense selling pressure. On Thursday, sellers even quashed an intraday rally attempt.
The S&P 500 is in bearish territory with a confirmed breakdown below its 50-day moving average (DMA) and a 2-month low.
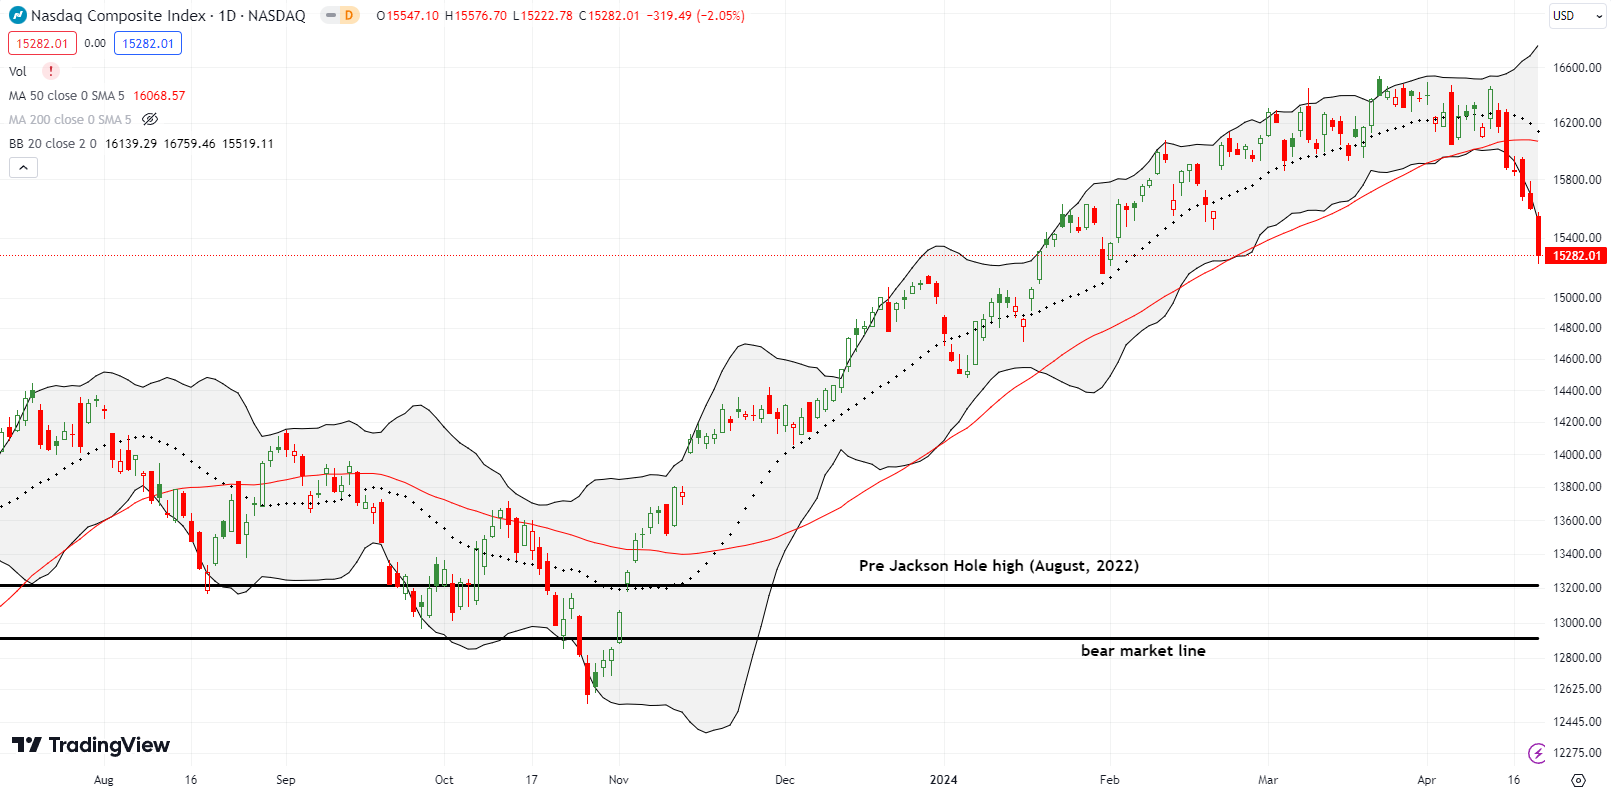
The NASDAQ (COMPQ) is in deeper trouble than the S&P 500. The tech-laden index’s 6-day losing streak has taken it from a (marginal) closing all-time high to a 2 1/2 month closing low. Incredibly, the NASDAQ is just a 1.8% decline away from losing ALL its gains of the year. What a dramatic turn-around!
Friday’s 2.1% loss stretched the NASDAQ well below its lower BB and sets up the potential for some kind of rebound at least back to the lower BB. Moreover, certain algorithms and money managers are likely interpreting this reversal of fortunes as an opportunity to participate and buy after missing the earlier rally.
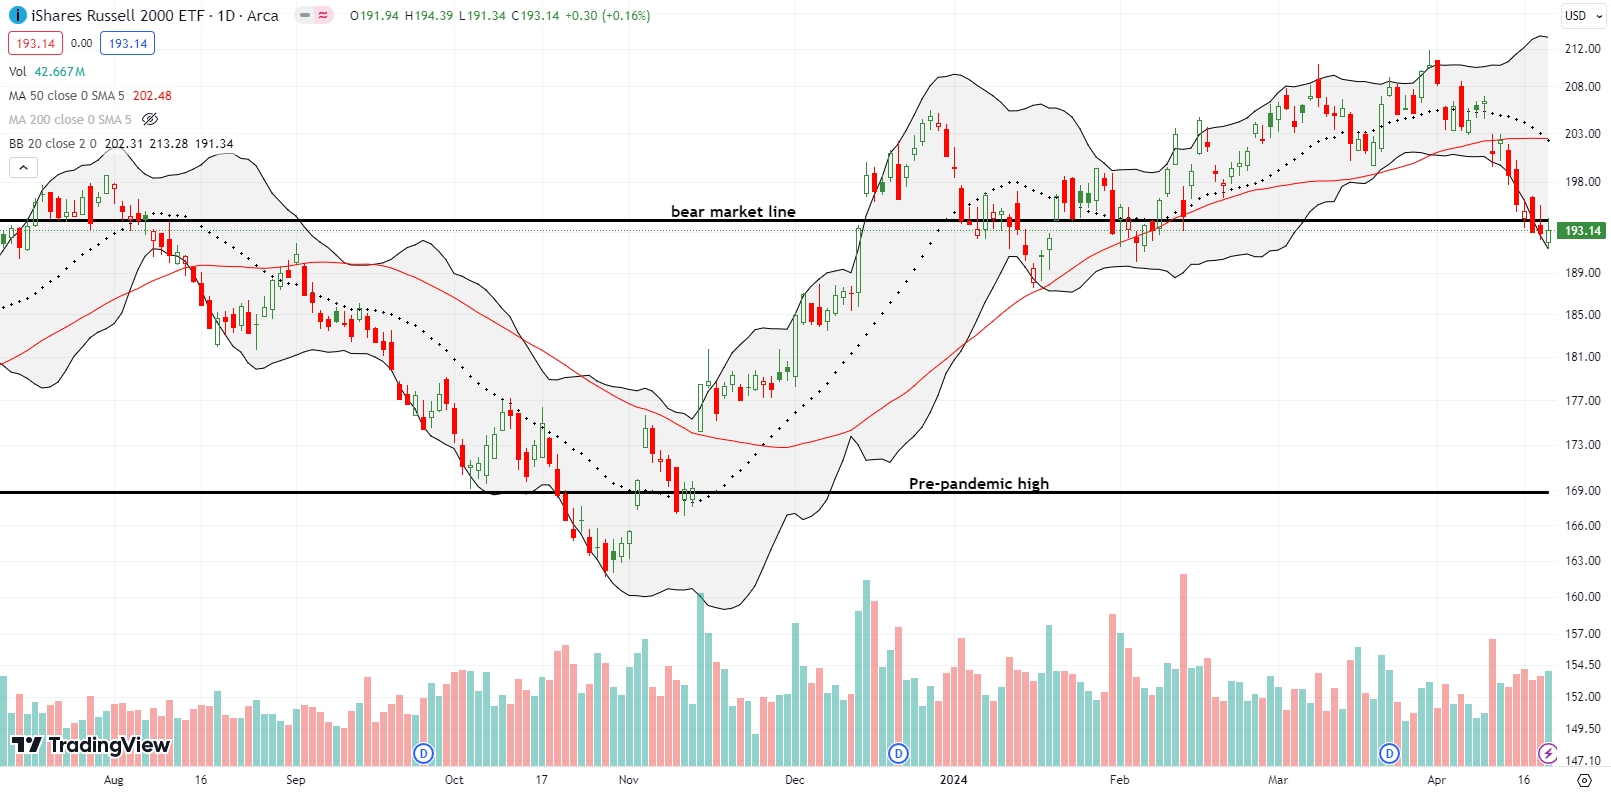
The iShares Russell 2000 ETF (IWM) managed to end the week with a small gain of 0.2%. While the green space was too small to exit the latest bear market, it provided enough outperformance to breath life into market breadth with a potential bullish divergence (see below). IWM closed at a 2 1/2 month low and tested the February low.
The Short-Term Trading Call With A Bullish Divergence
- AT50 (MMFI) = 30.5% of stocks are trading above their respective 50-day moving averages
- AT200 (MMTH) = 52.2% of stocks are trading above their respective 200-day moving averages
- Short-term Trading Call: neutral
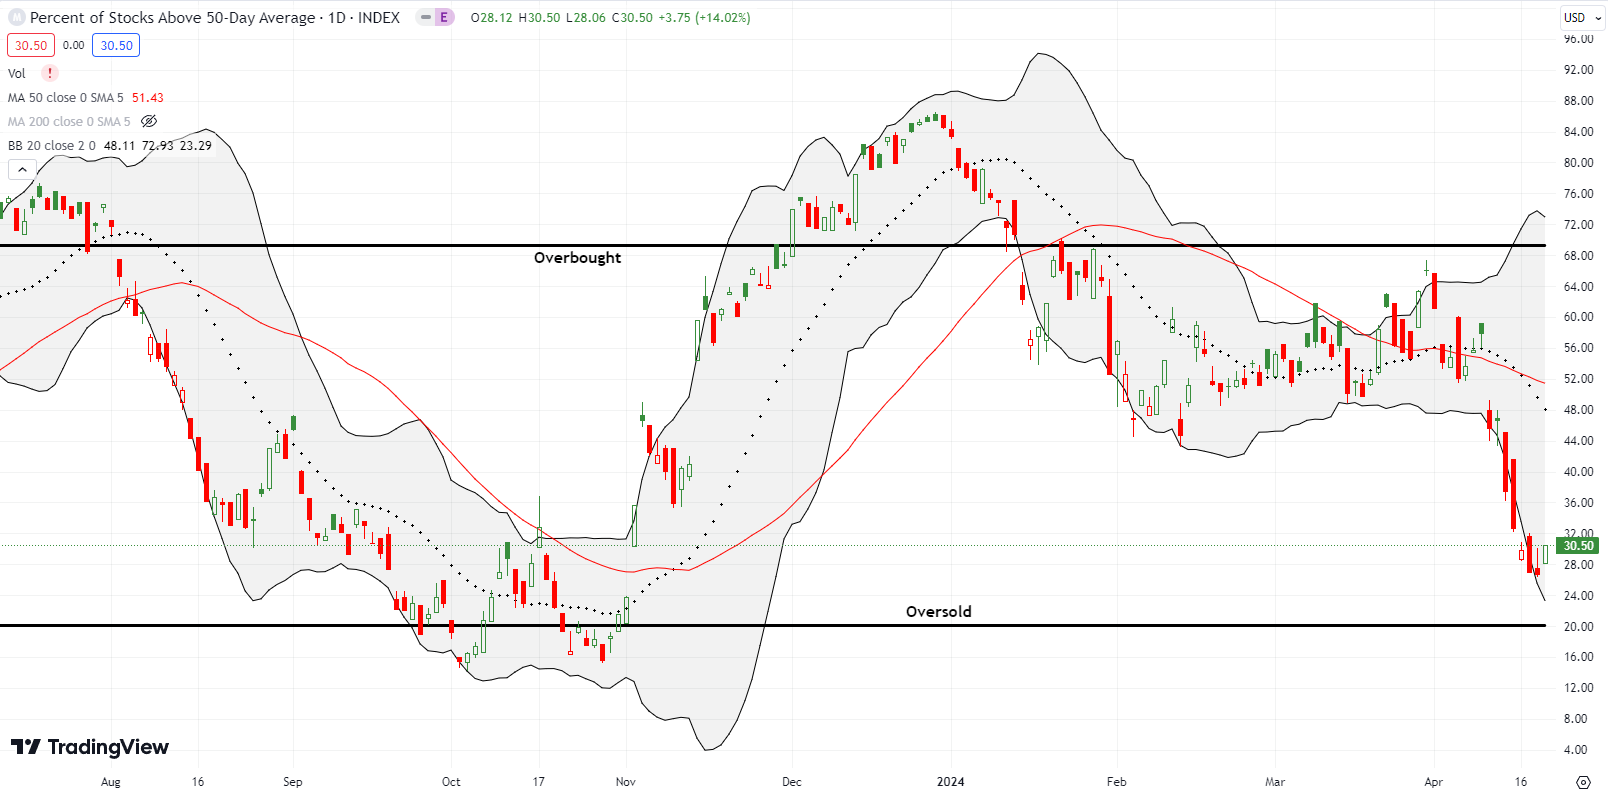
AT50 (MMFI), the percentage of stocks trading above their respective 50DMAs, closed at 30.5%. The near 4 percentage point gain, combined with the over-stretched selling in the major indices, convinced me to churn my short-term trading call from cautiously bearish to neutral. In past posts I have noted how a bull market can deftly avoid the technical definition of an oversold market with AT50 below 20% and instead act oversold enough with AT50 below 30%. Friday’s jump in market breadth set up a bullish divergence from the S&P 500 and the NASDAQ. Accordingly, I cannot stay bearish. However, I did not flip bullish because I anticipate fading a rally into 50DMA resistance. In between now and that fade is an earnings week fraught with all sorts of peril; for example, see Netflix (NFLX) and Intuitive Surgical (ISRG) below.
If market breadth proceeds to drop into true oversold territory from here, I will assume we are now dealing with an overall bear market whose rallies from oversold conditions will be short-lived (that is, fail at resistance levels). I go into the current week with mostly a “clean” slate of short-term positions. I closed almost all my bearish positions, and I realize I was too quick to hedge those positions! My main new position is a hedge on the now suffering VanEck Semiconductor ETF (SMH): a weekly calendar put spread versus a call spread expiring in two weeks.
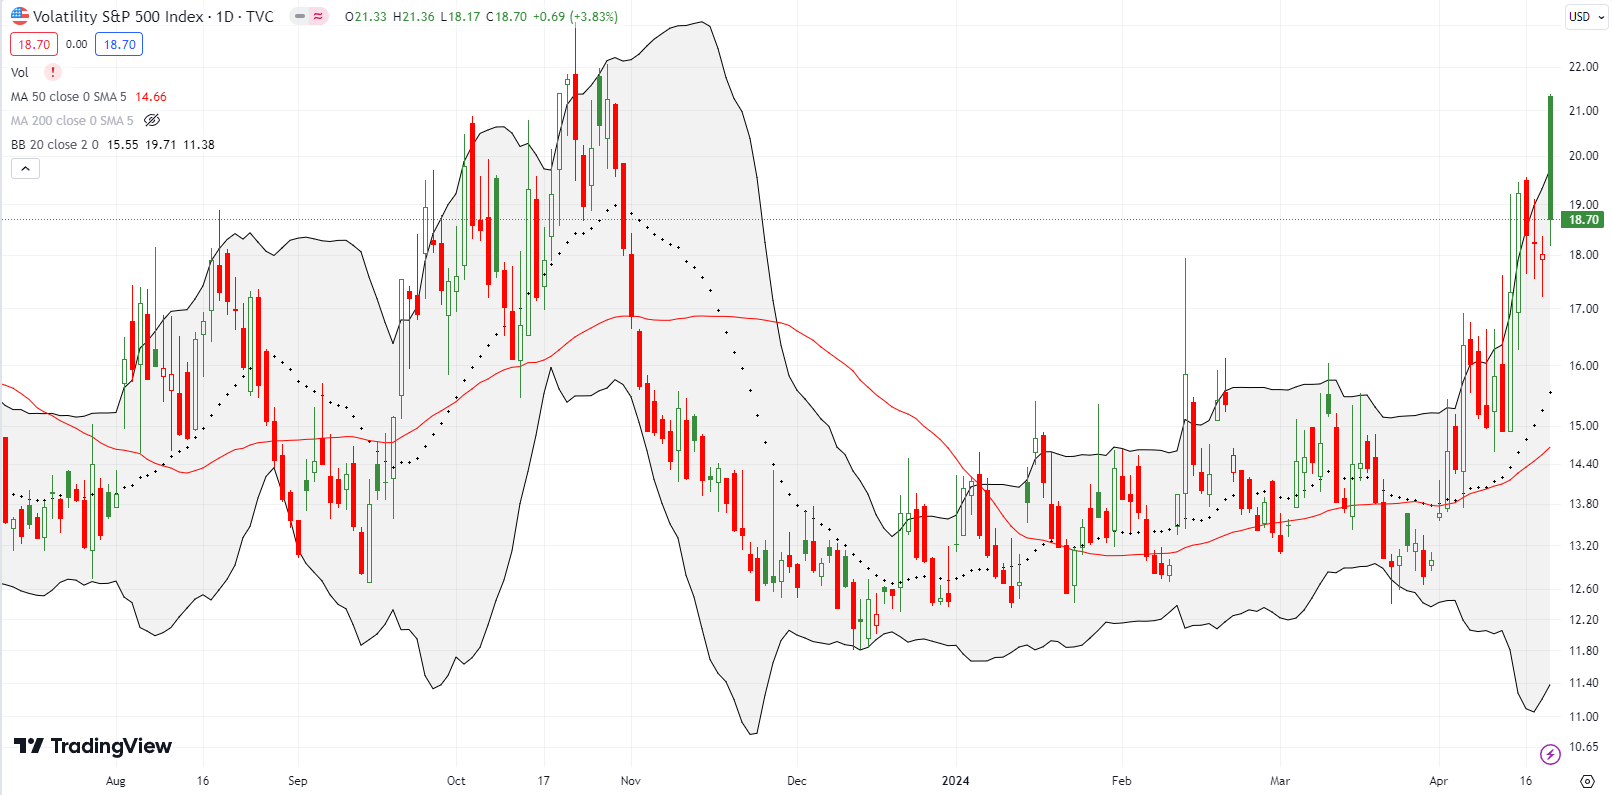
The volatility index (VIX) may matter for the last time for this cycle. A big fade in the VIX contributed to the potential for a bullish divergence to unfold this week.
The VIX opened the day just short of the October closing high. The faders immediately stepped in and took the VIX from an 18.6% gain to a 3.8% gain. The VIX also closed lower than the previous high. Thus, the VIX’s resilient run-up is likely coming to an end for this cycle. This prospect adds to my motivation to upgrade the short-term trading call to neutral.
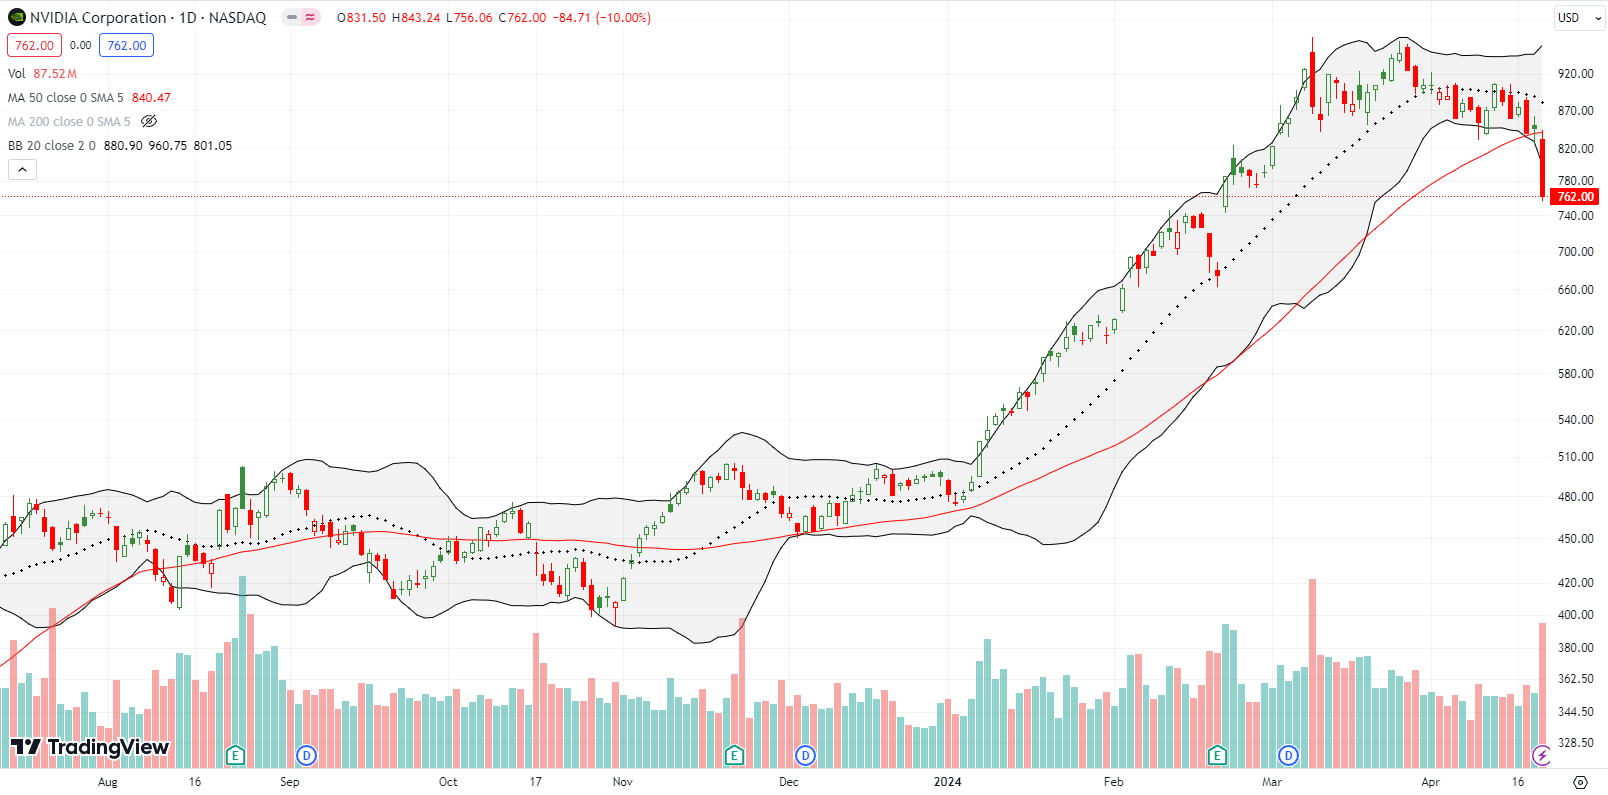
Over two weeks ago, I insisted on watching NVIDIA Corporation (NVDA) instead of the jobs report. Sure enough, NVDA now looms much larger over market sentiment. From the original topping pattern to Friday’s dramatic 10.0% loss and 50DMA breakdown, NVDA embarked upon a 6-week topping process. I told friends I was not interested in buying NVDA until $750. The stock came within $6 of that target. If the bullish divergence unfolds starting Monday, I should get “saved” from following-through on my claim (=grimace=). NVDA now sits between an eventual test of its 50DMA as resistance and a fill of the gap up from February earnings. The excitement from that earnings lasted two weeks…
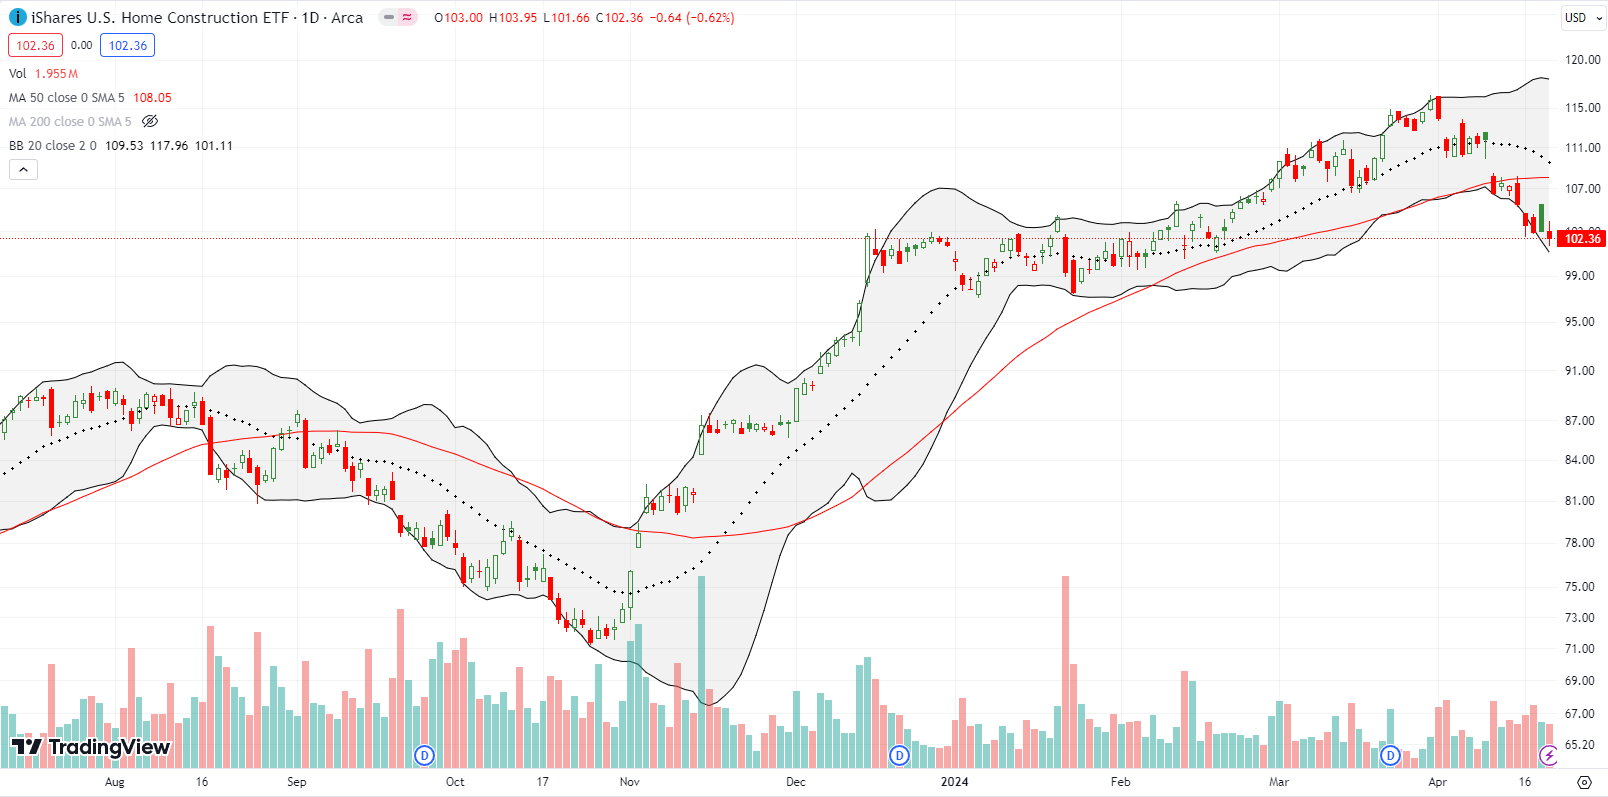
Home builders provided their own bad sign for the stock market. At its intraday low the iShares US Home Construction ETF (ITB) finished reversing all its gains for the year. A feeble bounce from there held ITB a fraction of a point above that ignominious milestone. With the 20DMA (dotted line) converging downward with the 50DMA to form strong resistance, I fully expect ITB to remain topped out for some time to come. The seasonal trade on home builders truly ended in April!
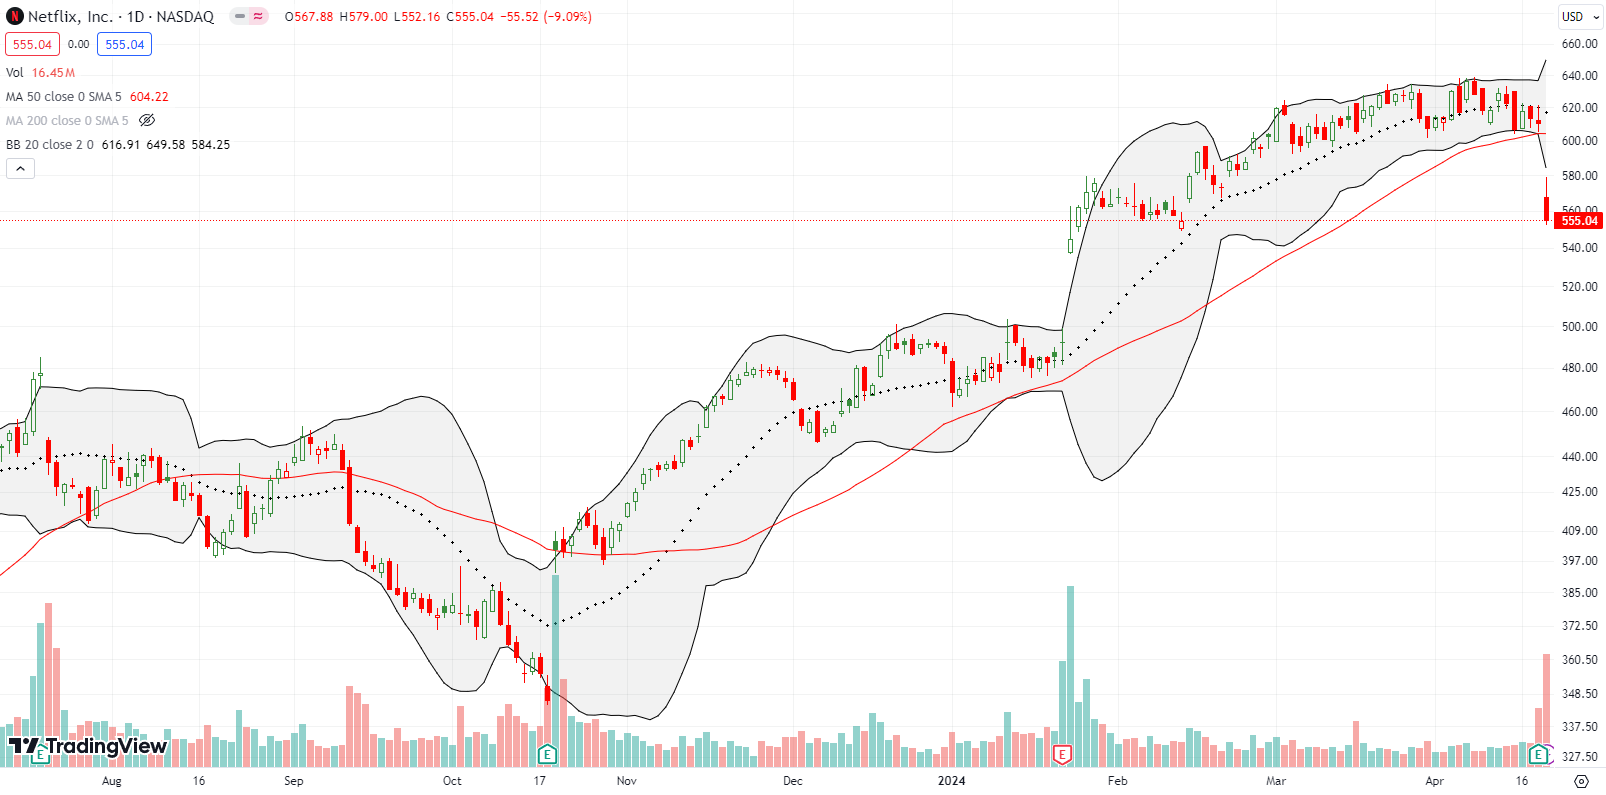
Netflix (NFLX) reflected the mood of the moment with a 9.1% post-earning loss. Reportedly, the following news from the NFLX investor letter spooked the market after the stock initially rallied about 3% in after hours (emphasis mine):
“As we’ve noted in previous letters, we’re focused on revenue and operating margin as our primary financial metrics — and engagement (i.e. time spent) as our best proxy for customer satisfaction. In our early days, when we had little revenue or profit, membership growth was a strong indicator of our future potential. But now we’re generating very substantial profit and free cash flow (FCF). We are also developing new revenue streams like advertising and our extra member feature, so memberships are just one component of our growth. In addition, as we’ve evolved our pricing and plans from a single to multiple tiers with different price points depending on the country, each incremental paid membership has a very different business impact. It’s why we stopped providing quarterly paid membership guidance in 2023 and, starting next year with our Q1’25 earnings, we will stop reporting quarterly membership numbers and ARM.”
I strongly suspect that if the market was still in its blithe, complacent, and bullish mood, investors would have looked beyond this coming change in reporting. Instead, the market’s bearish mood magnifies every blemish. I fully expect NFLX to test 50DMA resistance before its next earnings report, taking advantage of a period where market sentiment improves. In the meantime, I will watch for worsening sentiment to drive NFLX into its last post-earnings gap up and thus put an imminent test of 50DMA resistance out of reach.
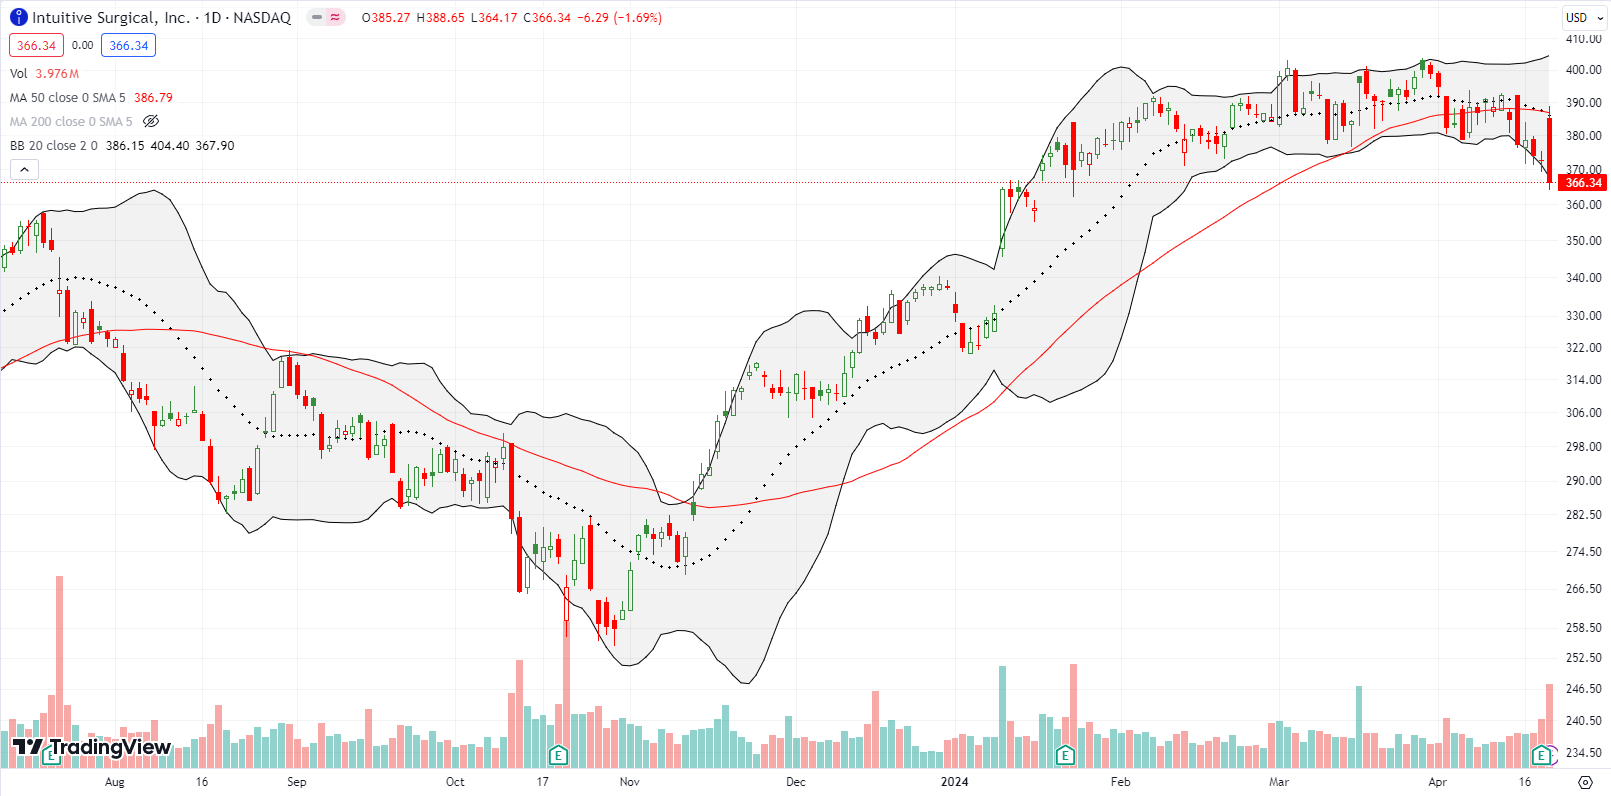
Robotic surgery equipment maker Intuitive Surgical, Inc (ISRG) started Friday strong with a 3.4% post-earnings gap up. Unfortunately, that open jammed right into converged 20DMA and 50DMA resistance. Sellers jumped in and never looked back. The resulting reversal closed ISRG with a 1.7% loss and 3-month low. This win for the bears flashes warnings for any coming earnings reports that fail to deliver news outstanding enough to drown out souring market sentiment.
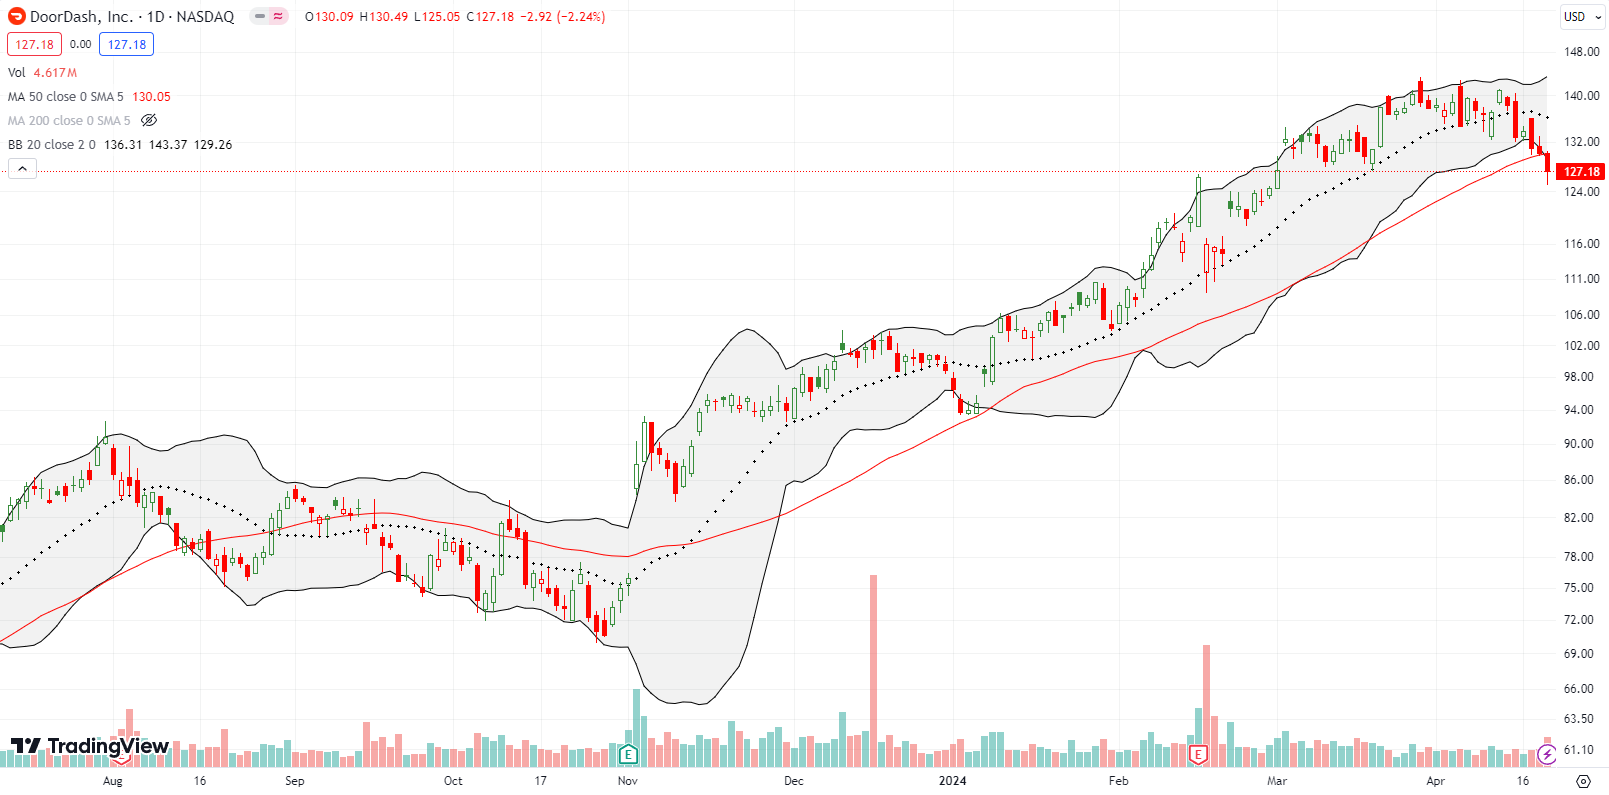
When market sentiment turns, I Iike to track the behavior of market favorites. DoorDash, Inc (DASH) found general support from its 20DMA and strong support from its 50DMA since a 15.7% post-earnings breakout in November. My DASH skepticism prevented me from participating in the astonishing 44.9% gain since the first post-earnings close. Friday’s 2.2% loss and 50DMA breakdown looks like a pinprick in comparison to those gains. Still, the 6-week low closed an early March gap up and puts pressure on the buyers and bulls to avoid a bearish, confirmed 50DMA breakdown.
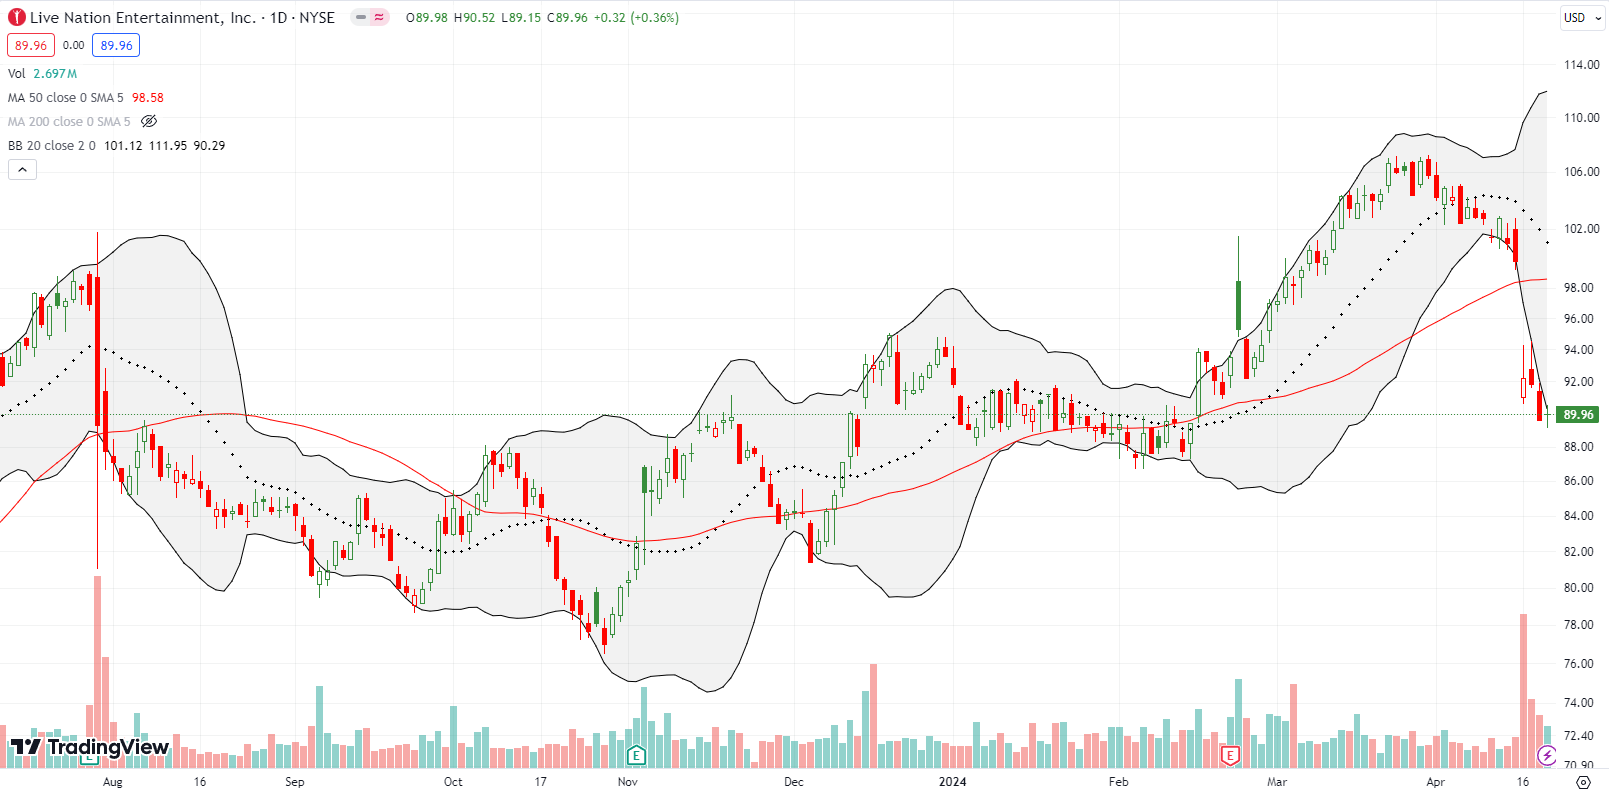
On July 28, 2023, news that the Department of Justice might pursue anti-trust litigation against Live Nation Entertainment, Inc (LYV) spoiled a post-earnings gain and sent LYV reeling 7.8%. It took the market over 7 months to get complacent enough to reverse those losses (no lawsuit materialized after all). On April 16th, LYV lost 7.6% on news that the Department of Justice will indeed come after Live Nation. LYV closed the week almost exactly where it closed on July 28, 2023. Enough said…
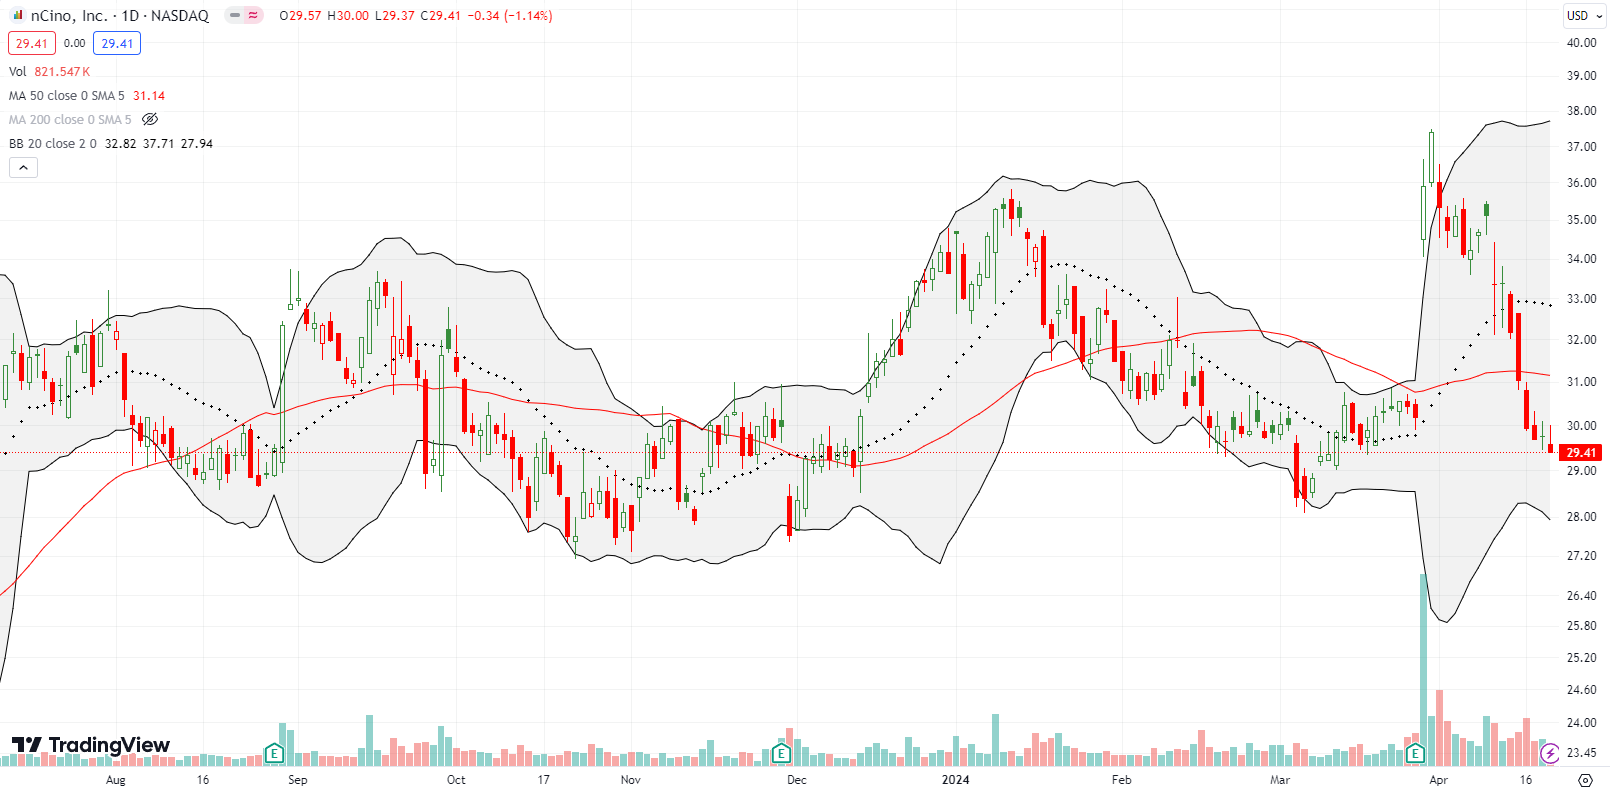
Earnings reactions provide a lot of fodder for observing market confusion. Cloud software company for the finance industry nCino Inc (NCNO) enjoyed a 19.0% post-earnings surge in March. Buyers even follow-through with a fresh 20-month high. The stock proceeded to sell off from there. Sellers did not stop at a simple gap fill. NCNO closed the week at a 1-month low and is threatening the bottom of a 10-month trading range. From a technical standpoint, this huge fakeout warns of worse price action to come. In particular, NCNO will face a tremendously high bar for its next earnings report.
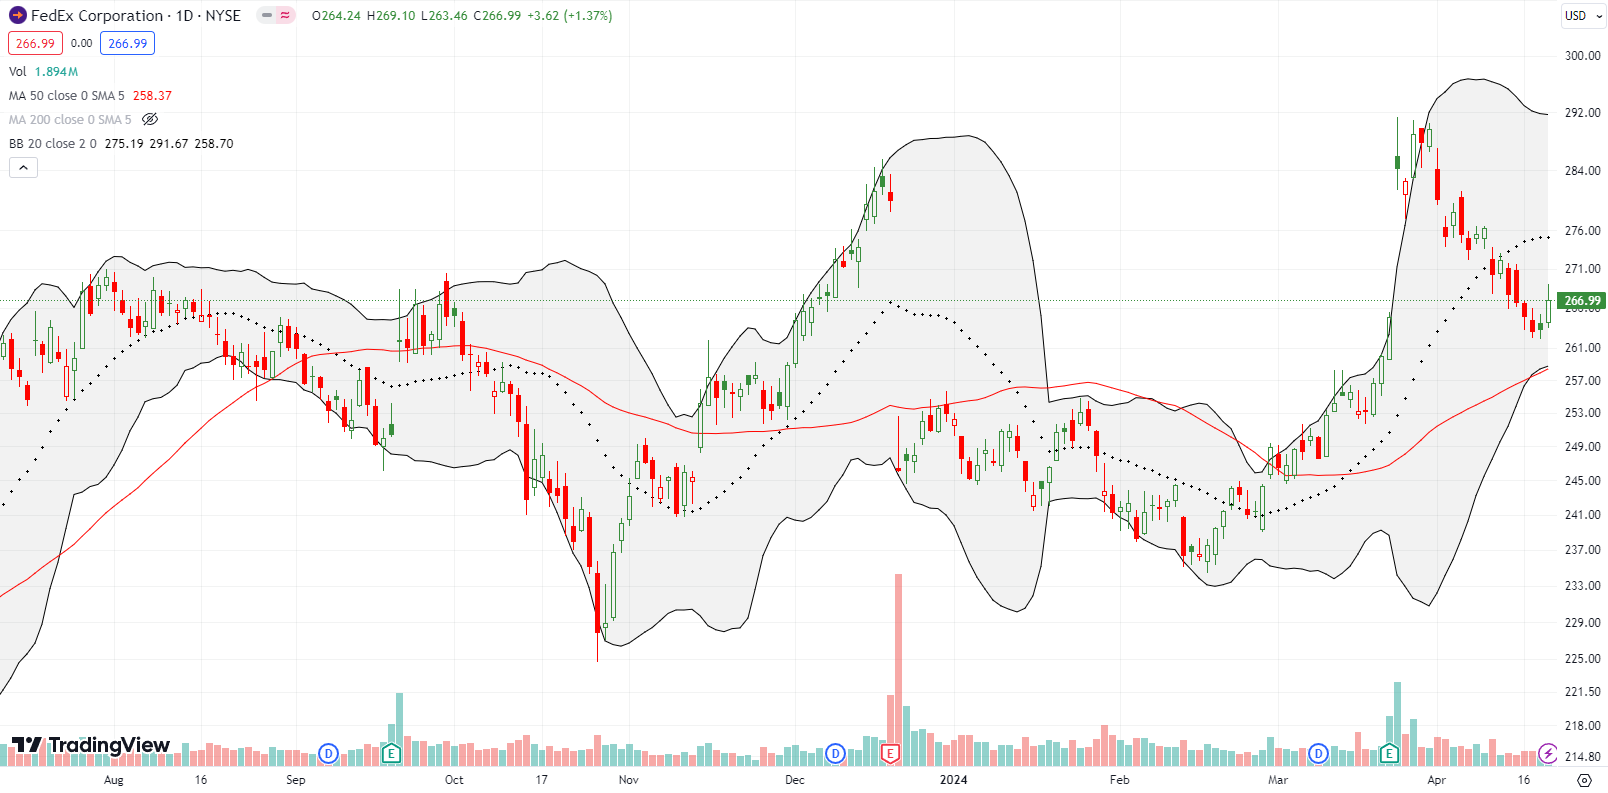
Sometimes a gap fill opens up the next cycle of opportunity. FedEx Corporation (FDX) surged 7.4% post-earnings last month. Last week, sellers finished reversing all those gains before buyers made an attempt to bring back post-earnings cheer. FDX gained 1.4% and easily out-performed the stock market. While FDX failed to test 50DMA support (and never mind the market clearly has no idea what to think of FDX), I want to buy FDX here with a stop below last week’s low.
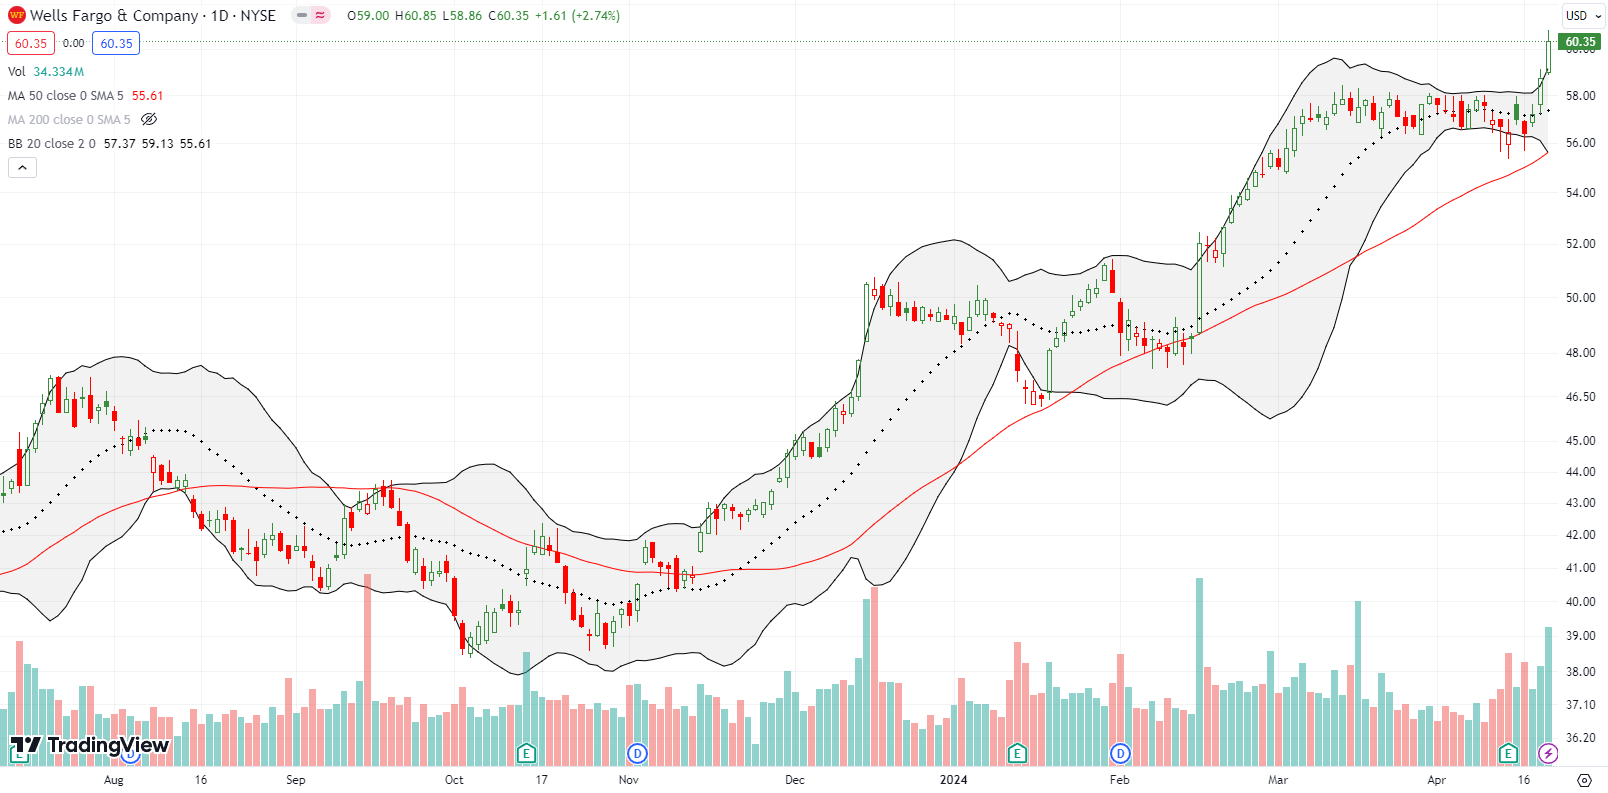
A week ago, a sharp post-earnings reversal by banking giant JP Morgan Chase & Co (JPM) solidified a bearish turn in the stock market. So imagine my surprise to see smaller banking giant Wells Fargo & Company (WFC) printing a 2-day surge for a breakout to a 4-year high. Moreover, WFC lost a fraction of a percent after reporting its earnings on the morning of April 12th. I see nothing in the news flow to explain such a turn-around, so I am very intrigued. I want to buy the dips on WFC. Only a 50DMA breakdown will shake me from the position.
Be careful out there!
Footnotes
Subscribe for free to get email notifications of future posts!
“Above the 50” (AT50) uses the percentage of stocks trading above their respective 50-day moving averages (DMAs) to measure breadth in the stock market. Breadth defines the distribution of participation in a rally or sell-off. As a result, AT50 identifies extremes in market sentiment that are likely to reverse. Above the 50 is my alternative name for “MMFI” which is a symbol TradingView.com and other chart vendors use for this breadth indicator. Learn more about AT50 on my Market Breadth Resource Page. AT200, or MMTH, measures the percentage of stocks trading above their respective 200DMAs.
Active AT50 (MMFI) periods: Day #102 over 20%, Day #1 over 30% (overperiod ending 3 days below 20%), Day #6 under 40% (underperiod), Day #8 under 50%, Day #14 under 60%, Day #69 under 70%
Source for charts unless otherwise noted: TradingView.com
Full disclosure: long VXX puts, long ITB, long IWM calls, SMH: a weekly calendar put spread versus call spread
FOLLOW Dr. Duru’s commentary on financial markets via StockTwits, Twitter, and even Instagram!
*Charting notes: Stock prices are not adjusted for dividends. Candlestick charts use hollow bodies: open candles indicate a close higher than the open, filled candles indicate an open higher than the close.


