Stock Market Commentary
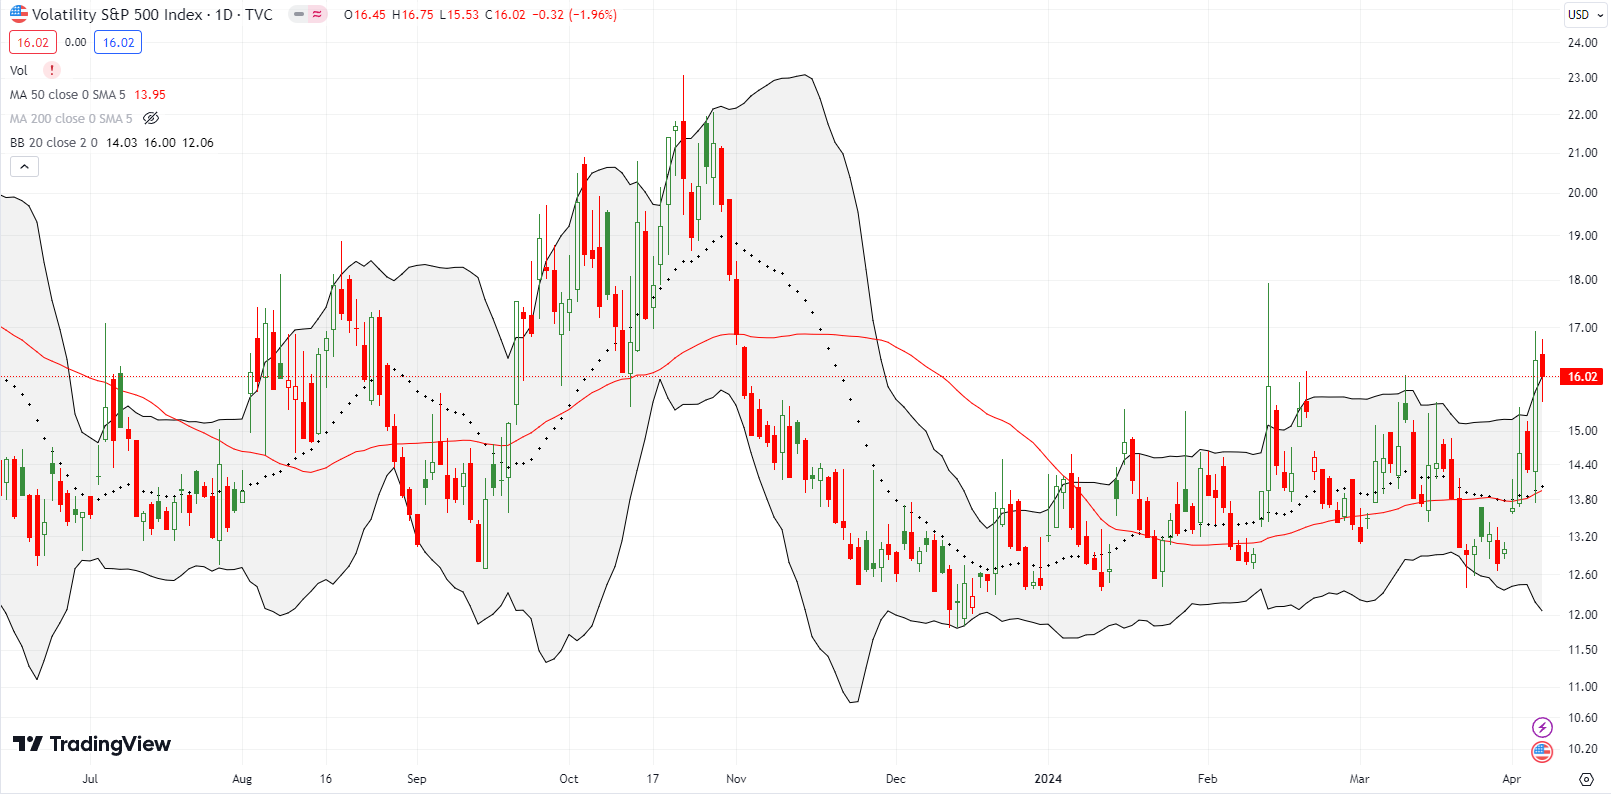
While I watch the tense trading unfold in NVDA, the VIX, the volatility index, has suddenly returned to my radar as an indicator of interest. Thursday’s stock market setback came with a surging VIX that closed at a new high of the year. The regular programming of the volatility faders actually failed to make much of a dent in the VIX after the intraday high. Thus, last week’s trading closed with the ominous combination of a strong-looking VIX and a surprising market rebound. The VIX looks like it matters again.
The stock market rebounded despite another strong jobs report that seemed to confirm the week’s Fedspeak doubting the need for cutting rates anytime soon. The jobs report for March delivered yet another set of “hotter than expected” numbers (who are these forecasters anyway?) which in turn cooled expectations for imminent rate cuts and pushed bond yields sharply higher. So the market rebounded….just because? Just because there was a dip the day before? Maybe good economic news is actually good news for stocks? The suddenly resilient and consequential VIX tells me, for now, to strengthen my market skepticism. However, just like the currently persistent uptrend, market dynamics are unfolding as a process and not an event (be ready so you don’t have to get ready).
The Stock Market Indices
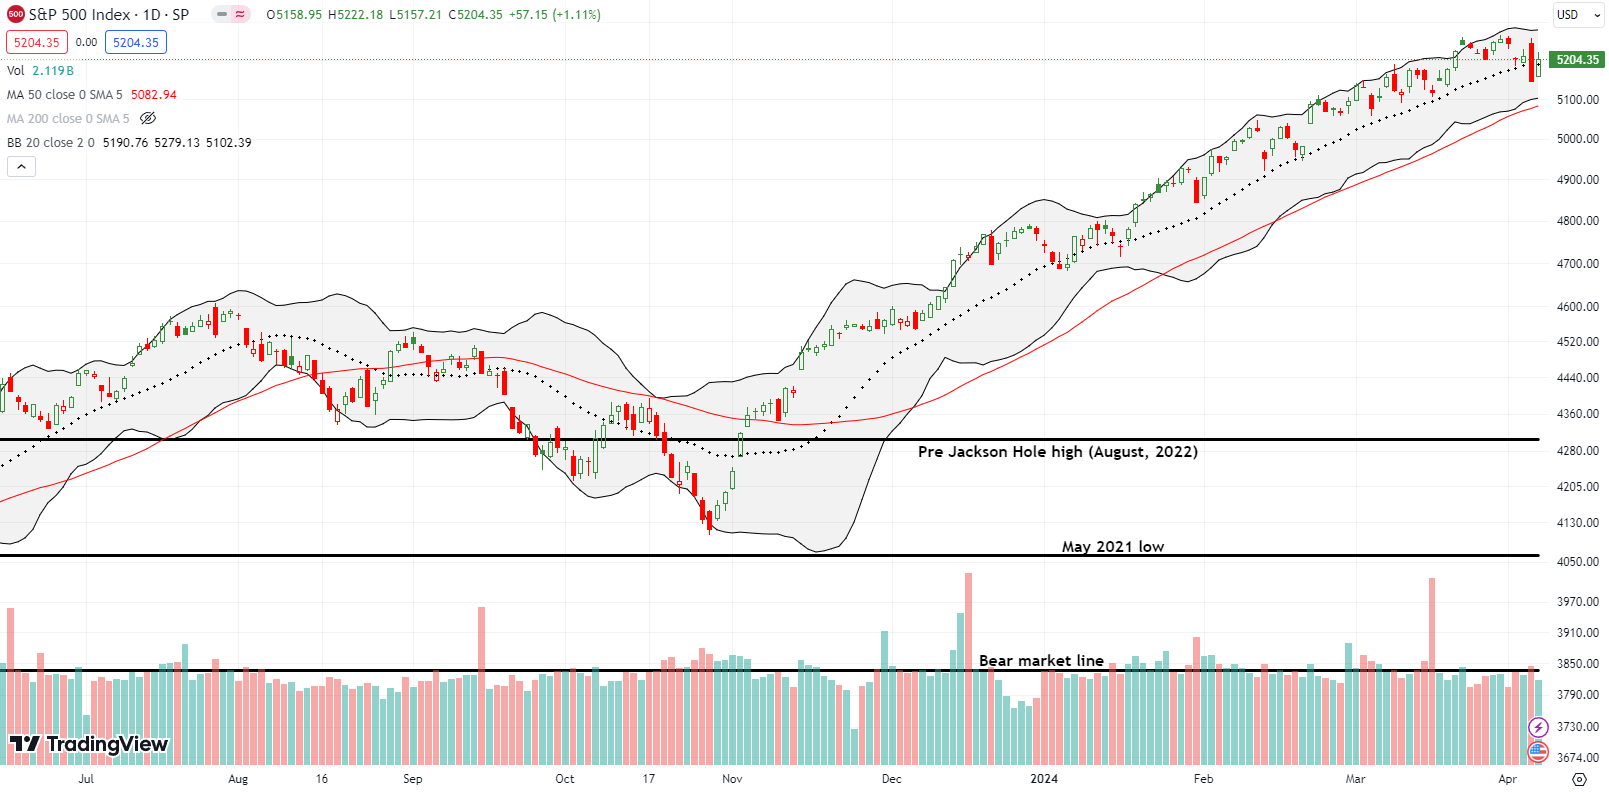
The S&P 500 (SPY) stayed true to its 20-day moving average (DMA) (the dotted line below). While Thursday’s 1.2% setback looked like a decisive breakdown below 20DMA support, the event turned into yet another buying opportunity to the accumulators in this rally. During this rally, the S&P 500 has only once closed below its 20DMA for multiple consecutive days. Still, the ability of the VIX to surge and hang tough places additional pressure on the buyers to invalidate Thursday’s bearish engulfing and sharp intraday reversal.
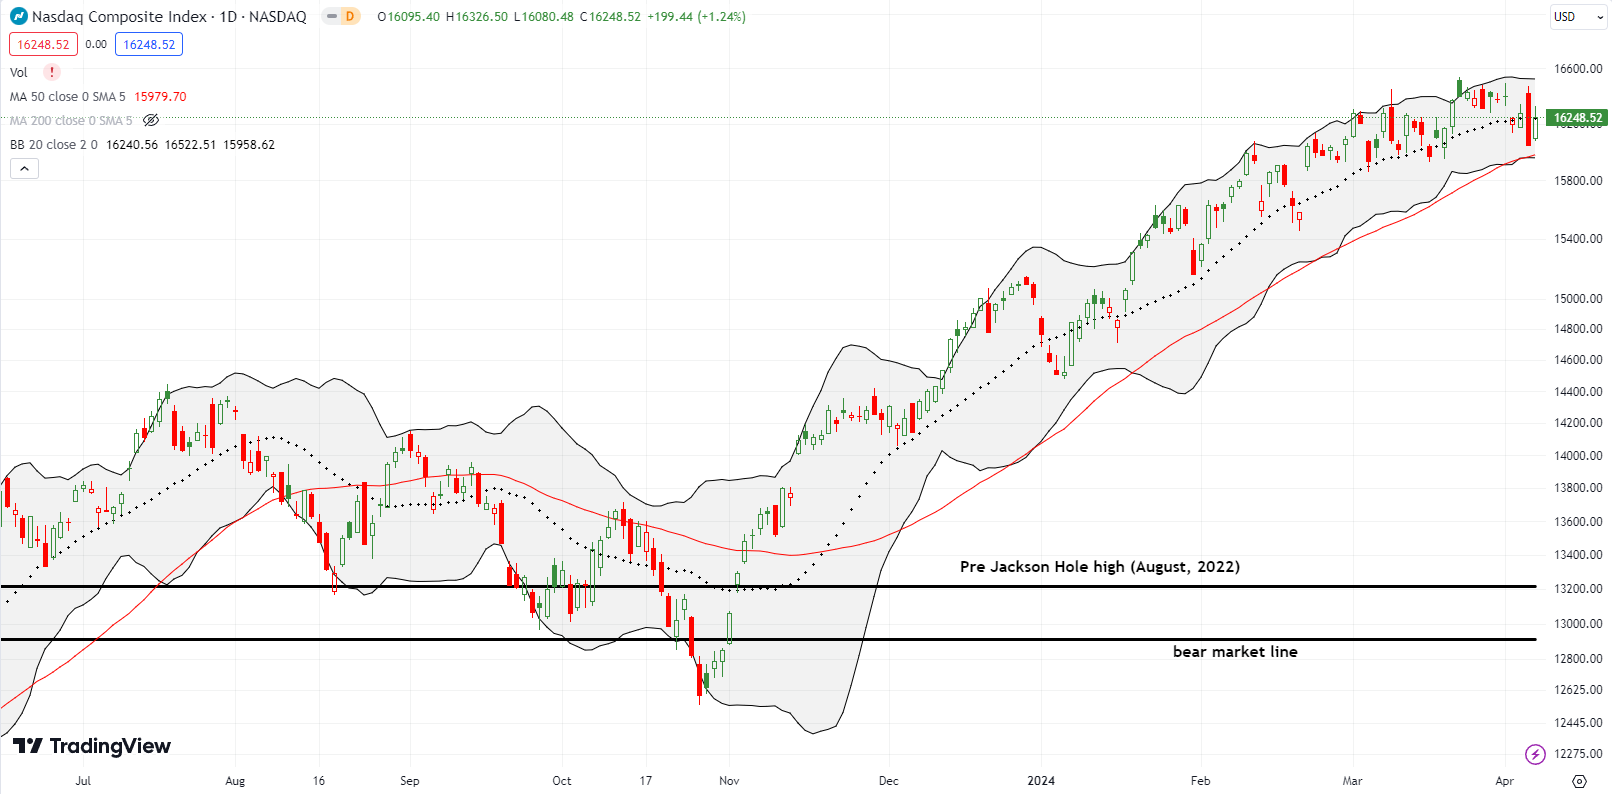
The NASDAQ (COMPQ) rebounded from its Thursday 1.4% setback for a close essentially right on top of its 20DMA. Buyers refused to let the tech-laden index test its 50DMA support (the red line). Still, the NASDAQ’s momentum is waning ever so slightly since it made an all-time high two weeks ago. A resilient VIX will indicate advantage finally swinging in favor of sellers. Note that a test of 50DMA support will be a major technical event by itself, but minor in the context of aligning with a 1-month low and the bottom of the previous price consolidation period.
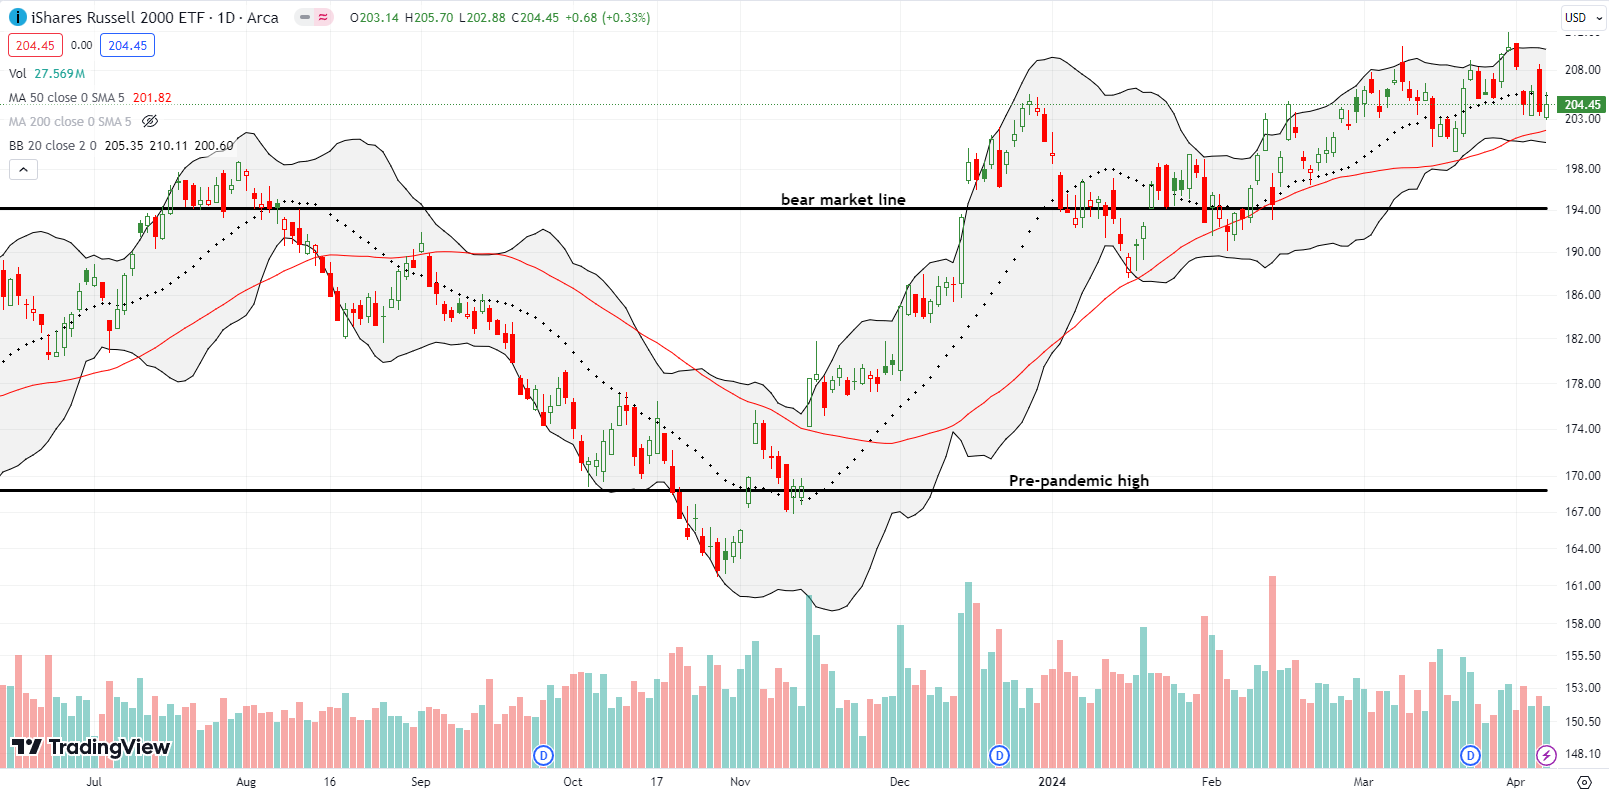
The iShares Russell 2000 ETF (IWM) is stuck in a trading range in place since late February. The ETF of small caps is also stuck churning below its 20DMA while a test of 50DMA support beckons. The last test of 50DMA support unfolded over 2 trading weeks and included a false breakout in the middle. The 50DMA is flatter at this juncture so a fresh test could stretch out over an even longer duration.
The Short-Term Trading Call With A VIX That Matters
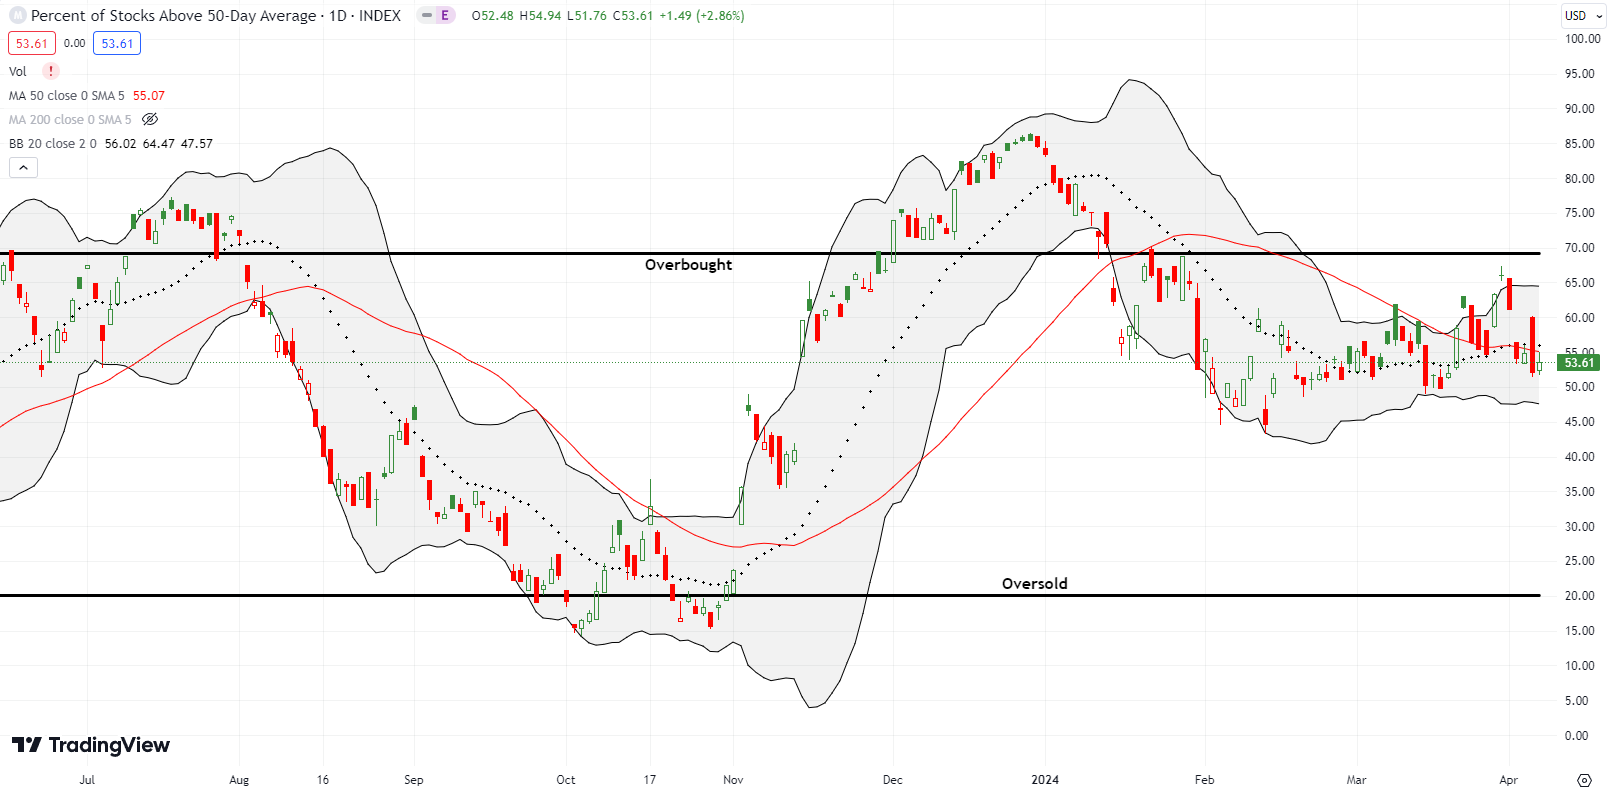
- AT50 (MMFI) = 53.6% of stocks are trading above their respective 50-day moving averages
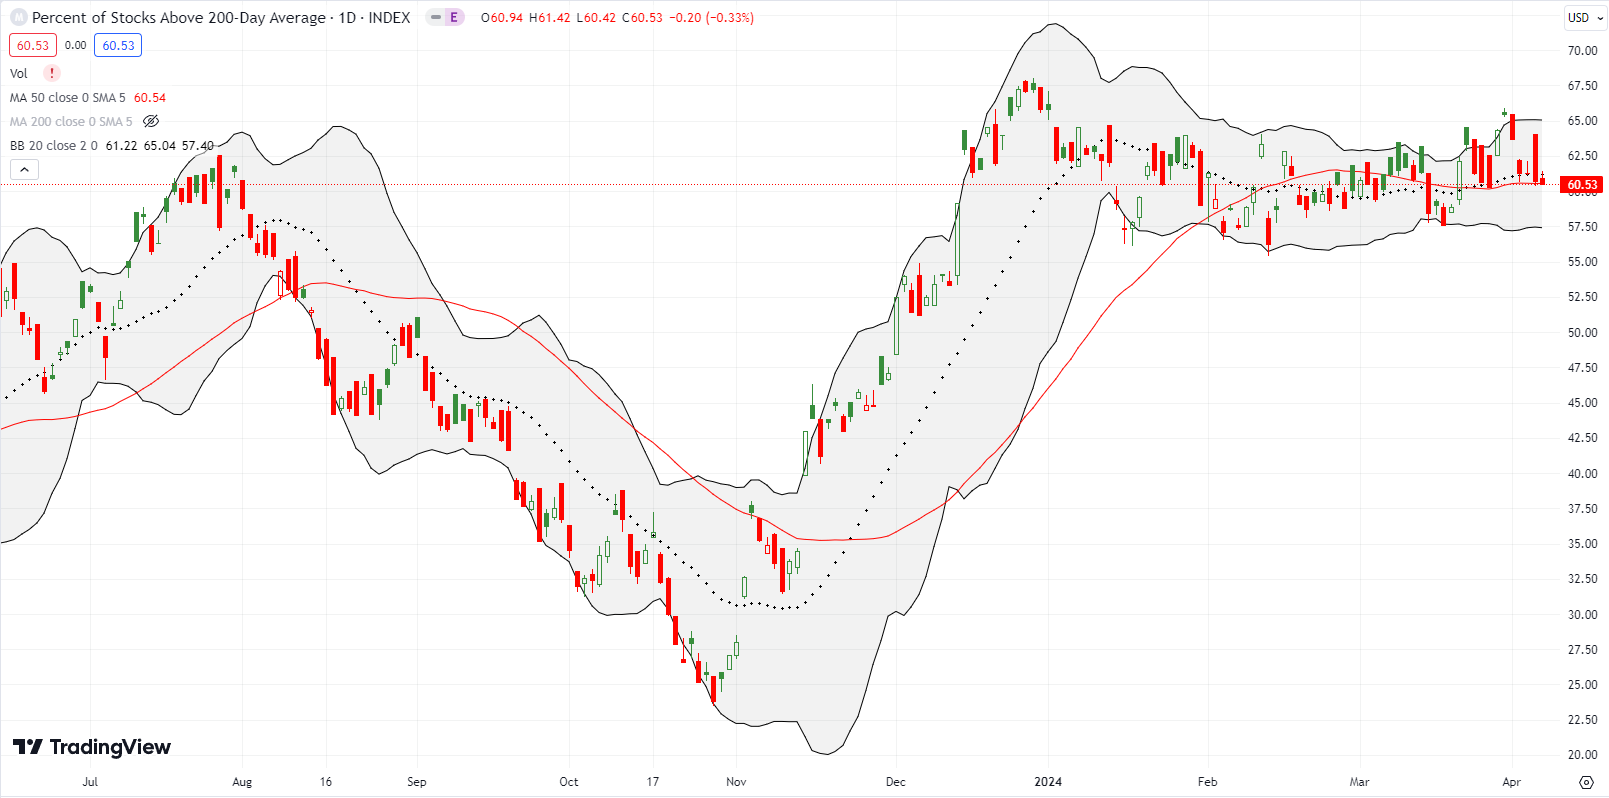
- AT200 (MMTH) = 60.5% of stocks are trading above their respective 200-day moving averages
- Short-term Trading Call: skeptical
AT50 (MMFI), the percentage of stocks trading above their respective 50DMAs, closed at 53.6%. While the S&P 500 and the NASDAQ enjoyed surprisingly strong rebounds, my favorite technical indicator only eked out a gain of a point and a half. This tepid partnership with the rebound is consistent with the decisive fade from the overbought threshold (70%) at the beginning of the week as well as the sharp reversal on Thursday’s VIX surge. Altogether, this swirl of signals further underlined my skepticism about the stock market’s rally.
The volatility index, the VIX, made a rare appearance as an indicator that matters. All year, the VIX has exhibited a regular “saw-tooth” pattern featuring short bursts off the lows with a subtle uptrend the whole way: higher lows and higher highs. In late March, that pattern failed as the VIX broke down to a 7-week low, and the S&P 500 broke out to all-time highs; the VIX looked set to test its low of the year.
To start the week of trading, the VIX suddenly gapped up and rallied from there to a new closing high of the year. The VIX made a bid to matter with two consecutive closes above the previous high of the year. The VIX actually stymied the faders. If the VIX pushes higher from here, the indices will feel a continuation of Thursday’s downward pressure. Still, I bought a handful of put options on iPath Series B S&P 500 VIX Short-Term Futures ETN (VXX) in case the same old pattern resumes. Otherwise, I am ready for a VIX that matters.
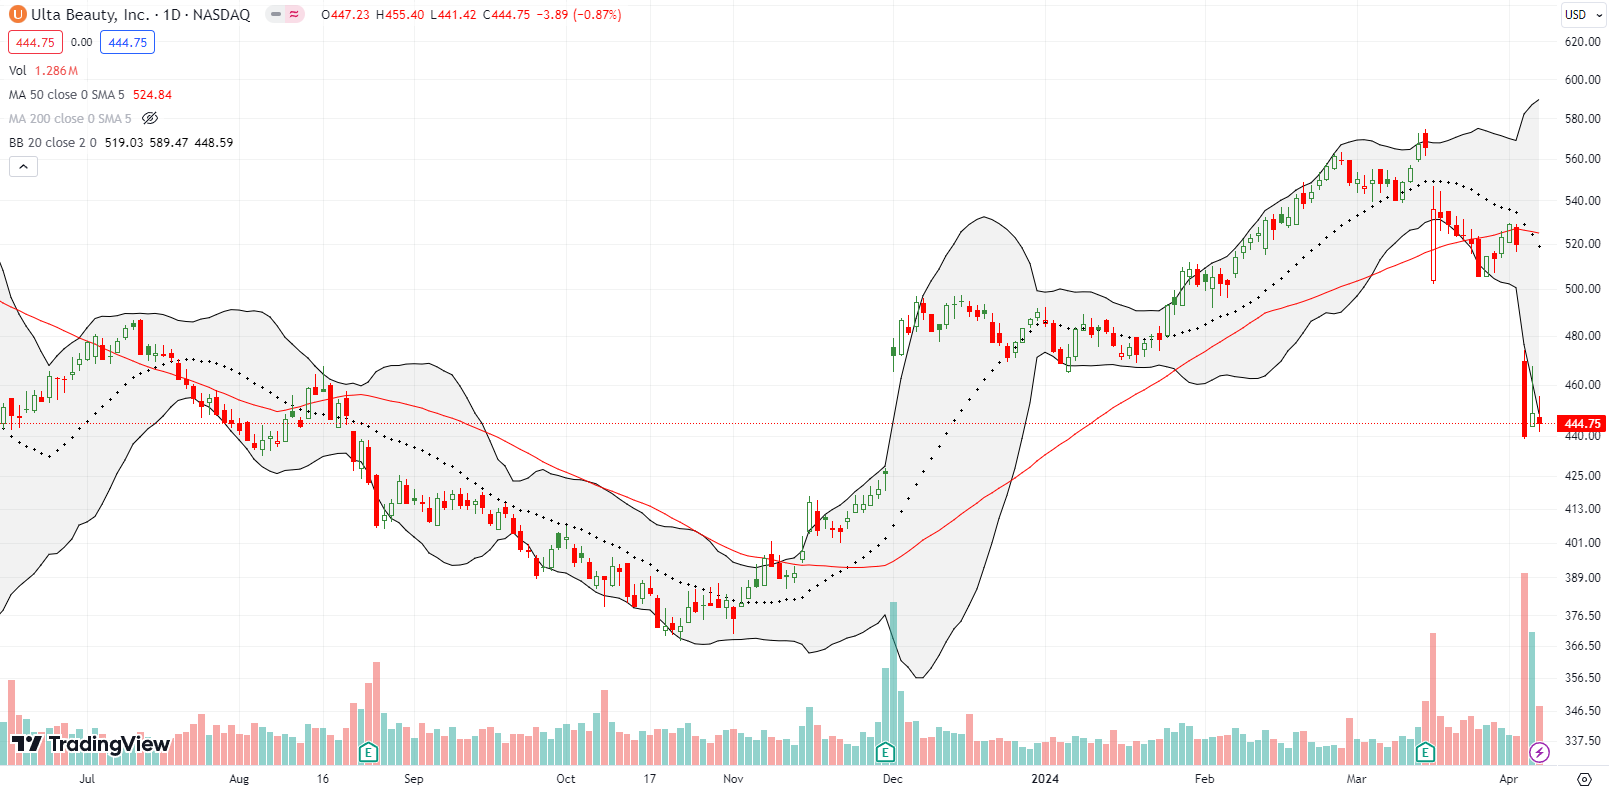
Ulta Beauty, Inc (ULTA) delivered a dream technical setup. The first bearish tell occurred last month with a 5.2% post-earnings breakdown that included a brief 50DMA breakdown. Sellers were able to force the issue with a second 50DMA breakdown. The 2.8% loss on that day raised a major red flag. In response, I bought an April $500/$480 put spread. Although ULTA turned right around from there, and even poked through 50DMA resistance, a downtrending 20DMA held firm as resistance. A 15.3% plunge came the next day.
The company warned about a sales slowdown at an investors conference. This news apparently terrified investors coming so soon after earnings. The warning suggests that the next earnings results will be worse than the last. ULTA now looks ready to finish closing the gap up from its previous earnings report. With ULTA trading well below my put spread, I took profits.
The ULTA news was bad enough to take down competitor e.l.f. Beauty, Inc (ELF). ELF lost 11.9% in sympathy with a 50DMA breakdown.
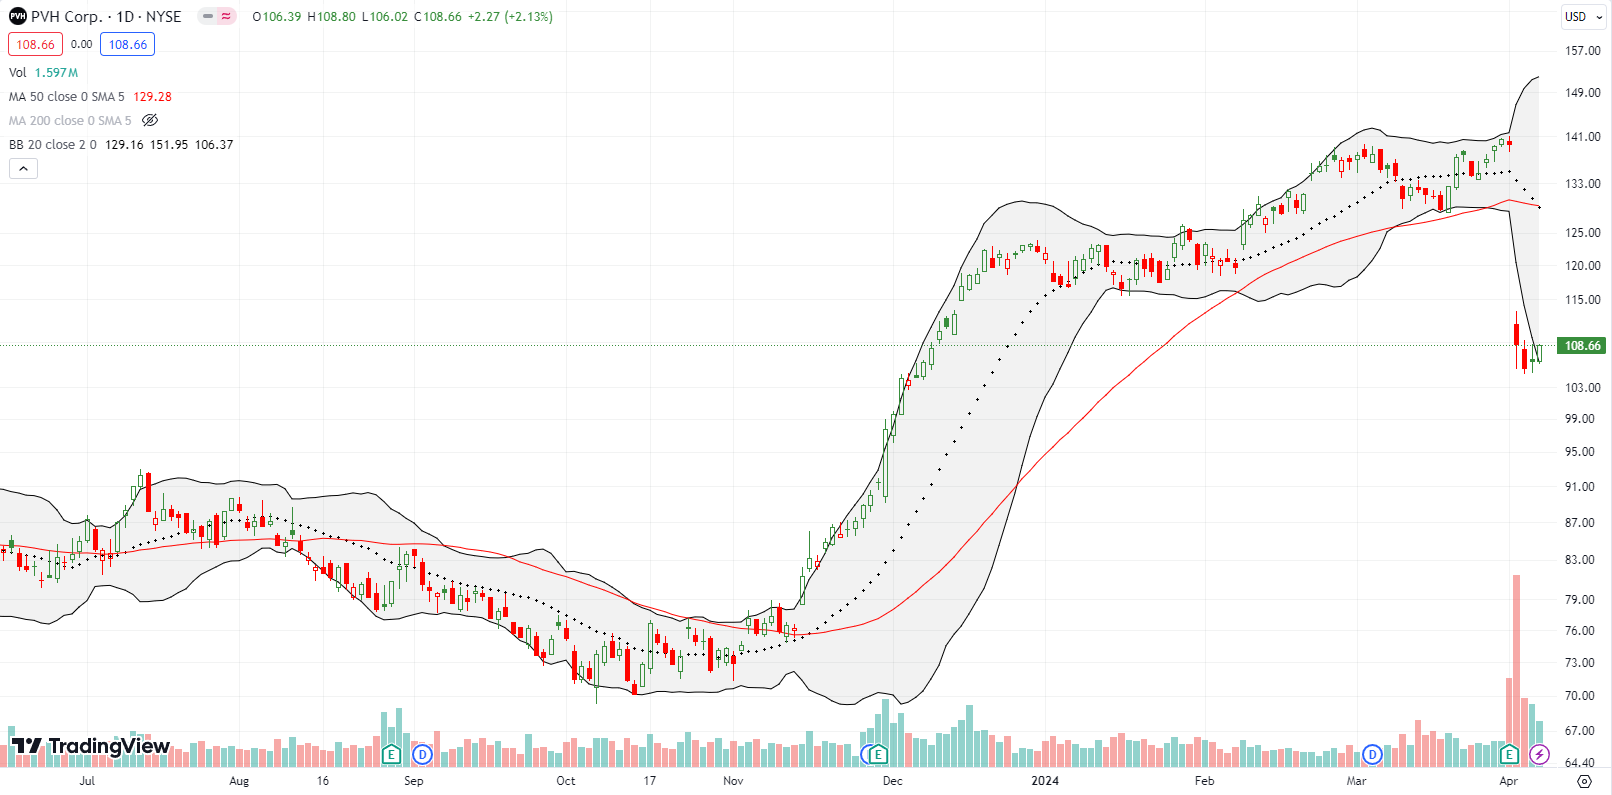
The apparel retail space took a big hit when PVH Corp collapsed 22.2% post-earnings. While the November breakout remains intact, PVH is now down for the year. PVH guided to a revenue contraction this year and earnings estimates fell short of “consensus” estimates. Thus, I will be surprised if PVH closes above its post-earnings intraday high anytime soon. Of course if PVH pulls off such a feat, I may try a trade on a continued (deadcat?) bounce to 50DMA resistance.
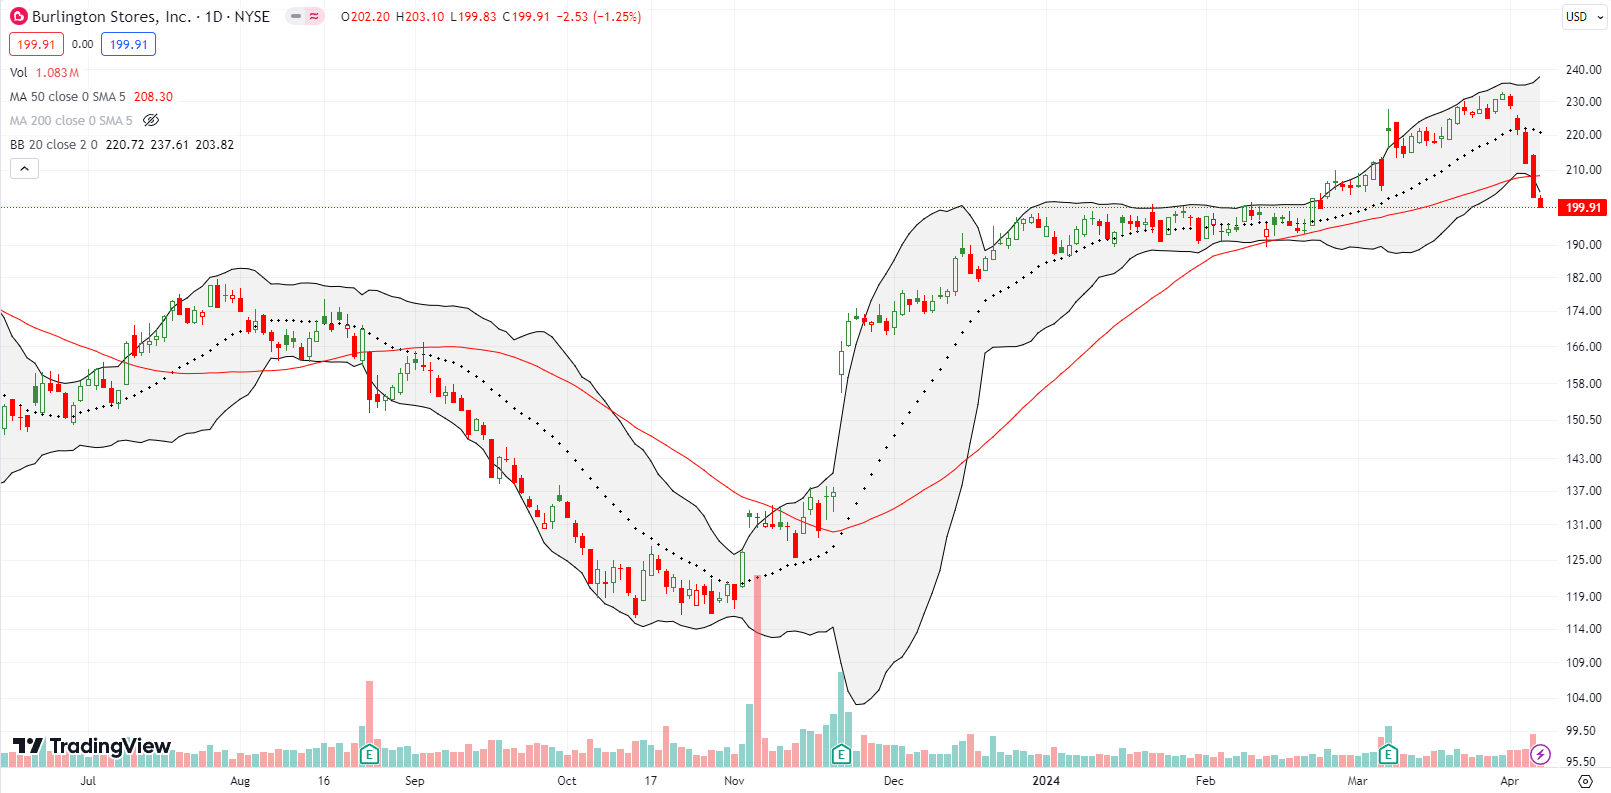
More red flags for retailers as Burlington Stores, Inc (BURL) confirmed a 50DMA breakdown. Since hitting a 14-month high, BURL has lost altitude 4 straight days on increasing trading volume. Given the context, BURL shot straight to the top of my list of shorts. Ironically, BURL was previously on my bullish shopping list given its picture-perfect and successful test of 50DMA support in February. BURL has a LONG way down if its destiny is to challenge the post-earnings gap up from November….
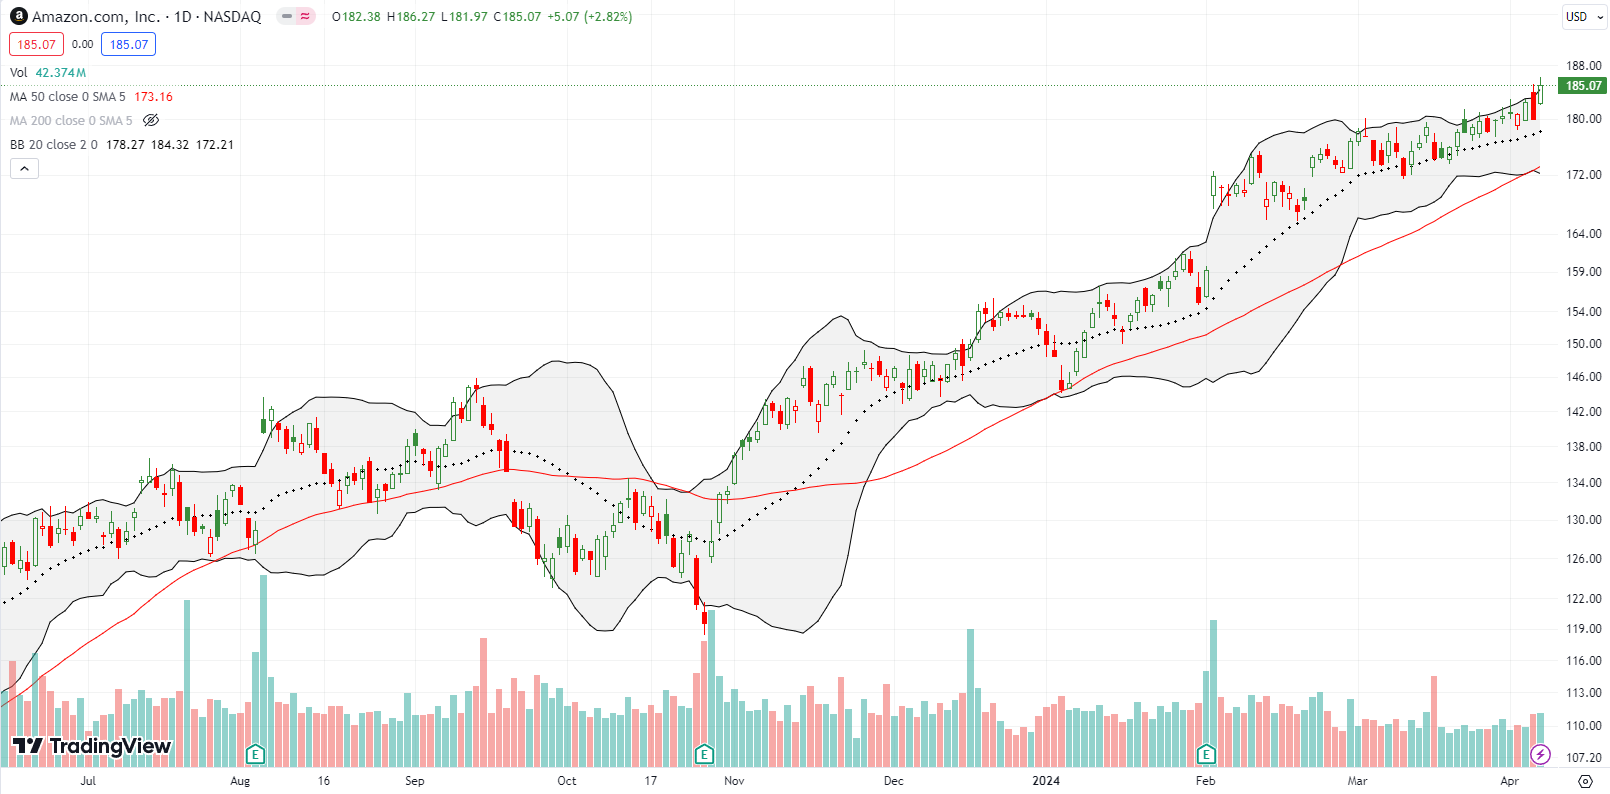
On the other retail hand, Amazon.com (AMZN) is merrily and blithely sneaking its way higher and higher. Friday’s 2.8% gain and rebound from Thursday’s setback led the way for big cap tech and the major indices. This is a “quiet” rally. I even only checked on AMZN given all the troubled trading in retail stocks last week!
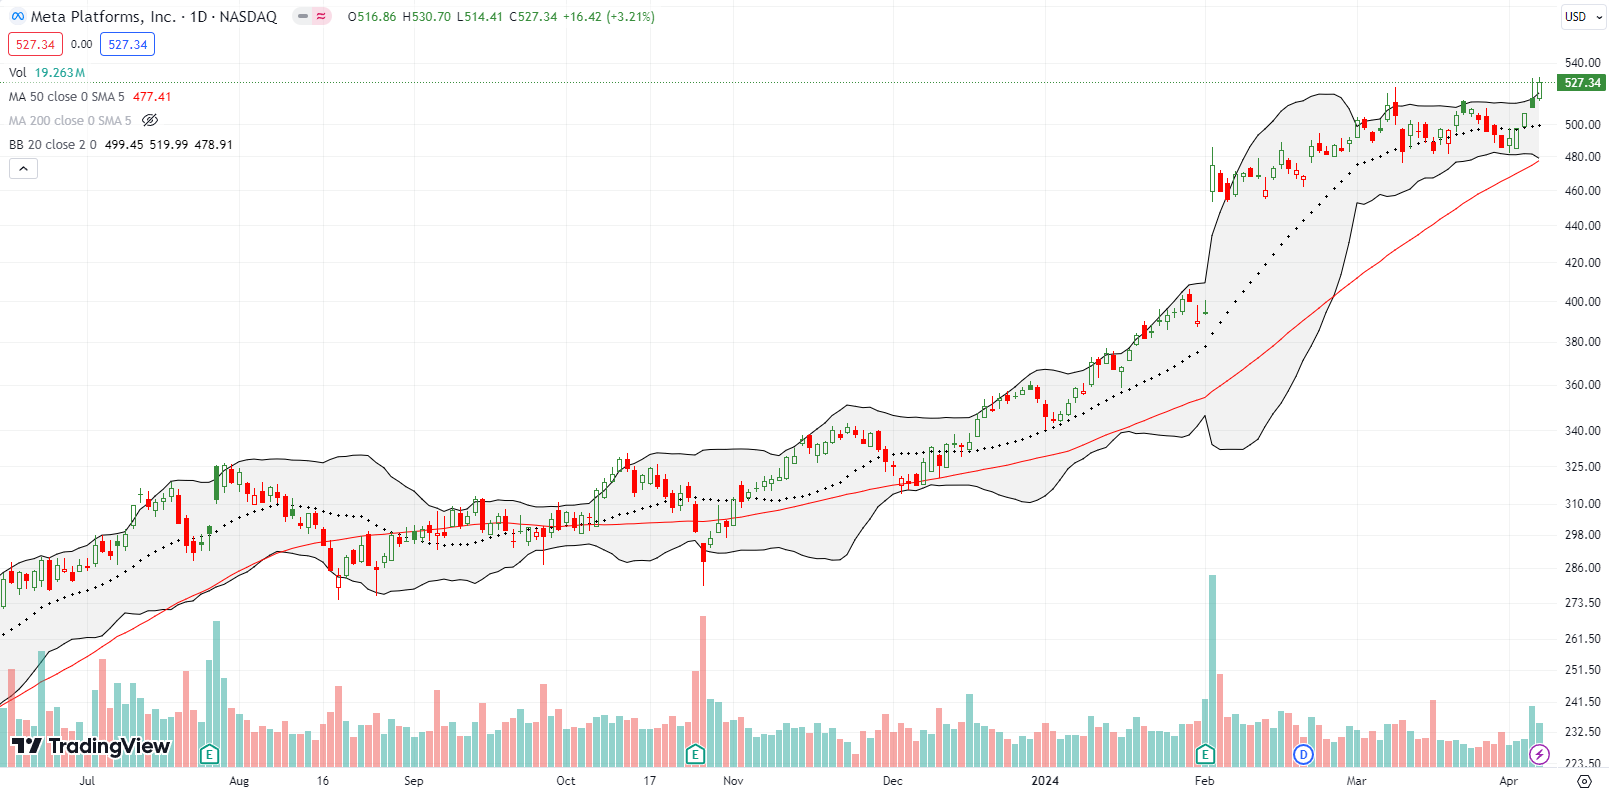
AMZN’s performance led me to check on Meta Platforms, Inc (META). The stock absorbed a blow from fresh denouncements made by Donald Trump and never traded lower. Instead, the stock churned in a range going into last week’s trading. META notably outperformed the market on Thursday with a gap higher and 0.8% gain. On Friday, META made a new all-time high and looks set to resume its rally. META looks like a good trade for call options if the VIX fails to keep a lid on the stock market’s advance.
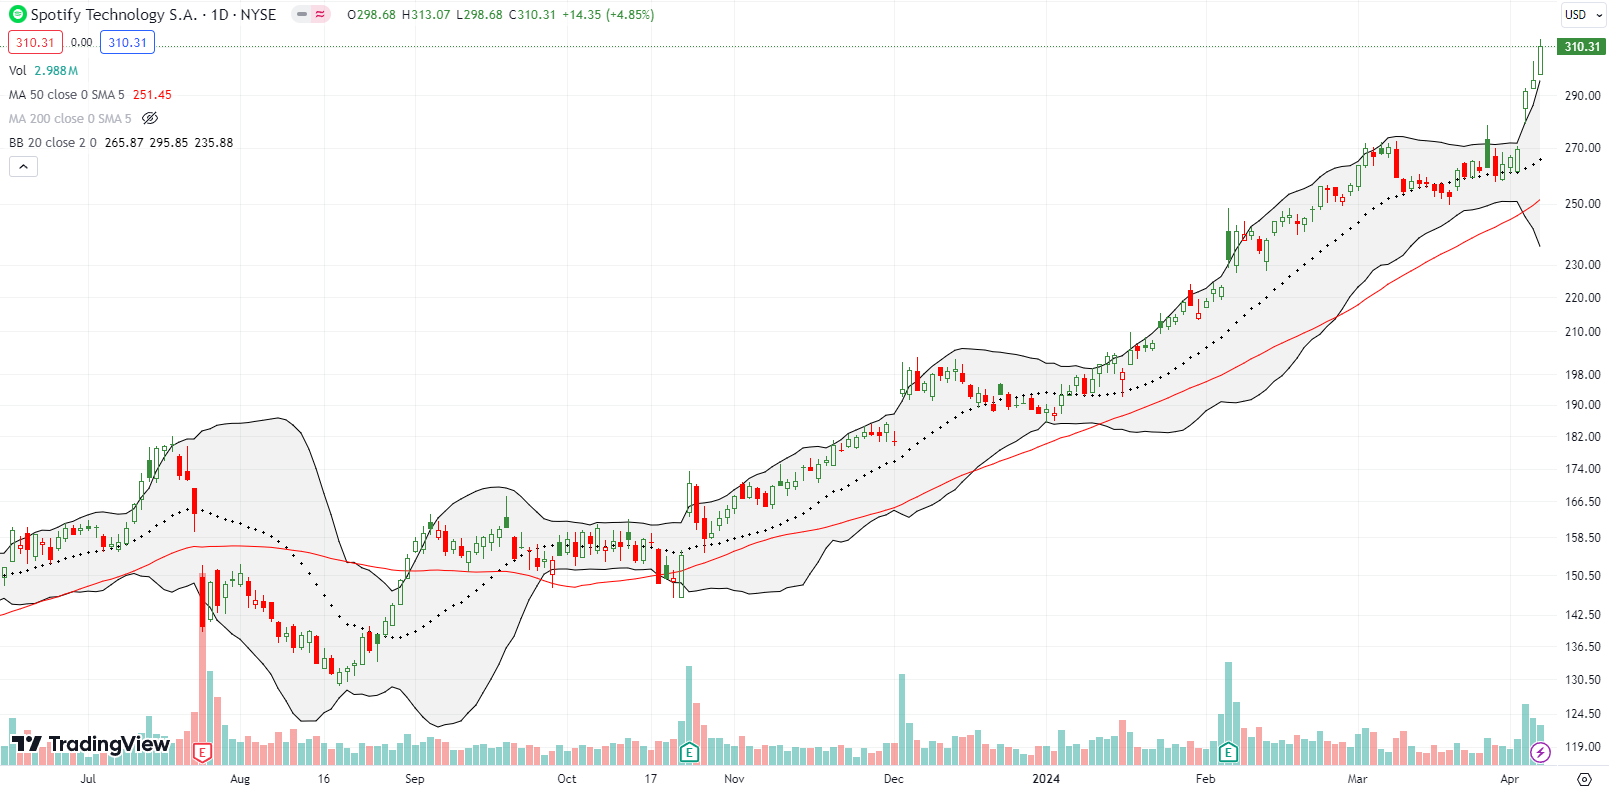
Speaking of breakouts, Spotify Technology (SPOT) “held serve” all week. On Wednesday, SPOT broke out to an all-time high on an 8.2% gain on news from Bloomberg about imminent price hikes. Wall Street welcomed this news since Spotify lost money three of the last 4 quarters and also missed earnings estimates 3 of the last 4 quarters. Analysts expect positive earnings the next 4 quarters.
The excitement is palpable as SPOT managed two higher closes all above its upper Bollinger Band (BB). SPOT is quite stretched here, but is a buy on the dips given the bullish breakout.
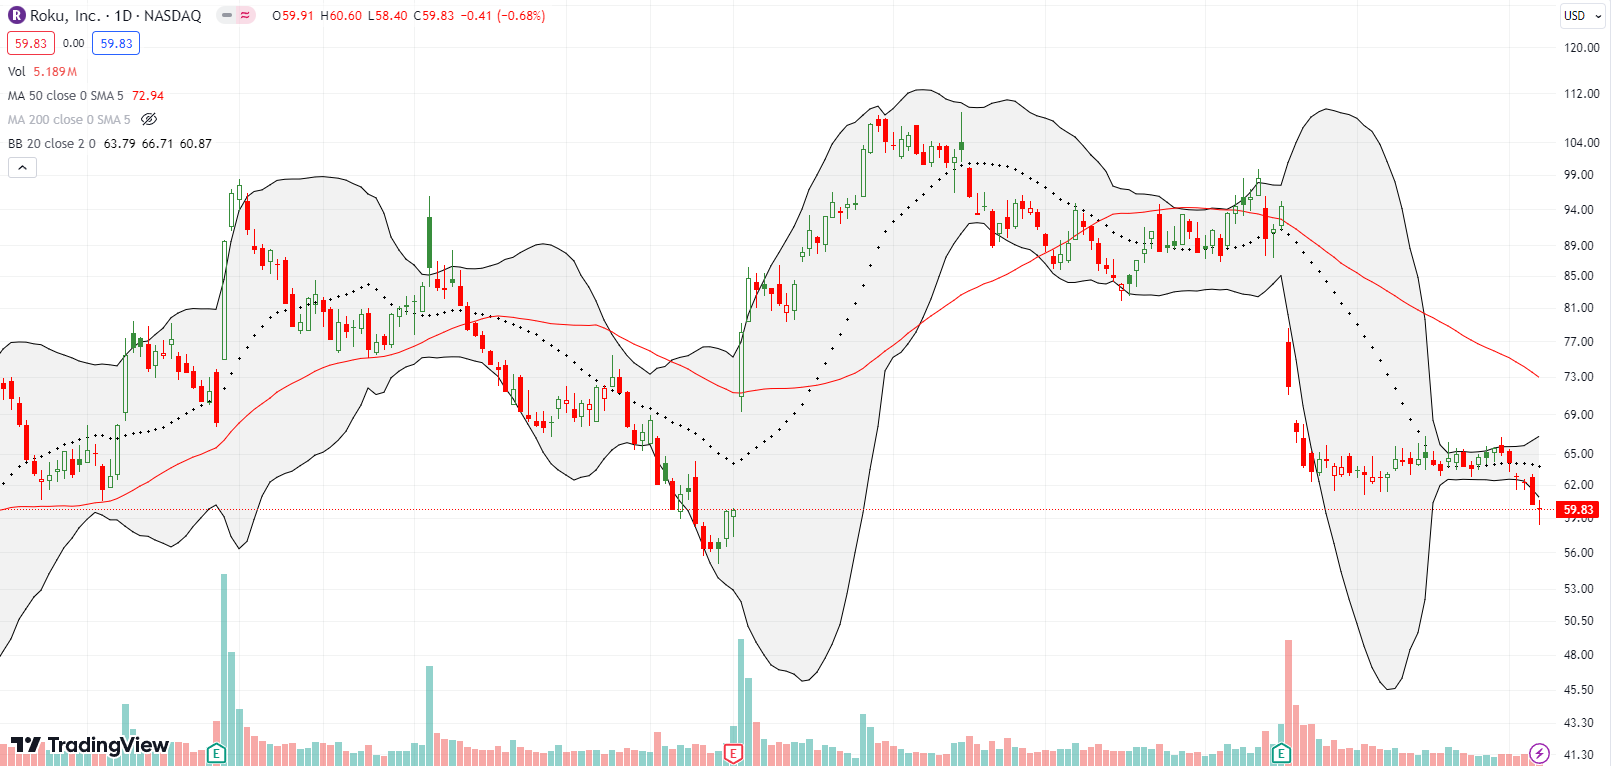
Roku, Inc (ROKU) further confirmed post-earnings weakness with a fresh breakdown last week. The streaming company has had one choppy journey on a roller coaster of excitement and disappointment. Last week’s loss finally finished reversing the post-earnings gap up and gain from November. ROKU looks like a bet for new lows with a tight stop above last week’s breakdown.
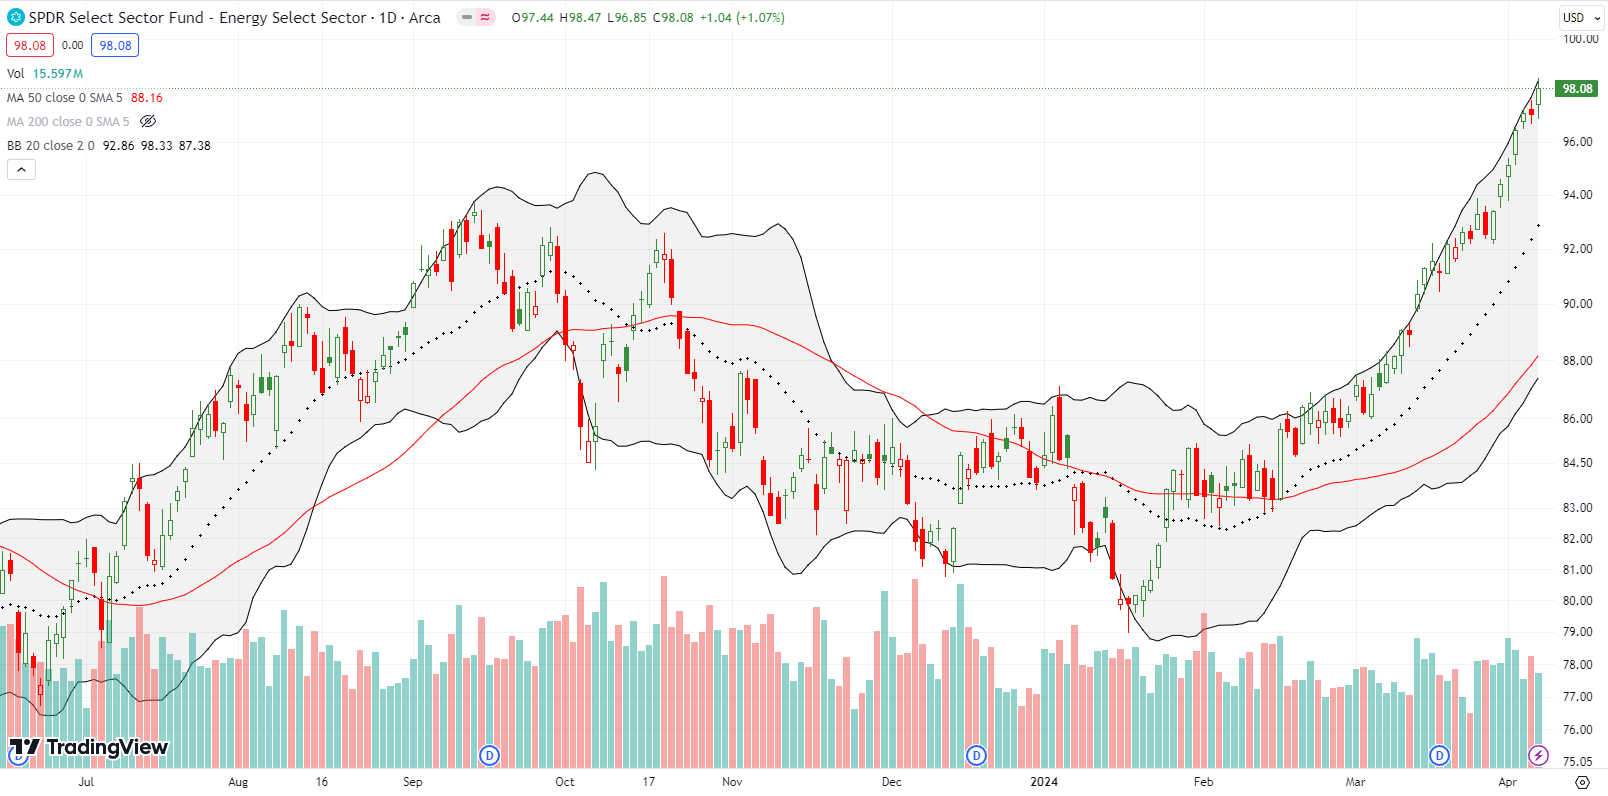
Don’t look now, but the oil complex is ripping higher. The SPDR Select Sector Fund (XLE) has rallied nearly nonstop since it successfully broke out and tested 50DMA support from January to February. Last week, XLE made a series of all-time highs. Needless to say, XLE is a buy on the dips here. I might even have to chase a bit with a “starter” position with a call calendar or vertical spread.
Be careful out there!
Footnotes
Subscribe for free to get email notifications of future posts!
“Above the 50” (AT50) uses the percentage of stocks trading above their respective 50-day moving averages (DMAs) to measure breadth in the stock market. Breadth defines the distribution of participation in a rally or sell-off. As a result, AT50 identifies extremes in market sentiment that are likely to reverse. Above the 50 is my alternative name for “MMFI” which is a symbol TradingView.com and other chart vendors use for this breadth indicator. Learn more about AT50 on my Market Breadth Resource Page. AT200, or MMTH, measures the percentage of stocks trading above their respective 200DMAs.
Active AT50 (MMFI) periods: Day #92 over 20%, Day #90 over 30%, Day #88 over 40%, Day #36 over 50% (overperiod), Day #4 under 60% (underperiod), Day #59 under 70%
Source for charts unless otherwise noted: TradingView.com
Full disclosure: long VXX puts
FOLLOW Dr. Duru’s commentary on financial markets via StockTwits, Twitter, and even Instagram!
*Charting notes: Stock prices are not adjusted for dividends. Candlestick charts use hollow bodies: open candles indicate a close higher than the open, filled candles indicate an open higher than the close.


