Stock Market Commentary
For traders like myself who follow market cycles from extreme fear to extreme euphoria, last week’s trading action was astonishing. The stock market was already well overbought and stretched going into Wednesday’s Federal Reserve meeting. Yet, buyers STILL managed to go into extreme stretch mode. The Federal Reserve essentially declared the death of inflation, and buyers snatched almost everything not nailed down. The Fed further stretched overbought conditions with only minimal signs of cooling on Friday after New York Federal Reserve President John Williams insisted that the Fed is NOT talking about rate cuts. The full CNBC interview suggested Williams had a quibble with semantics as he talked about bringing policy down over 3 years or “over the course of time.”
The stock market now looks set to follow through on a historical pattern of strength following a strong performance going into July. From “What historically happens after stocks soar through July” in Yahoo Finance on the S&P 500: “…when the January-through-July returns were 10% or more…these years return on average 4.8% from August to December with 95% of the results positive.” This year, the S&P 500 was up 19.5% through the end of July thanks to the summer of loving stocks. The market swooned from there until a bottom coming out of October’s oversold trading. The incredible subsequent rally brought the S&P 500 all the way back to a 2.8% gain since the end of July. History is back on track. Fortunately, I kept this analysis in my back pocket after I wrote about it at the end of July.
The Stock Market Indices
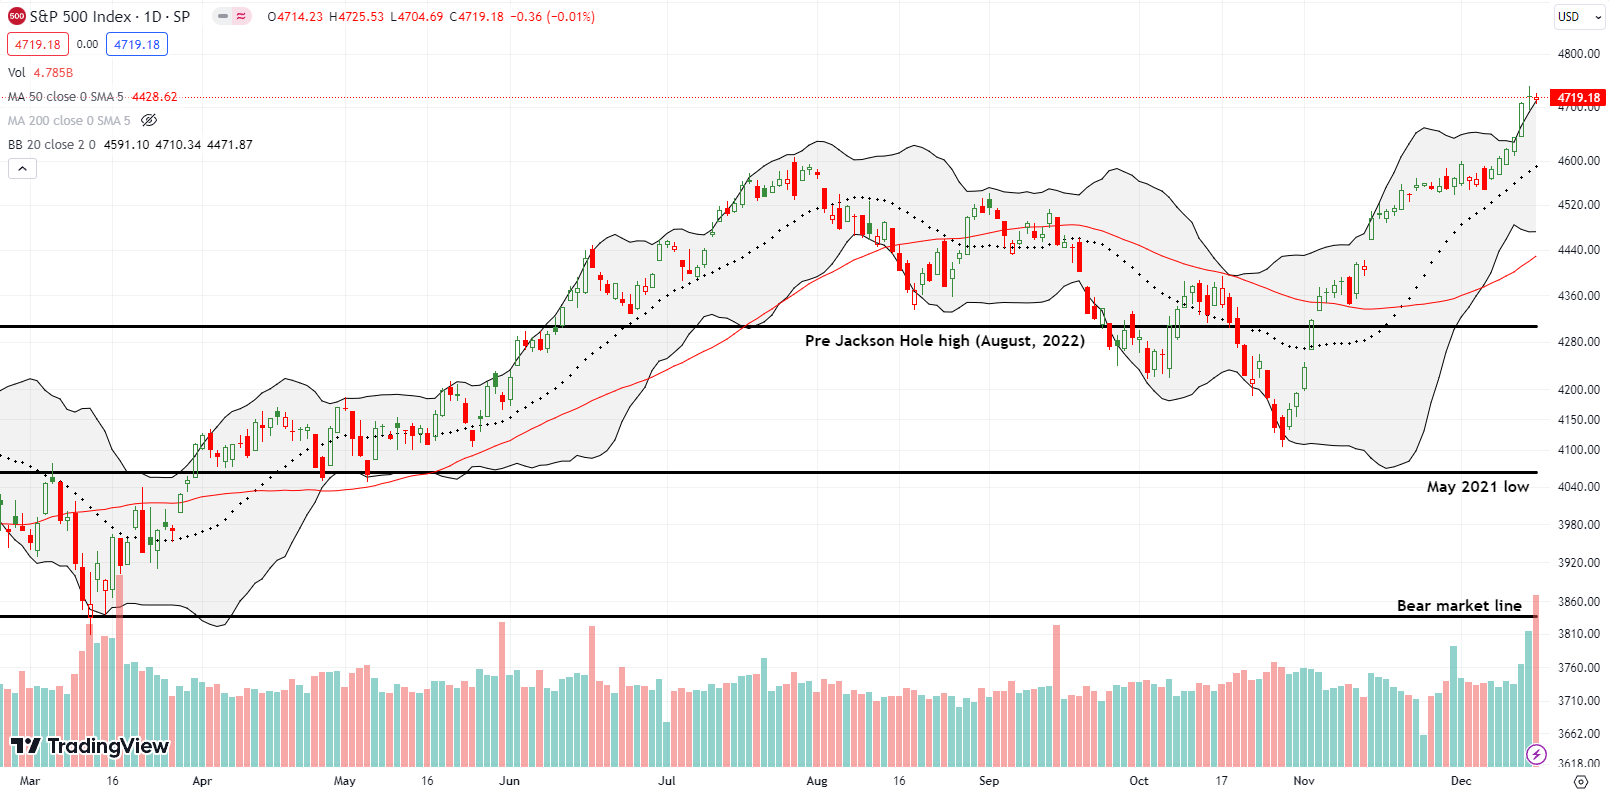
The S&P 500 (SPY) surged 1.4% post-Fed. While the buying slowed down the next two days, the index maintained a hold on stretched conditions at the upper Bollinger Band (BB). Trading at 23-month highs, the S&P 500 has easily confirmed its breakout earlier this month. How long can buyers keep prices levitating with overbought conditions further stretched?
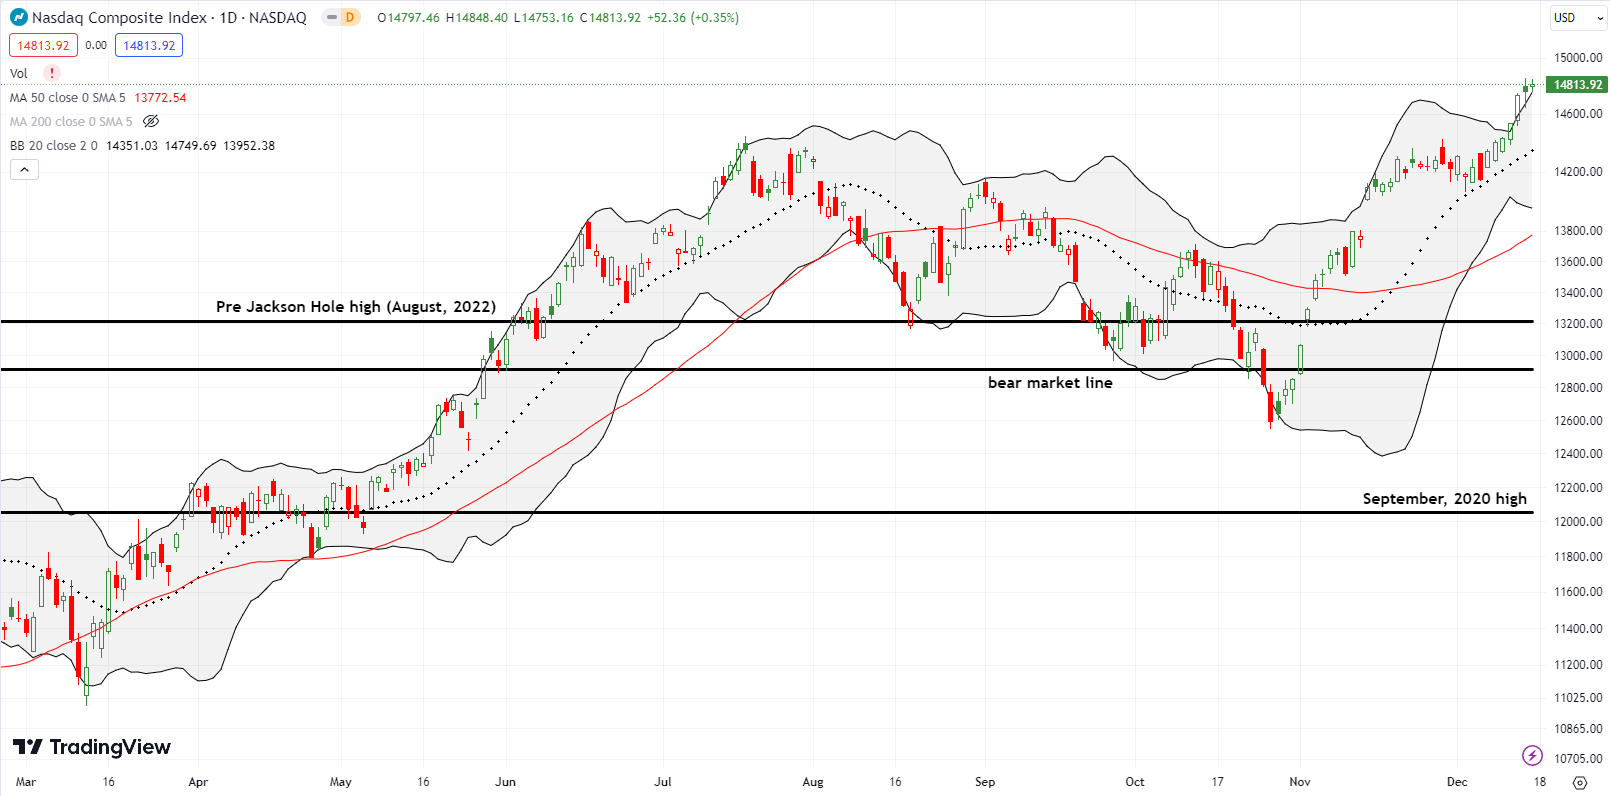
While the S&P 500 ended Friday marginally lower, the NASDAQ (COMPQ) closed Friday with a decent 0.4% gain. The tech-laden index had the same post-Fed gain as the S&P 500, but its outburst looked more distinctly like the upward resolution of a BB-squeeze. In other words, the tech bulls are well-positioned going into Christmas even with an intervening pullback.
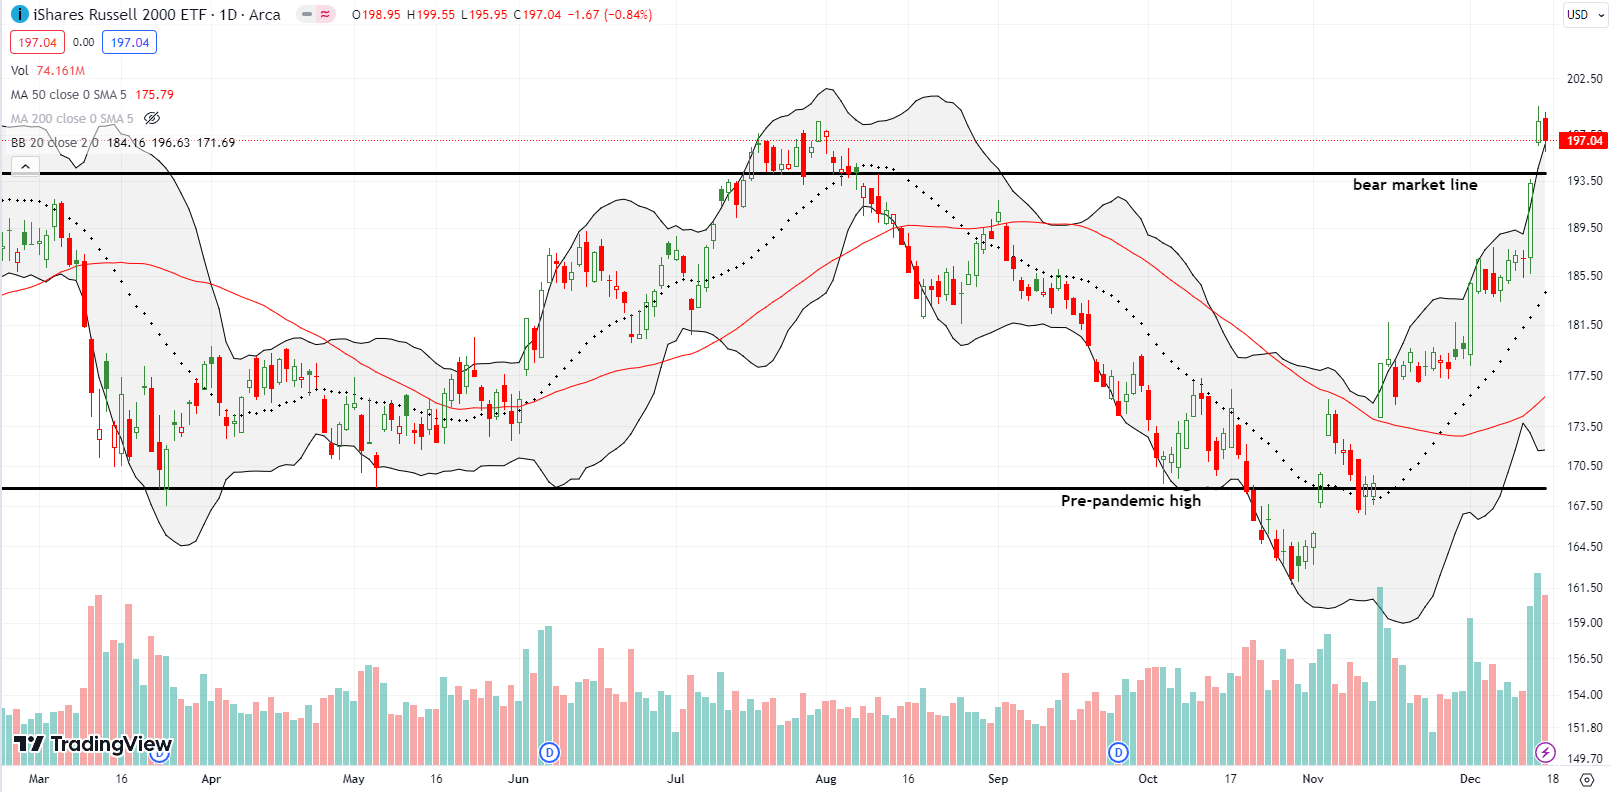
The iShares Russell 2000 ETF (IWM) was the most startling mover of the major indices. The ETF of small caps surged 3.4% post-Fed, and the next day it gapped over its bear market line with a 2.8% gain. IWM closed exactly at its high of the year set on July 31st, so Friday’s 0.8% pullback takes on additional significance. Buyers will need to regroup above the bear market line and make a fresh push. I bet on such a dynamic with a fresh calendar call spread. I am still kicking myself for not being positioned ahead of the Fed!
The Short-Term Trading Call With Overbought Further Stretched
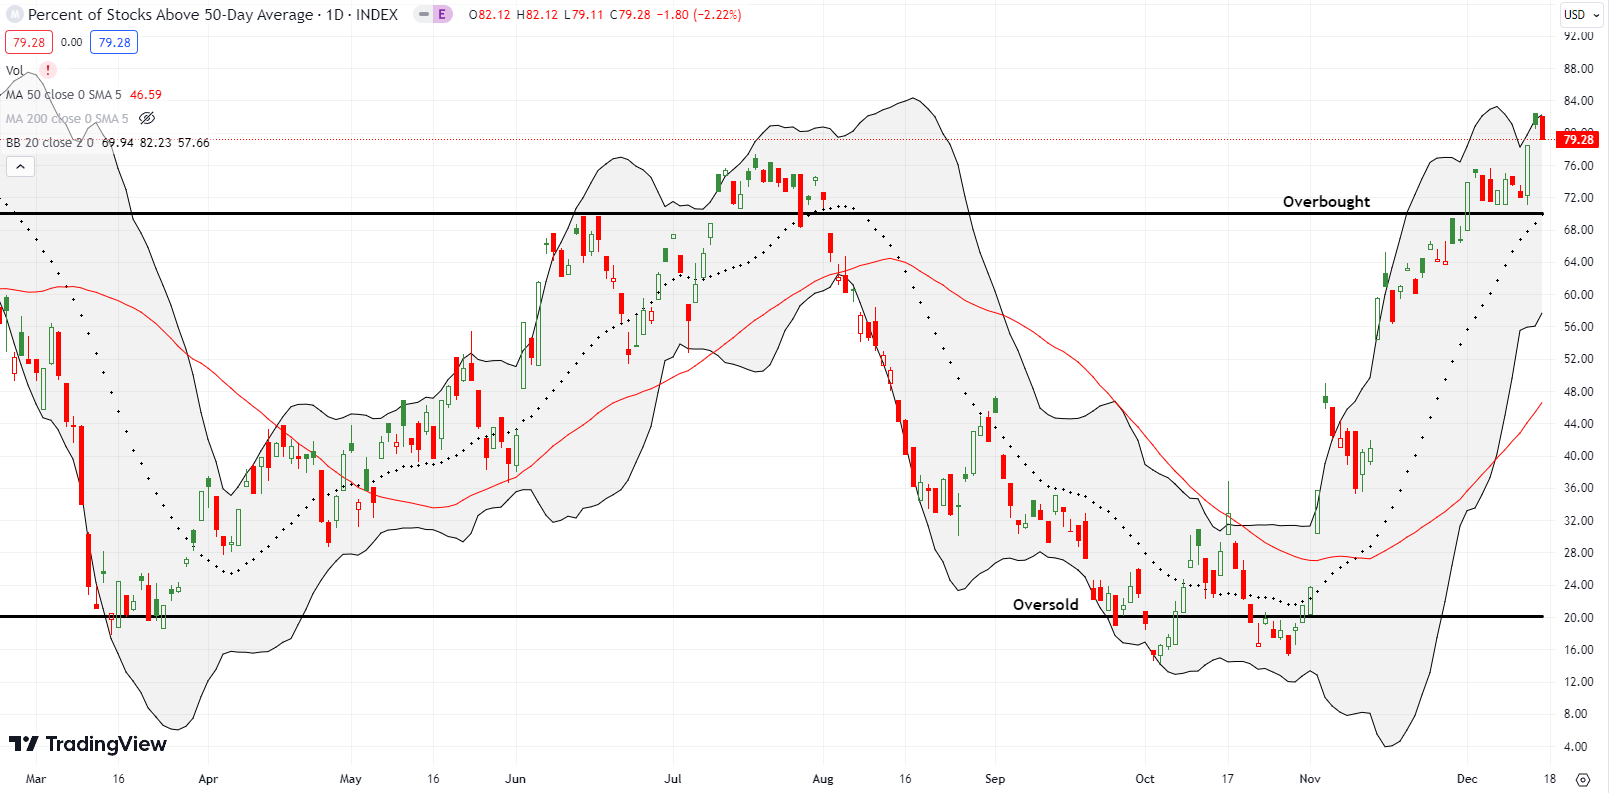
- AT50 (MMFI) = 79.2% of stocks are trading above their respective 50-day moving averages (11th overbought day)
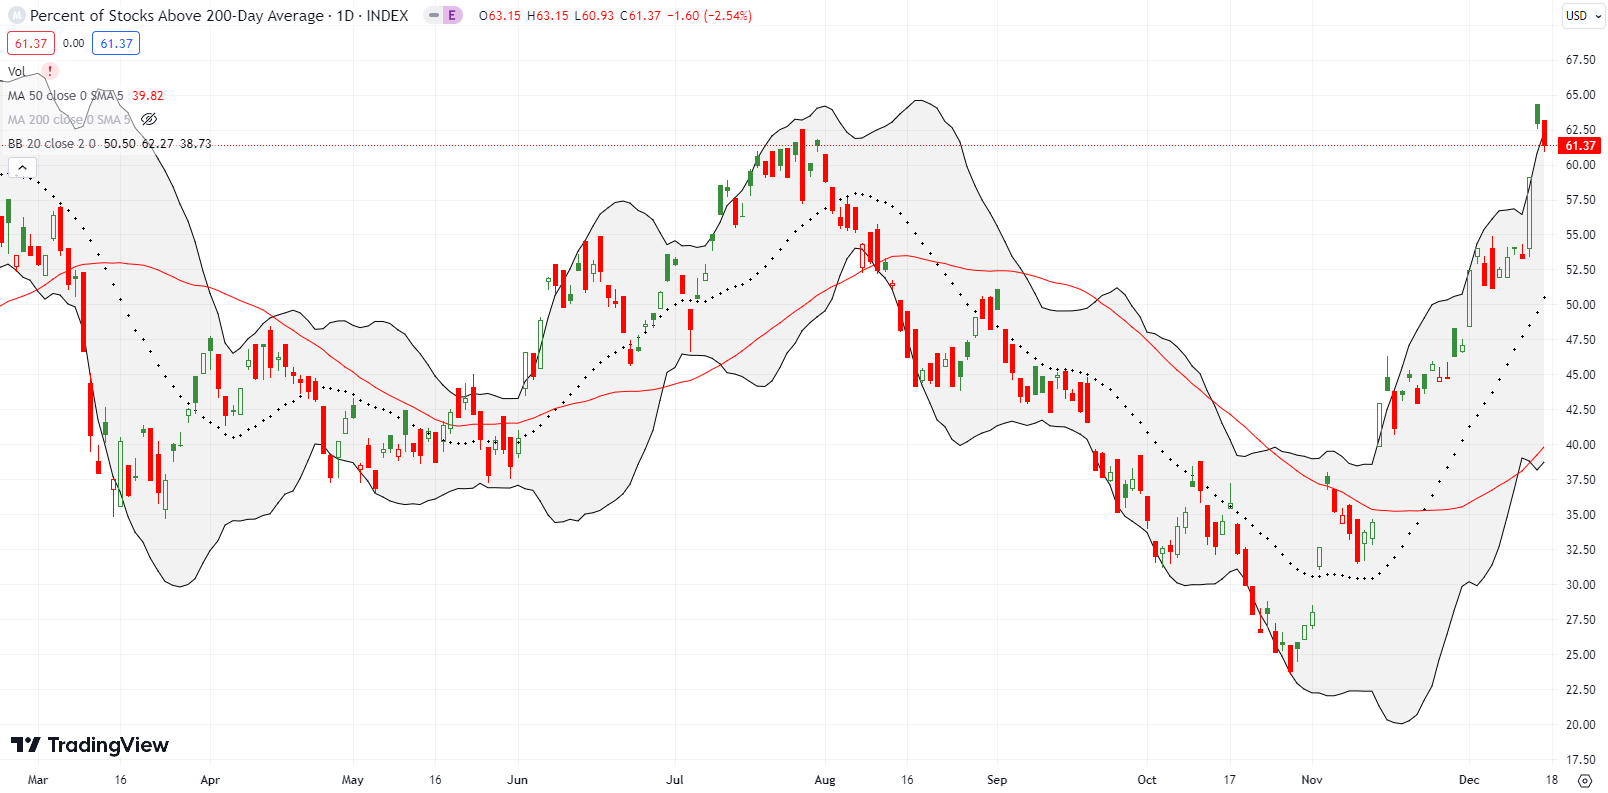
- AT200 (MMTH) = 61.3% of stocks are trading above their respective 200-day moving averages
- Short-term Trading Call: neutral
AT50 (MMFI), the percentage of stocks trading above their respective 50DMAs, spent one day above 80% before settling in to close the week at 79.2%. My favorite technical indicator used the post-Fed celebration to surge away from the overbought threshold. Now, AT50 is on its 11th straight day in overbought territory. As overbought gets further overstretched, an extended overbought rally looks underway. On the flip side, the end of overbought conditions could signal a sustained top! In between, I remain neutral with little interest in shorting stocks beyond hedges against bullish positions.
This CNBC video summarizes well for me the mood year-end. “Everybody understands this: you can buy stocks without buying the seven stocks [the Magnificent Seven] and that’s the trade right now. I think that trade carries us through. I have tears in my eyes. It’s like the end of a romantic comedy. Everything fell into place. We’re going out with a VIX at 12! What else do you want?!?” This declaration is the language of an overbought period further stretched.
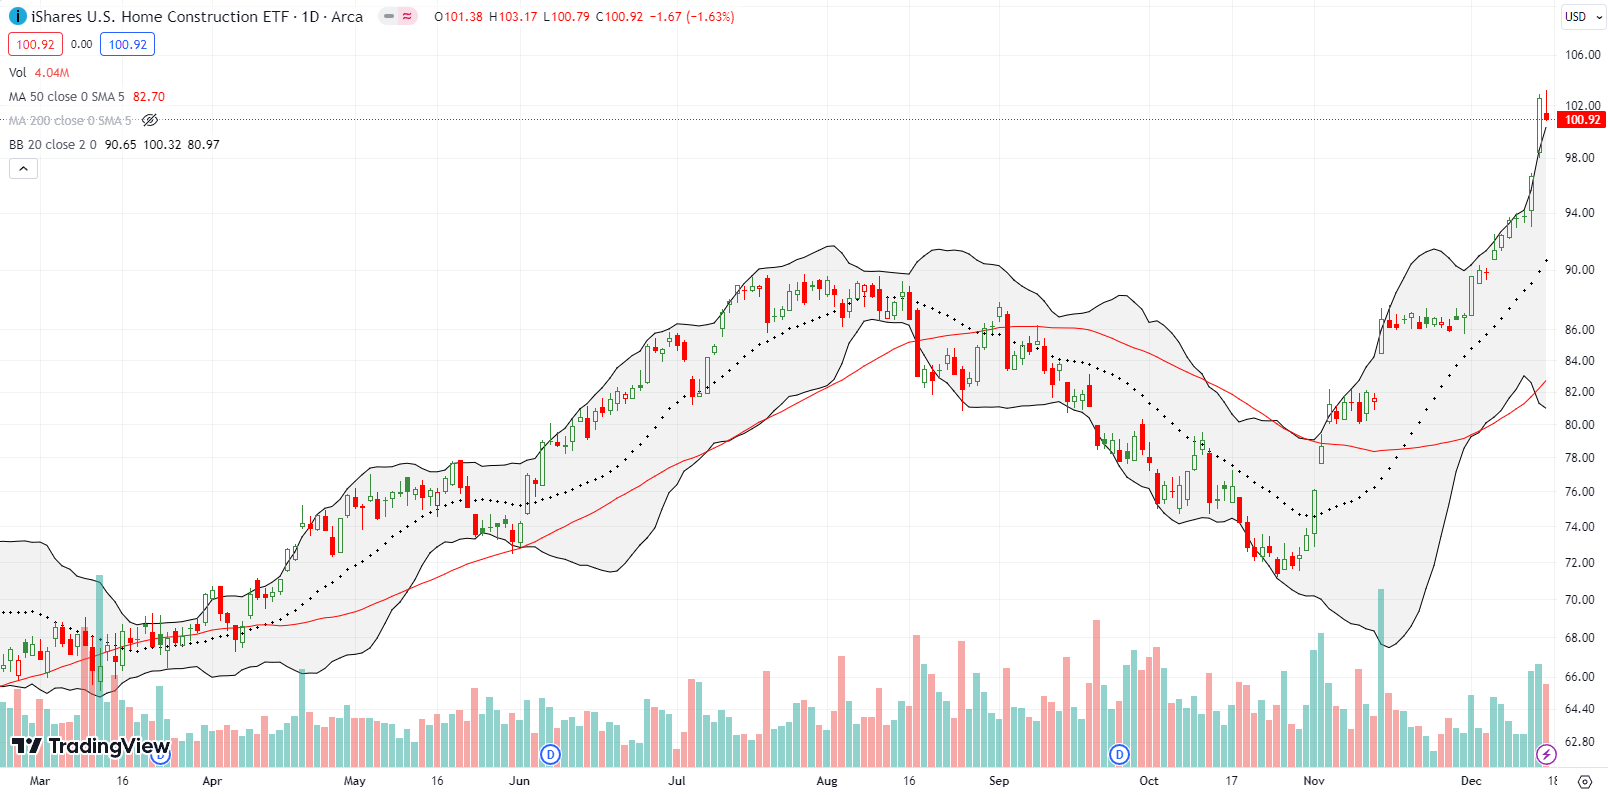
Living in a rate sensitive industry, home builders were the signature trade last week in the midst of the post-Fed celebration. The iShares U.S. Home Construction ETF jumped to an all-time high on Wednesday with a 3.1% surge. Buyers were far from done. The next day, ITB went parabolic with a 6.2% run-up and close above the upper-BB. Needless to say, I took profits on all my remaining trades on the seasonal strength of home builders. The timing is exceptionally early, but the downside risks are unacceptably high for hanging around such upside extremes. Friday’s cooling still left ITB above its upper BB. ITB is up 37.3% since the end of October versus 12.5% for the S&P 500.
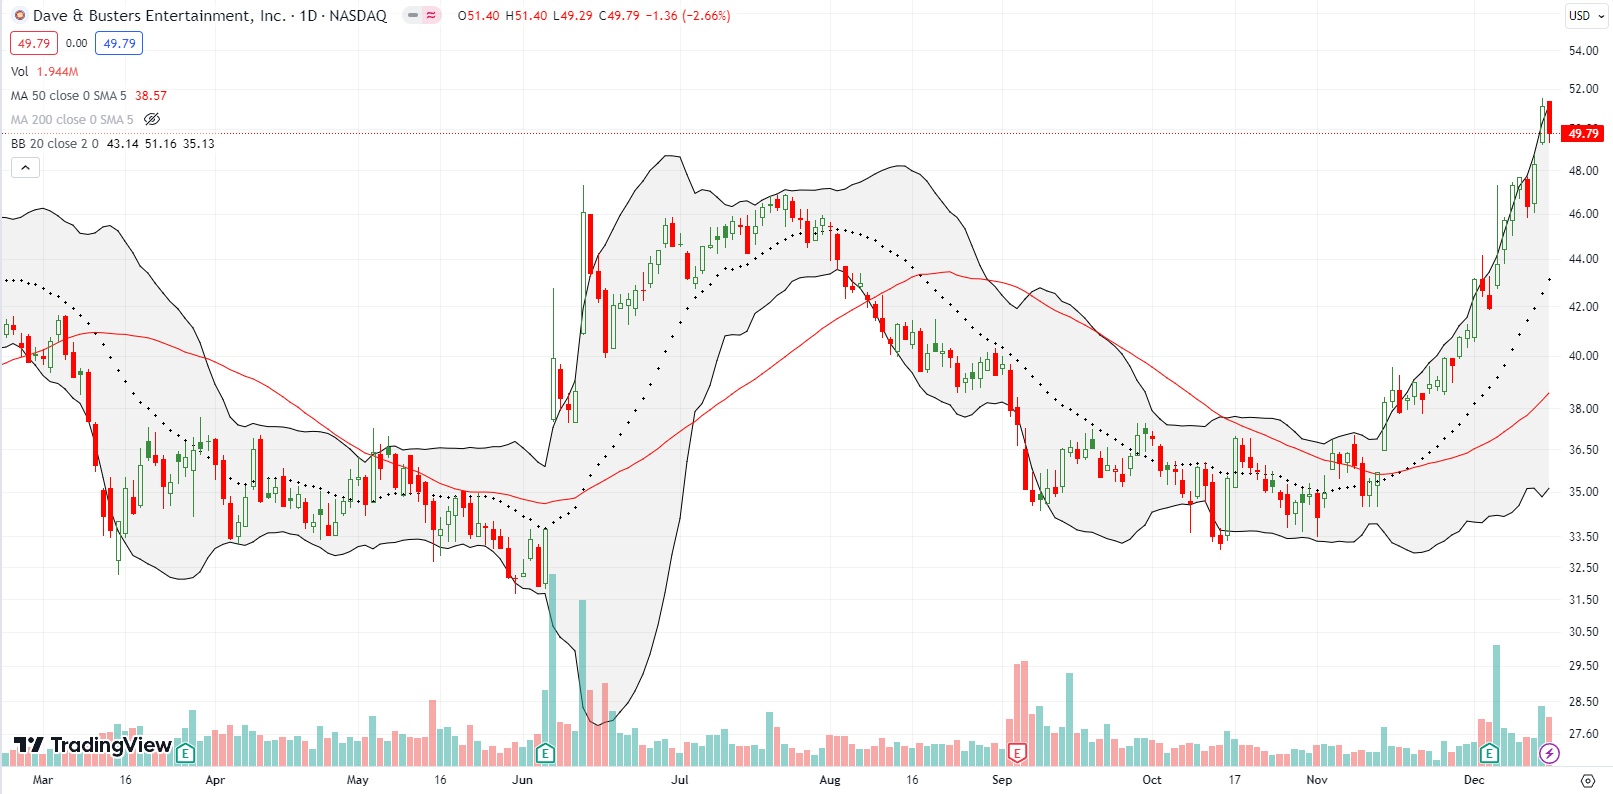
I started the year making the case for Dave & Busters Entertainment, Inc (PLAY) given insider buying. The subsequent yo-yo trading action allowed me to rinse and repat the trade multiple times. So it seems appropriate, even poetic, that I end the year with another winning run-up in PLAY; my last covered call position was called away Friday evening. This experience was also a good lesson in following through on a hypothesis and focusing on execution until proven wrong. In this case, wrong never came. Now, PLAY trades at a 21-month high and at the top of a 3-year trading range. Needless to say, I am eagerly awaiting the next pullback.
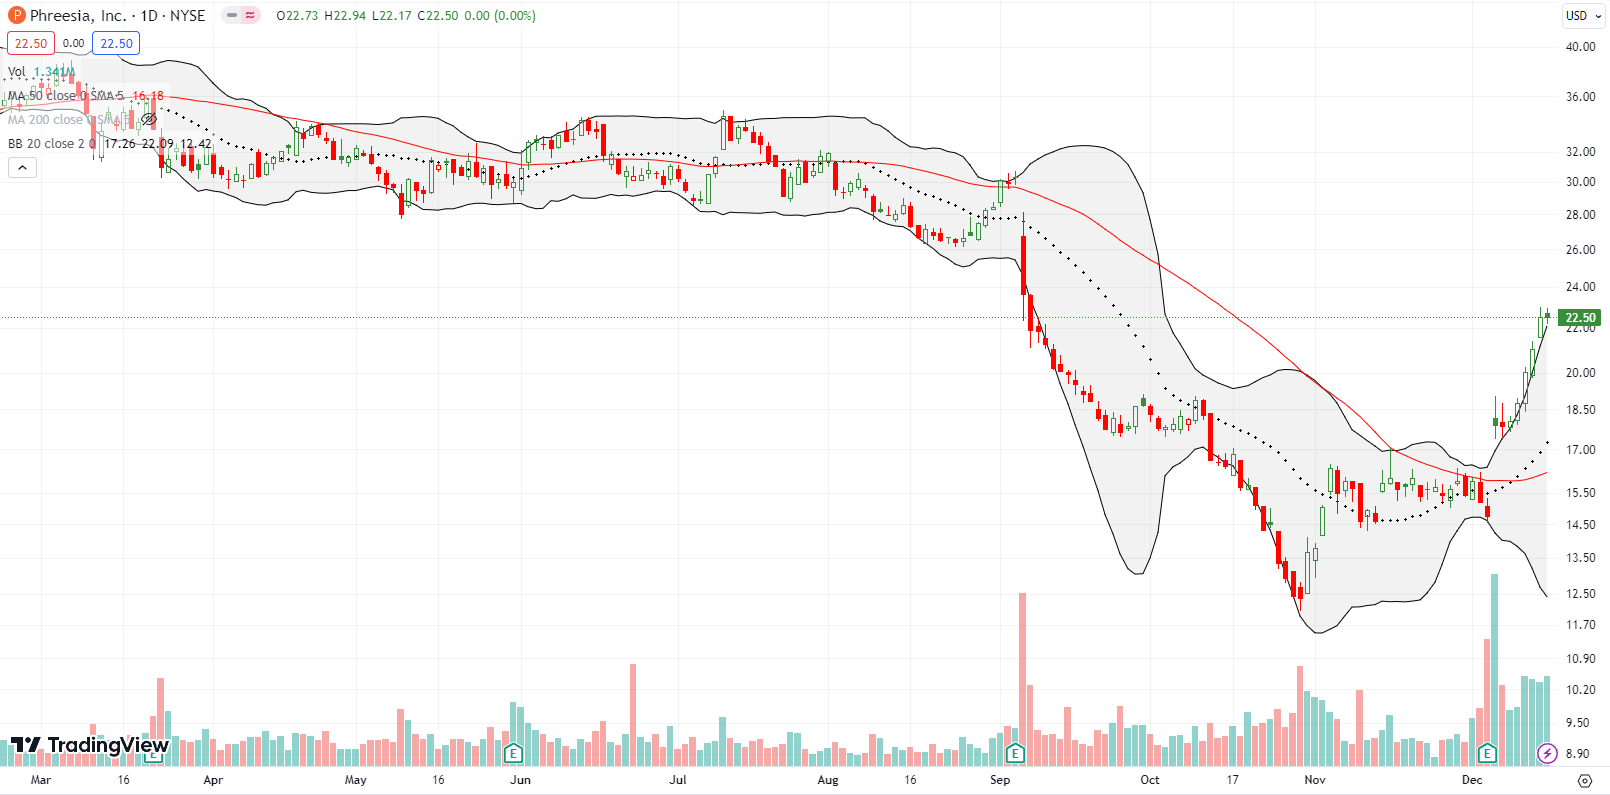
I wrote about Phreesia, Inc (PHR) on Seeking Alpha. Given the setup, I was prepared to buy on a post-earnings downward drift. Instead, PHR took off last week as traders and investors seemed to be in a mad scramble to pick up stocks still beaten up for the year and looking “cheap.” I am now reconciled to buying at a higher price than originally expected. These dynamics provided the backdrop for my latest trade school video on how to identify (tradeable) bottoms.
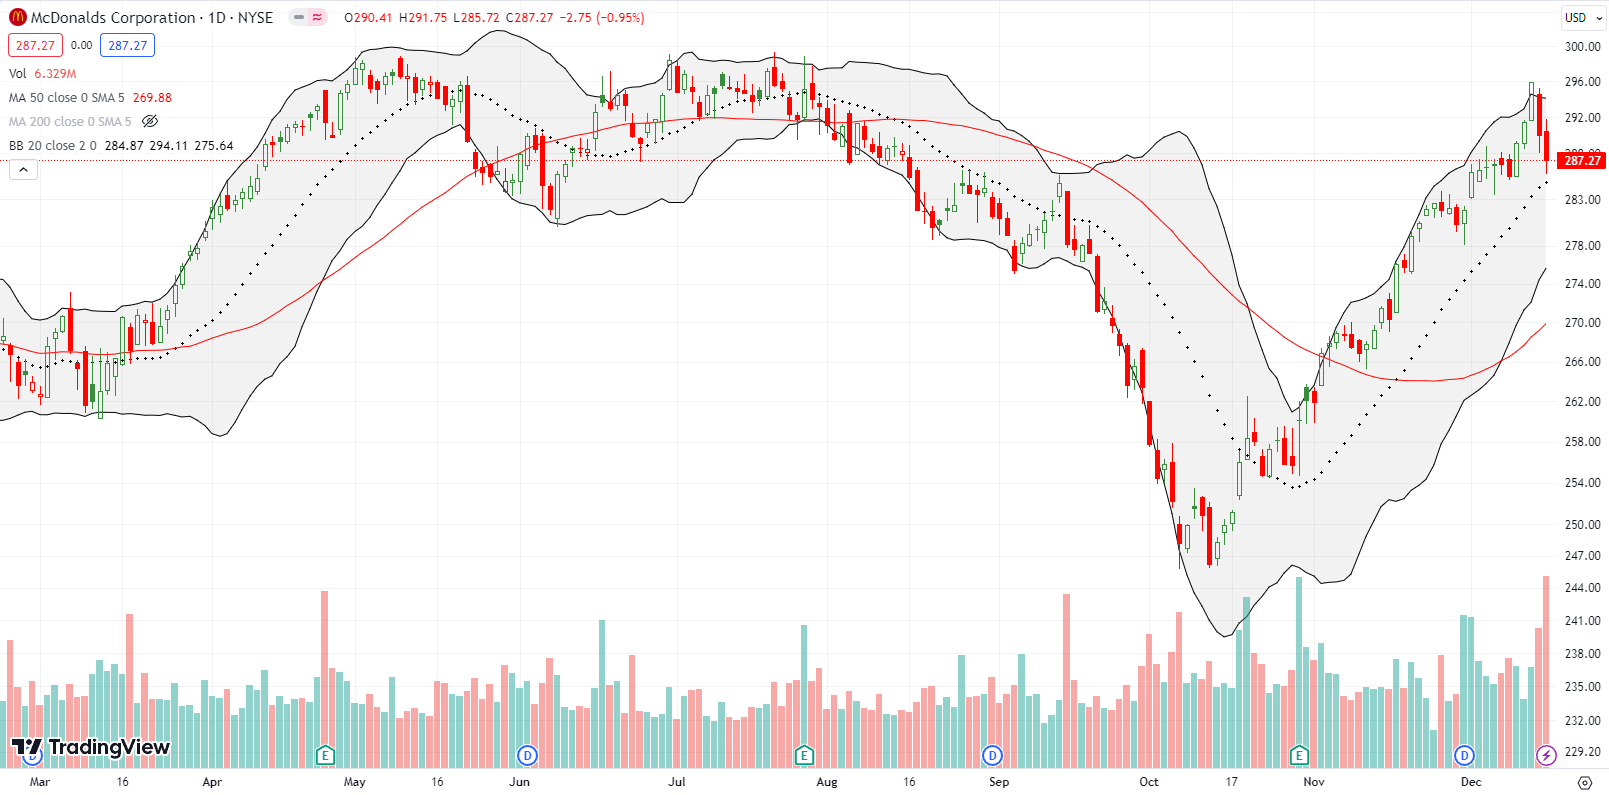
McDonalds Corporation (MCD) has had an amazing V-shaped recovery from its September/October swoon. However, the buying frenzy may have hit a kind of blow-off top. A 1.6% post-Fed gain closed MCD above its upper-BB. MCD gapped down the next day and sellers essentially took MCD back to its uptrending 20DMA for the first time since October. Now the onus is on buyers to invalidate the blow-off top and keep the recovery going.
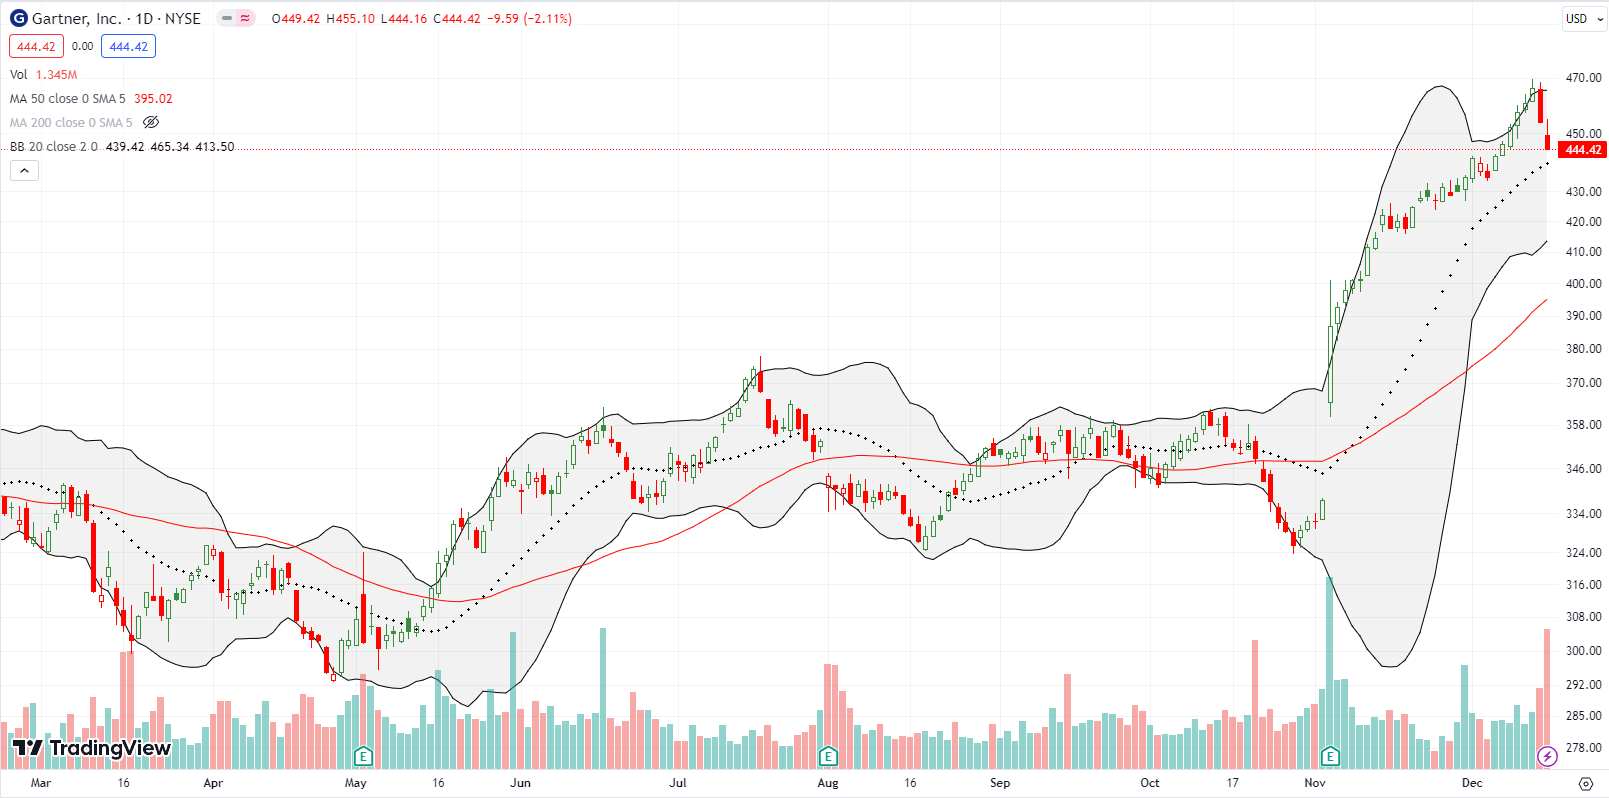
Sellers are also trying to cool off business research and advisory company Gartner, Inc (IT). A 14.6% post-earnings surge in November sent IT to a fresh all-time high and buyers barely paused until now. I am watching closely for support at the 20-day moving average (DMA) to hold and set up a buying opportunity. If that support does not hold, IT will likely struggle to make much more progress until a test of 50DMA support.
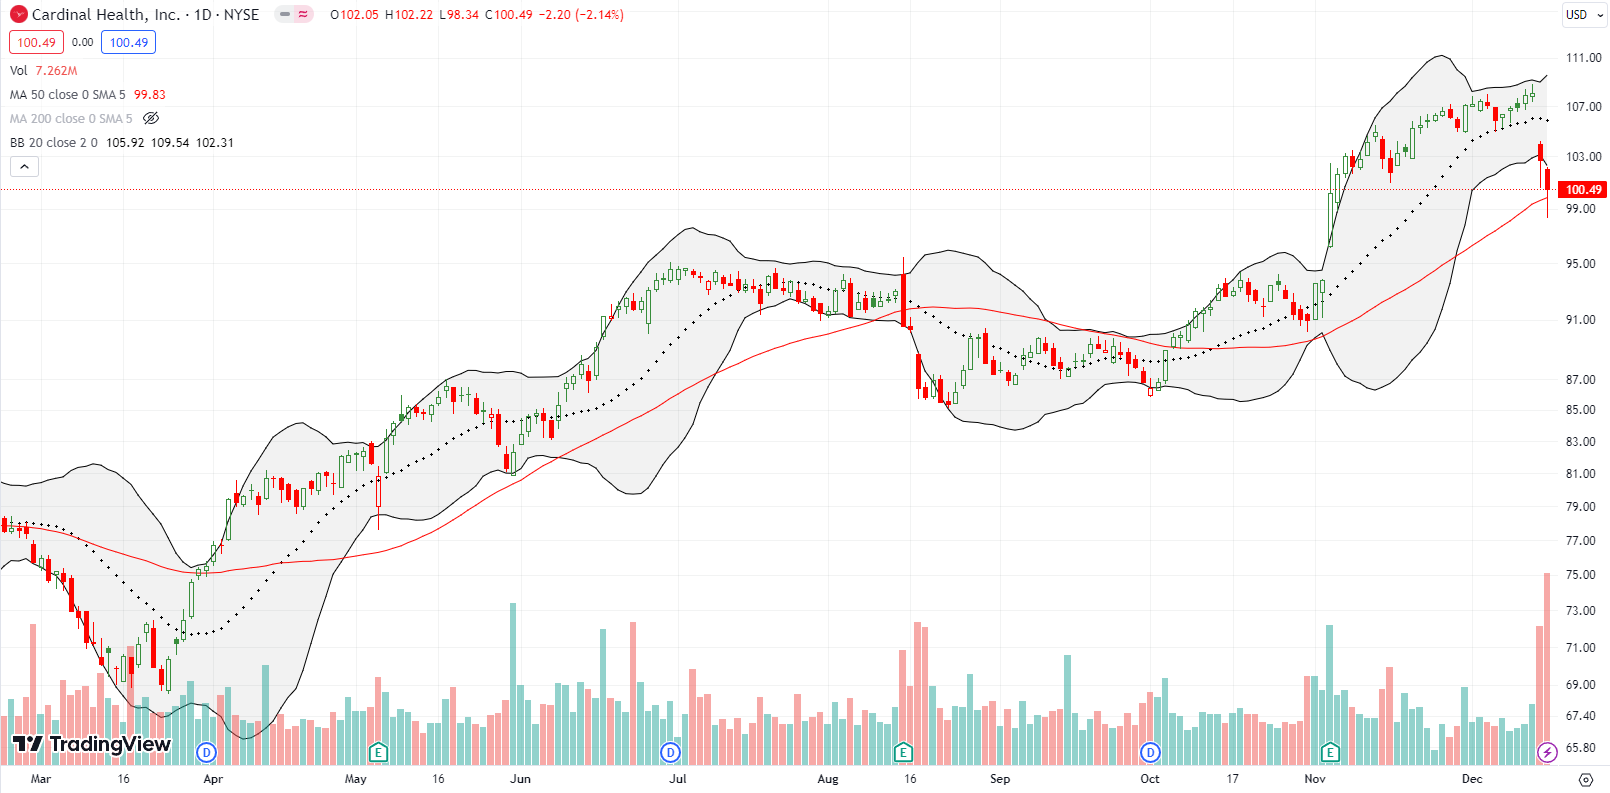
Cardinal Health, Inc (CAH) is a stark example of how analysts can ruin an otherwise technically strong trade. CAH surged 6.9% post-earnings in early November and drifted its way higher from there. The serene trading was rudely interrupted on Thursday after an analyst downgraded CAH to underweight and a $96 price target. That target would take CAH to a full reversal of its post-earnings gains. Buyers have tried to fight back with intraday bounces. Friday’s intraday bounce is important given the temporary 50DMA breakdown. I am eyeing CAH for a buy on a close above Friday’s intraday high. Regardless, CAH reminded me of the lingering, usually hidden, downside risks inherent in lofty individual stocks that lose analyst support.
Be careful out there!
Footnotes
Subscribe for free to get email notifications of future posts!
“Above the 50” (AT50) uses the percentage of stocks trading above their respective 50-day moving averages (DMAs) to measure breadth in the stock market. Breadth defines the distribution of participation in a rally or sell-off. As a result, AT50 identifies extremes in market sentiment that are likely to reverse. Above the 50 is my alternative name for “MMFI” which is a symbol TradingView.com and other chart vendors use for this breadth indicator. Learn more about AT50 on my Market Breadth Resource Page. AT200, or MMTH, measures the percentage of stocks trading above their respective 200DMAs.
Active AT50 (MMFI) periods: Day #28 over 20%, Day #26 over 30%, Day #24 over 40%, Day #23 over 50%, Day #20 over 60%, Day #11 over 70% (11th day overbought)
Source for charts unless otherwise noted: TradingView.com
Full disclosure: long IWM calendar call spread, long ITB
FOLLOW Dr. Duru’s commentary on financial markets via StockTwits, Twitter, and even Instagram!
*Charting notes: Stock prices are not adjusted for dividends. Candlestick charts use hollow bodies: open candles indicate a close higher than the open, filled candles indicate an open higher than the close.


