

Stock Market Commentary
Despite strike one and strike two against the market rally, buyers are stretching out this overbought period. The jobs report for November seemed to further support the case of an economy that survived the Fed’s rate hike cycle even as the case recedes for near-term rate cuts. The stock market responded by sending the S&P 500 and the NASDAQ to new highs for the year even though market breadth did not make a new high for this cycle.
Still, the case for the bulls remains intact as the stock market rounds the bend to the last Federal Reserve meeting of the year. The Fed is unlikely to get more hawkish (and what would be the point at this juncture without actual rate hikes?), thus the outstanding question is whether the Fed will dare add more fuel to the rally with even hints of dovish talk.
The Stock Market Indices
The S&P 500 (SPY) almost cleared its intraday high of the year. Friday’s 0.4% gain did produce a 21-month closing high. Stare closely at the chart below, and you can see the index has a slight upward bias coming out of a near two-week consolidation period that included a false breakout. Thus, if buyers continue stretching out from here an extended overbought period could unfold.
")
The NASDAQ (COMPQ) does not quite have the “lean” of the S&P 500, especially given the width of the on-going consolidation period. Friday’s 0.5% gain for the tech laden index failed to clear the intraday high of the month or the year. Still, the NASDAQ last closed this high 20 months ago. The defense of the 20-day moving average (DMA) (the dotted line) looks solid for now.
")
The iShares Russell 2000 ETF (IWM) roared into the week but failed to stretch above Monday’s ending price on a closing basis. The ETF of small caps stayed in a range for the rest of the week except for a brief moment on Wednesday that sellers promptly faded. I took a small profit on my latest IWM calendar call spread and did not buy a fresh one for the coming week. I am a buyer again on a breakout or a test of 20DMA support.
")
The Short-Term Trading Call While Stretching Out
- AT50 (MMFI) = 74.2% of stocks are trading above their respective 50-day moving averages (6th overbought day)
- AT200 (MMTH) = 53.4% of stocks are trading above their respective 200-day moving averages
- Short-term Trading Call: neutral
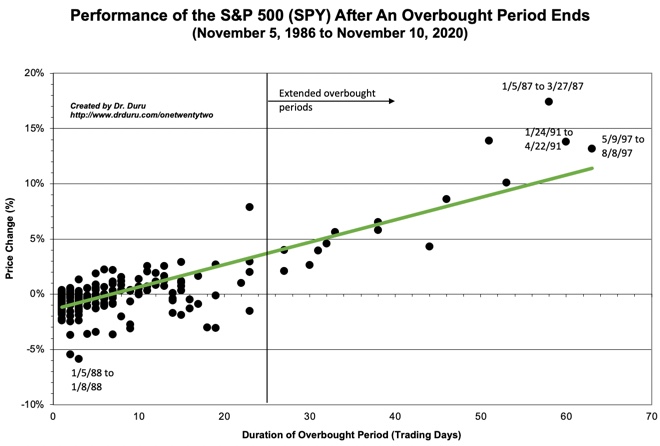
AT50 (MMFI), the percentage of stocks trading above their respective 50DMAs, hit its high for this overbought cycle on Monday and settled down from there. My favorite technical indicator closed the week at 74.2% and is stretching out just above the overbought threshold of 70%. At 6 days old and an S&P 500 performance of 0.2% over that time, the overbought period has room to grow if buyers continue their interest in stretching things out. The chart below from the archives shows how the end of the overbought period typically ends negatively until day 20.
Godaddy Inc (GDDY) is an old school web hosting company. I am amazed to see this performance. On November 22nd, GDDY brought a 5-year trading range to an end with a breakout to an all-time high. On that day, RBC Capital Markets upgraded the stock to overweight with a $124 price target (implying there is still 20% of upside). GDDY soared 13.8% post-earnings in early November, and the stock has been stretching out ever since!
")
Electronic document signing company DocuSign, Inc (DOCU) is the classic pandemic stock. Its long-term chart looks exactly like a bubble with an eye-popping 3-month ramp starting March, 2020, a peak in August, 2021, and a stomach-curdling one-year plunge starting in November 2021. This year’s October low almost set an all-time low for the stock and was around 87% off the all-time high. So DOCU caught my interest for earnings last week.
The post-earnings trade was wild starting with after hours. At Friday’s open, DOCU gapped down and almost touched 20DMA support. At that point, DOCU began stretching out for an eventual 4.8% post-earnings gain. This trading action has the signature of a bottom in the making where sellers finally exhaust themselves. While I successfully sold a call spread ahead of earnings, I am now looking at the stock as a buy on the dips with a stop below the post-earnings intraday low.
")
The generative AI ecosystem hit the headlines bigtime last week, and I was well-prepared with my aggressive generative AI trade. I came into the week with an aging AMD Dec $125/$135 call spread. I added a Dec $125 call when AMD tested 20DMA support the previous Friday. The trades looked shaky after Wednesday’s fade. The very next day Advanced Micro Devices (AMD) soared 9.9% and tested its high of the year in the wake of three major AI-related news releases. I took profits on the extra call and held the call spread. I was late in lowering my ambitious profit target on Friday, so now the clock is officially ticking on my spread’s profit.
")
Alphabet, Inc (GOOG) added to the electricity by the release of Gemini, what Alphabet calls its “largest and most capable AI model.” I came into the week with an accumulation of Dec $140 call options, and I took profits as GOOG soared from its lower Bollinger Band for a 5.3% gain and 20/50DMA breakout. However, in a flashback to Google’s initial gaffes with the release of BARD, Gemini took fire from faked performances during the Gemini demo. GOOG gapped down on Friday but managed to hold 20/50 DMA support. Ignoring the noise and sticking with my aggressive generative AI trade, I rolled right back into a fresh call spread. I started with a diagonal $138/$140 calendar.
")
NVIDIA Corporation (NVDA) did not make a big news splash, but its technical performance was suspenseful. I bought a $470/$480 call spread as NVDA rallied off 50DMA support on Tuesday. The trade looked in danger on Wednesday’s fade but the 50DMA held as perfect support for the third day in a row. NVDA started stretching out from there and tested 20DMA resistance on Friday. I held the position looking for a 20DMA breakout before the Fed hands down its judgement.
")
Home builder stocks keep stretching out. In my last Housing Market Review I discussed the all-time highs racing ahead of the market data. The seasonal strength is in full effect as the iShares US Home Construction ETF (ITB) is up 29.1% since the end of October while the S&P 500 is up 10.5% since then. Even the NASDAQ is “only” up 12.1% since then.
")
")
")
Be careful out there!
Footnotes
Subscribe for free to get email notifications of future posts!
“Above the 50” (AT50) uses the percentage of stocks trading above their respective 50-day moving averages (DMAs) to measure breadth in the stock market. Breadth defines the distribution of participation in a rally or sell-off. As a result, AT50 identifies extremes in market sentiment that are likely to reverse. Above the 50 is my alternative name for “MMFI” which is a symbol TradingView.com and other chart vendors use for this breadth indicator. Learn more about AT50 on my Market Breadth Resource Page. AT200, or MMTH, measures the percentage of stocks trading above their respective 200DMAs.
Active AT50 (MMFI) periods: Day #23 over 20%, Day #21 over 30%, Day #19 over 40%, Day #18 over 50%, Day #15 over 60%, Day #6 over 70% (6th day overbought)
Source for charts unless otherwise noted: TradingView.com
Full disclosure: long call spreads in AMD, GOOG, and NVDA; long ITB
FOLLOW Dr. Duru’s commentary on financial markets via StockTwits, Twitter, and even Instagram!
*Charting notes: Stock prices are not adjusted for dividends. Candlestick charts use hollow bodies: open candles indicate a close higher than the open, filled candles indicate an open higher than the close.