Stock Market Commentary
The sentiment shifts following the bounce from oversold conditions swung from bullish and encouraging to tantalizing and disappointing. The stock market has a precarious setup going into a likely October swoon. The prospects for the current oversold bounce to prevent the October swoon hinge on a swirl of technical signs and fundamental dangers in the economy.
The Stock Market Indices
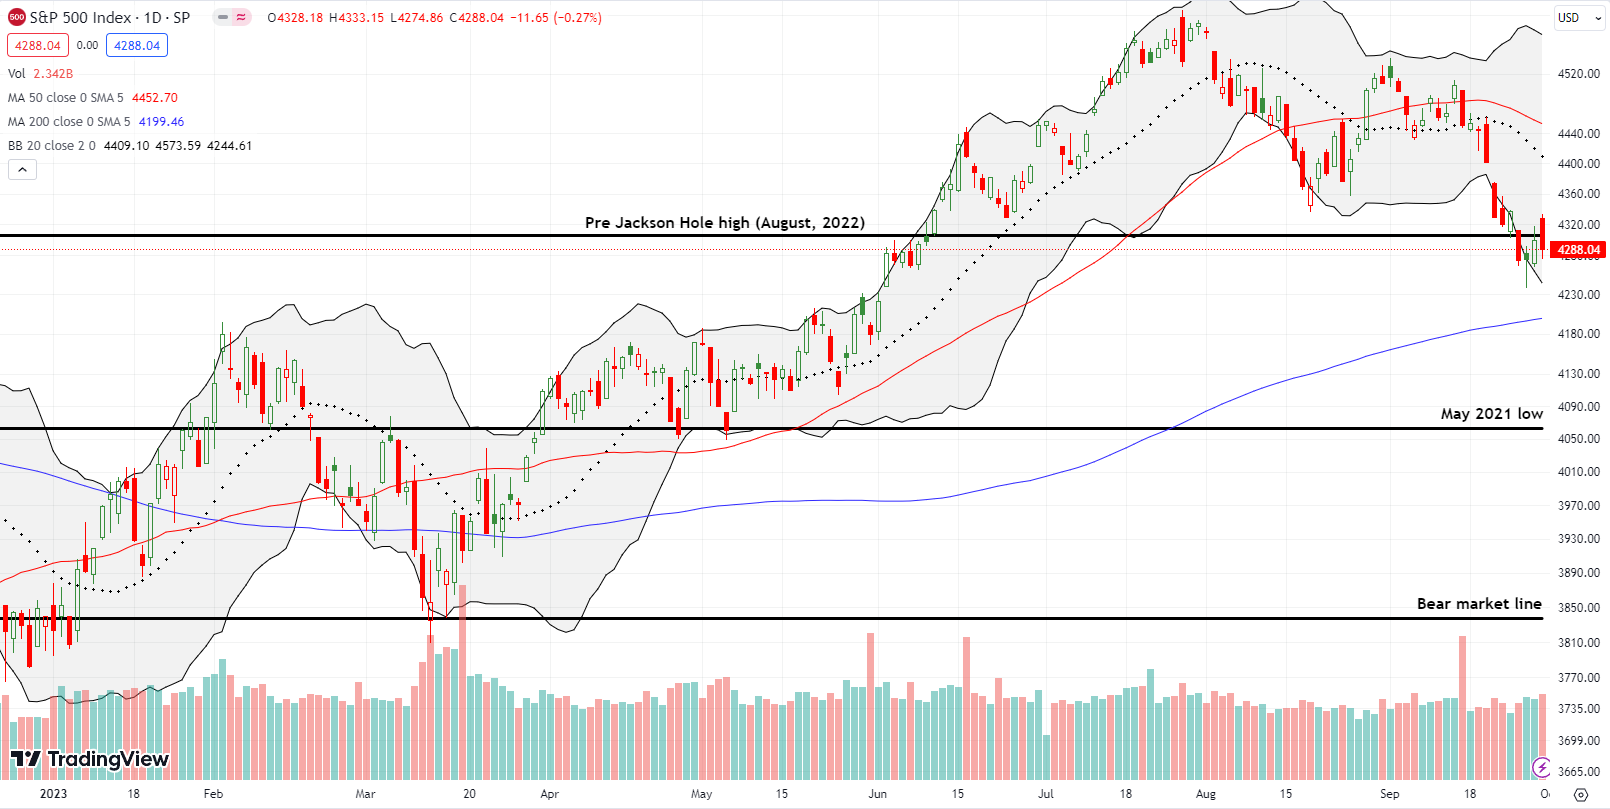
The S&P 500 (SPY) confirmed its hammer bottom but ended the week, the month, the quarter on a weak note. Thursday’s 0.6% gain confirmed the previous day’s hammer bottoming pattern. Friday’s gap open higher gave the impression of convincing follow-through. However, sellers took over from there and faded the S&P 500 into a 0.3% loss. For the week, the index pivoted around its pre Jackson Hole high from August, 2022. I sold an SPY call at Friday’s gap open and held my remaining options. The short side of a calendar call spread expired harmless.
I am surprised the Jackson Hole technical level proved so important. This stalling is important as it delays the time until what looks like a near inevitable test of support at the 200-day moving average (DMA) (the bluish line in the chart below). The S&P 500 only needs to lose about 1.8% from current levels to trigger the test. Such a drawdown and October swoon is well within historical norms for the stock market’s third of three most dangerous months of the year.
The S&P 500’s maximum drawdown for September was 5.2%, well beyond the 2.8% historical average. Hopefully a lot of the motivated sellers for this season exhausted themselves in August and September.
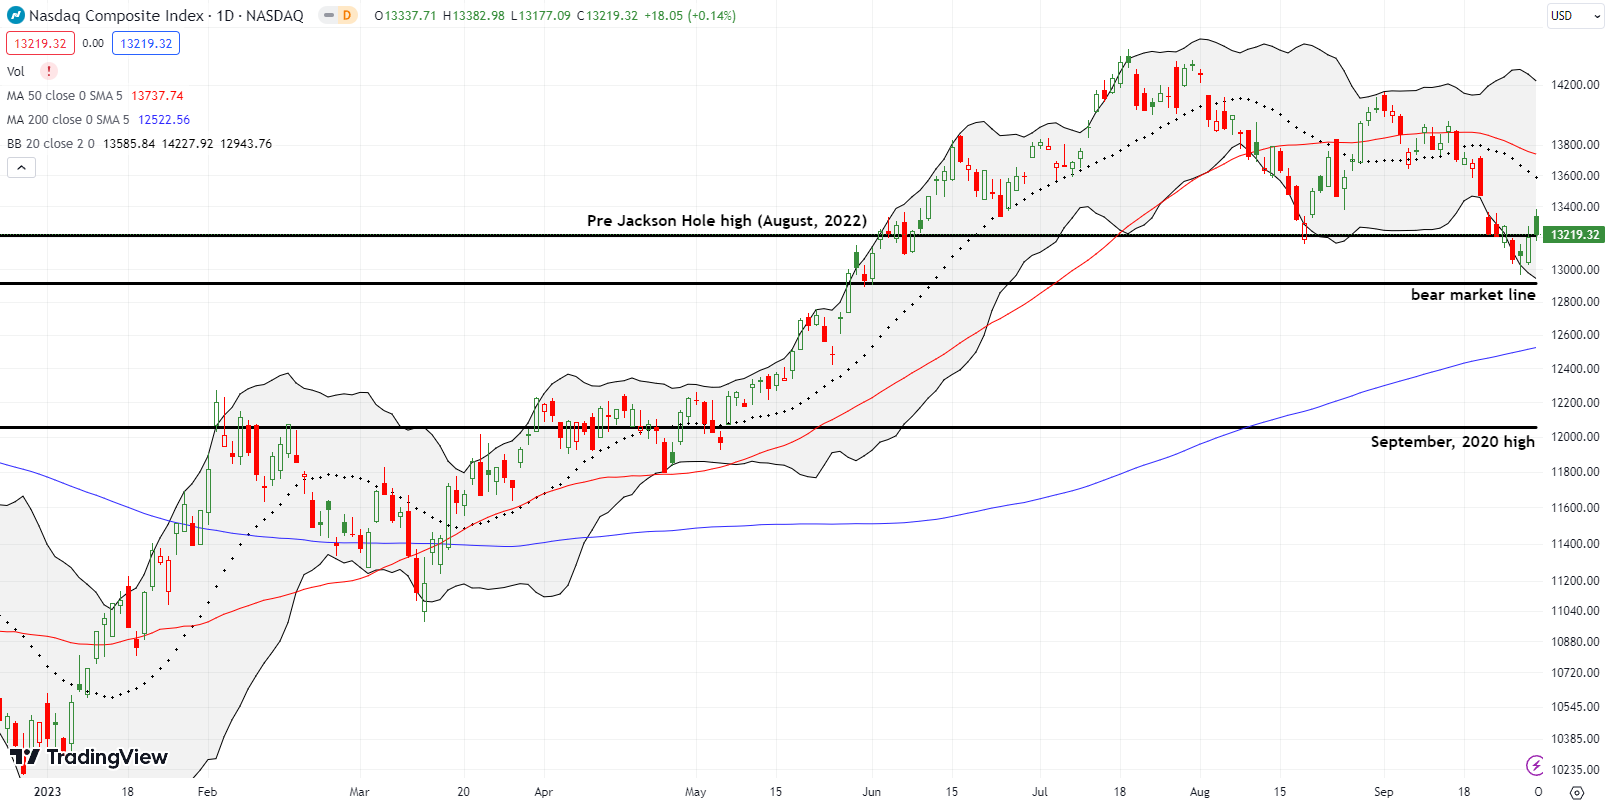
The NASDAQ (COMPQ) is working with a much tighter window than the S&P 500. The tech-laden index’s pivot around the pre Jackson Hole high from last year featured more closes below than above the line. More importantly, this churn is happening just above the NASDAQ’s bear market line. Buyers stepped into the fray just in time to save the NASDAQ from a new bear market. However, unlike the S&P 500, the NASDAQ recovered support from the August lows.
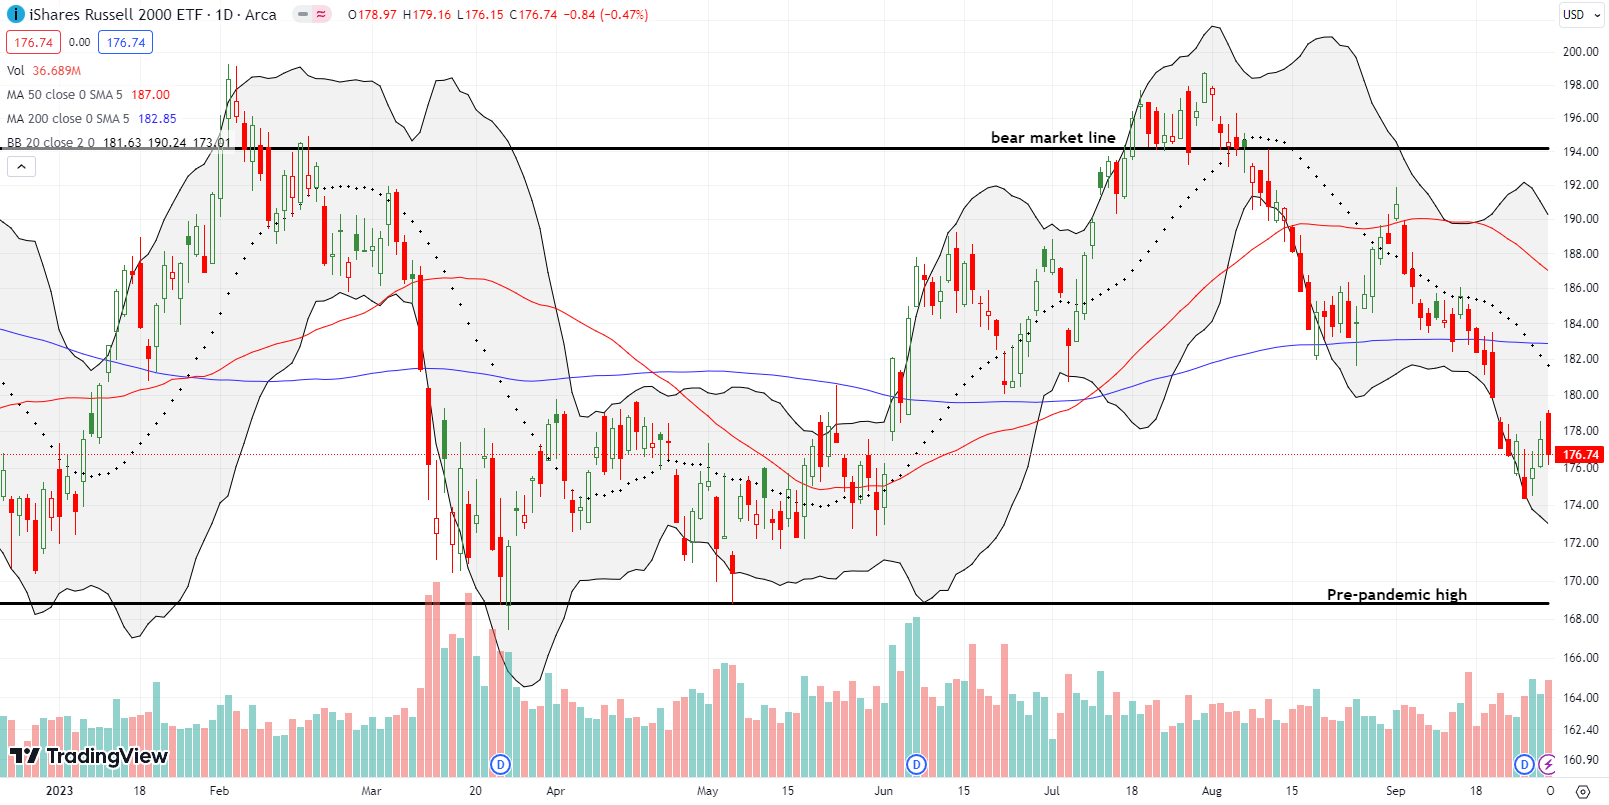
The iShares Russell 2000 ETF (IWM) delivered a sharp rebound from oversold conditions. However, the ETF of small caps paid a heavy price in Friday’s fade. The open marginally gapped over Thursday’s intraday high, and sellers proceeded to fade the IWM into a 0.5% loss. At one point, IWM almost reversed all its gains from Thursday. I took profits on my IWM call options on Thursday, and I did not refresh on Friday. I am content to let some more dust settle as I keep an eye out for the start of an October swoon back into oversold conditions.
The Short-Term Trading Call Ahead of A Potential October Swoon
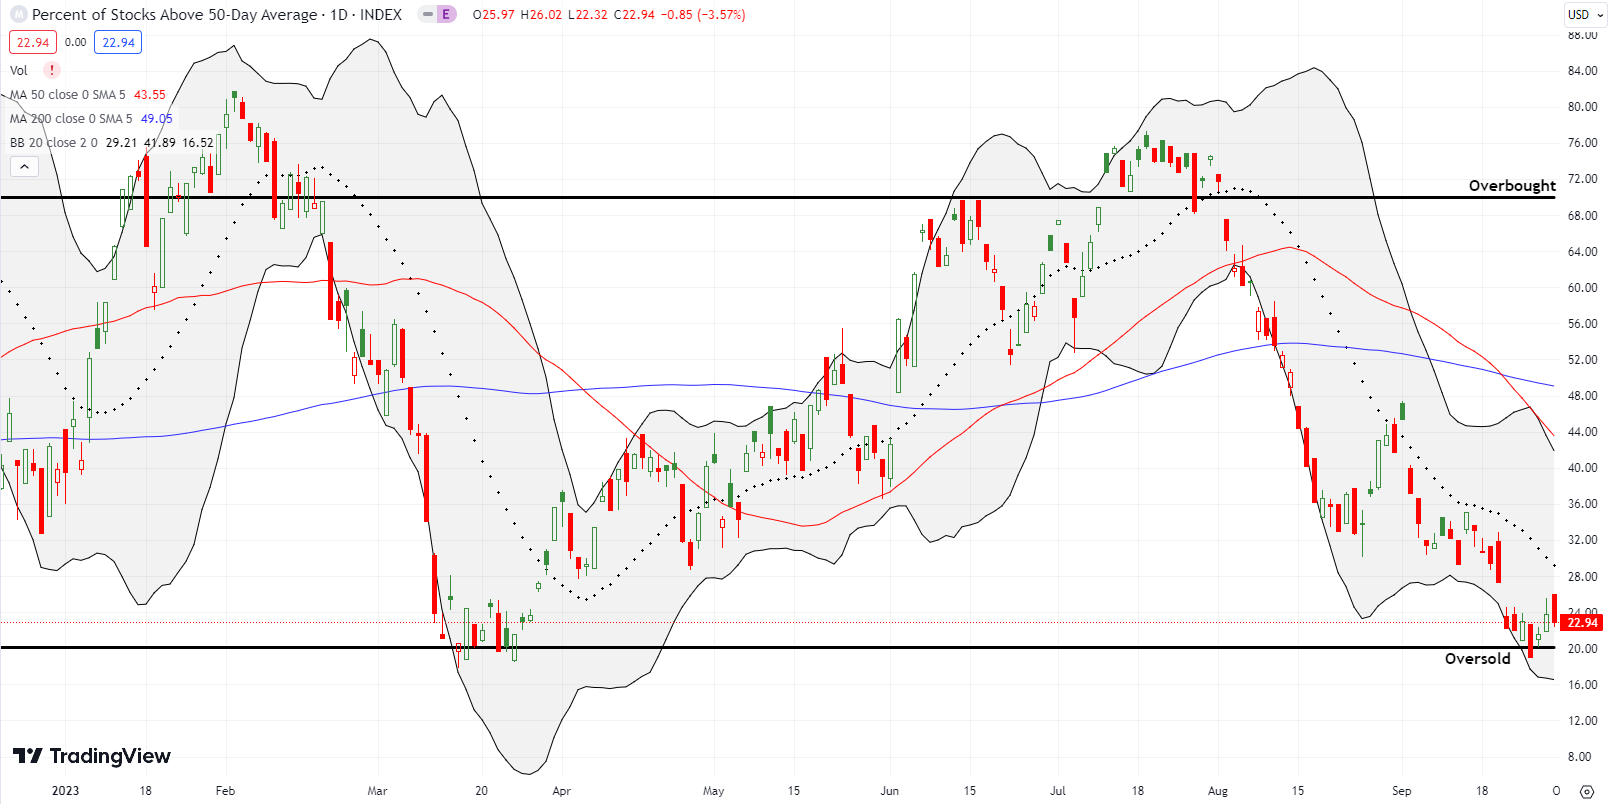
- AT50 (MMFI) = 22.9% of stocks are trading above their respective 50-day moving averages
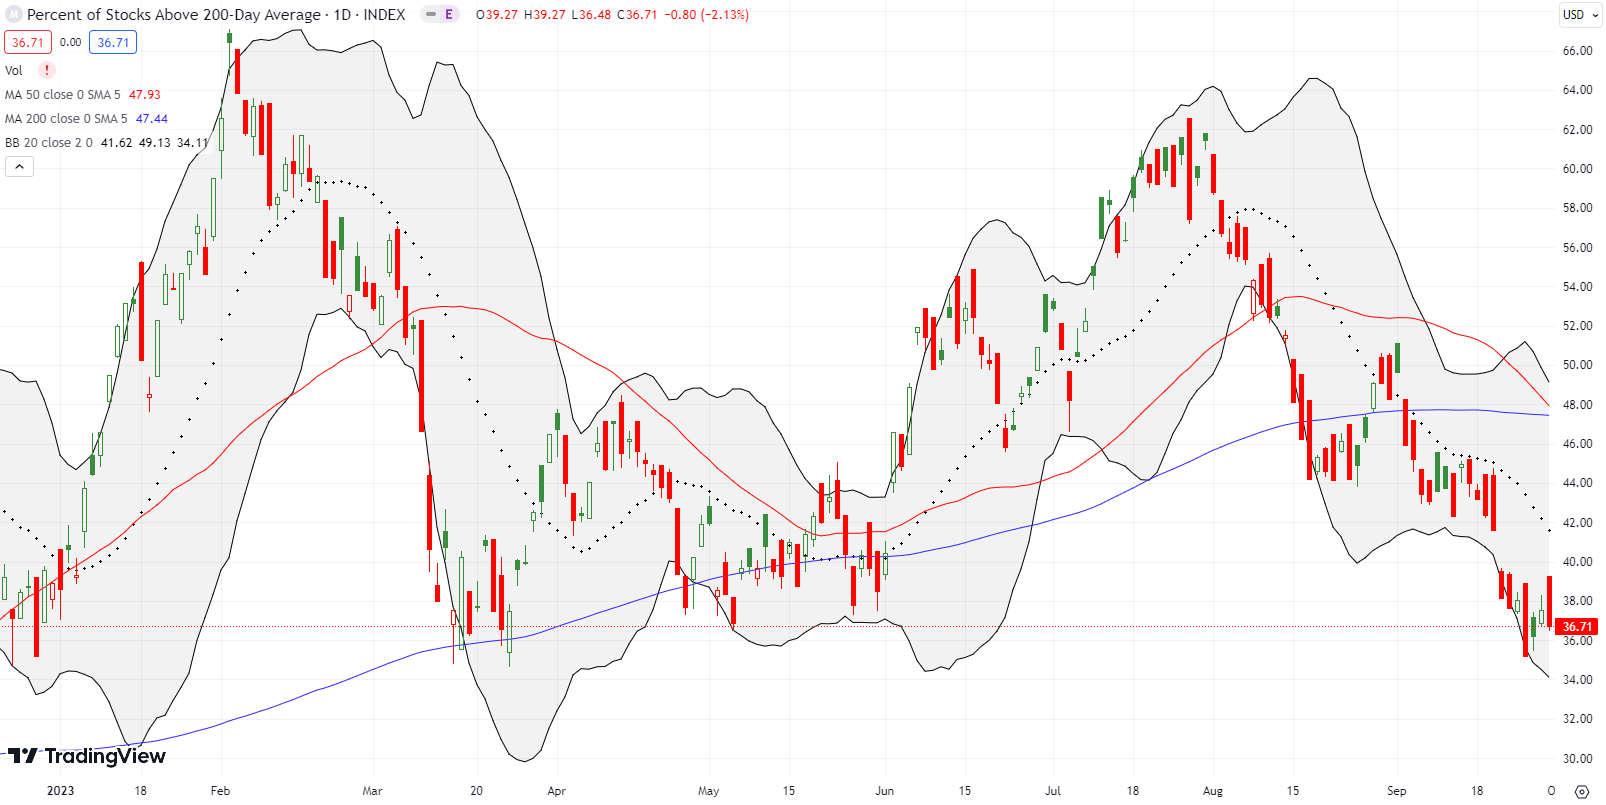
- AT200 (MMTH) = 36.7% of stocks are trading above their respective 200-day moving averages
- Short-term Trading Call: cautiously bullish
AT50 (MMFI), the percentage of stocks trading above their respective 50DMAs, closed at 22.9%. While the last oversold period lasted the typical 1 or 2 days, the bounce out of oversold conditions was not convincing. After an obligatory start of the month, start of the quarter rally on the first trading day of October, I will be on the lookout for the start of an October swoon back into oversold conditions. As a result, I downgraded the short-term trading call from bullish to cautiously bullish. I am not neutral or bearish because I am primed to buy dips. October swoons are typically fantastic buying opportunities ahead of the start of the stock market’s seasonally strong period from October/November to April. Note well that I took profits on most of my trades on oversold conditions.
If it is not clear yet, here is the direct answer to the question in this post’s title: I do not expect this oversold bounce to prevent an October swoon. AT200 (MMTH), the percentage of stocks trading above their respective 200DMAs, continues to worry me with bearish behavior. The oversold bounce barely picked AT200 off its low for the year. Moreover, I am just noticing (thanks to my son!) that AT200 this year has flashed longer candles on down days than on up days. I am worried this behavior exposes a downward bias over the longer haul.
My confidence in buying the dip is also tempered by the on-going troubles in the bond market. Soaring inflation finally forced central banks to stop loading up on government bonds. The missing demand and resulting lower liquidity is giving interest rates their own upward momentum. If the Congressional Budget Office’s 10-year projections for deficits and accumulated debts are accurate for the U.S., then bond markets will continue to demand higher rates for some time to come. The artificial prop from central banks has changed market dynamics, so what worked over the past 10+ years of “free” money may not work so well in the next 10+ years of expensive money. A key set of quotes from the CBO’s report (emphasis mine):
“The deficit amounts to 5.3 percent of gross domestic product (GDP) in 2023, swells to 6.1 percent of GDP in 2024 and 2025, and then declines in the two years that follow. After 2027, deficits increase again, reaching 6.9 percent of GDP in 2033—a level exceeded only five times since 1946…
In CBO’s projections, outlays and revenues measured as a percentage of GDP equal or exceed their 50-year averages through 2033…
Debt held by the public is projected to rise in relation to the size of the economy each year, reaching 118 percent of GDP by 2033—which would be the highest level ever recorded. Debt would continue to grow beyond 2033 if current laws generally remained unchanged.”
Having said that, I am impressed the stock market is not a LOT lower with the 10-year U.S. treasury bond yield sitting at a 16-year high and trending higher!
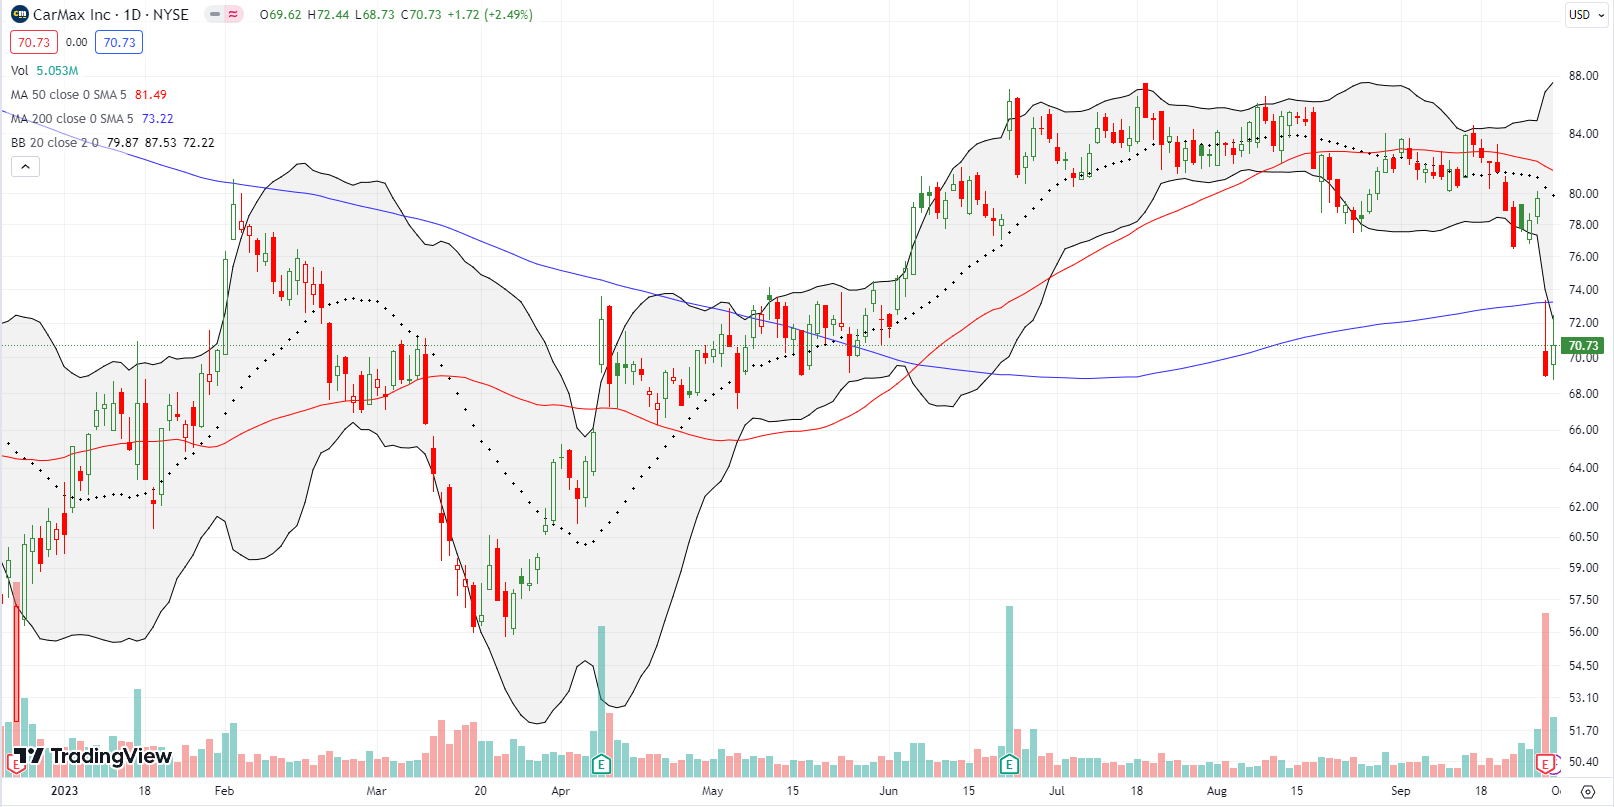
CarMax Inc (KMX) received a 1-day boost of 4.1% just ahead of the start of a strike by the United Auto Workers (UAW). Presumably, trigger-happy traders assumed that a slowdown in the production of new cars would send buyers to used car lots. Selling traders took over from there until the stock market’s oversold bounce helped stop the slide in KMX. The slide resumed with a 13.4% post-earnings loss last week. The resulting 200DMA breakdown is bearish and left KMX very vulnerable to bearish forces ahead of an October swoon.
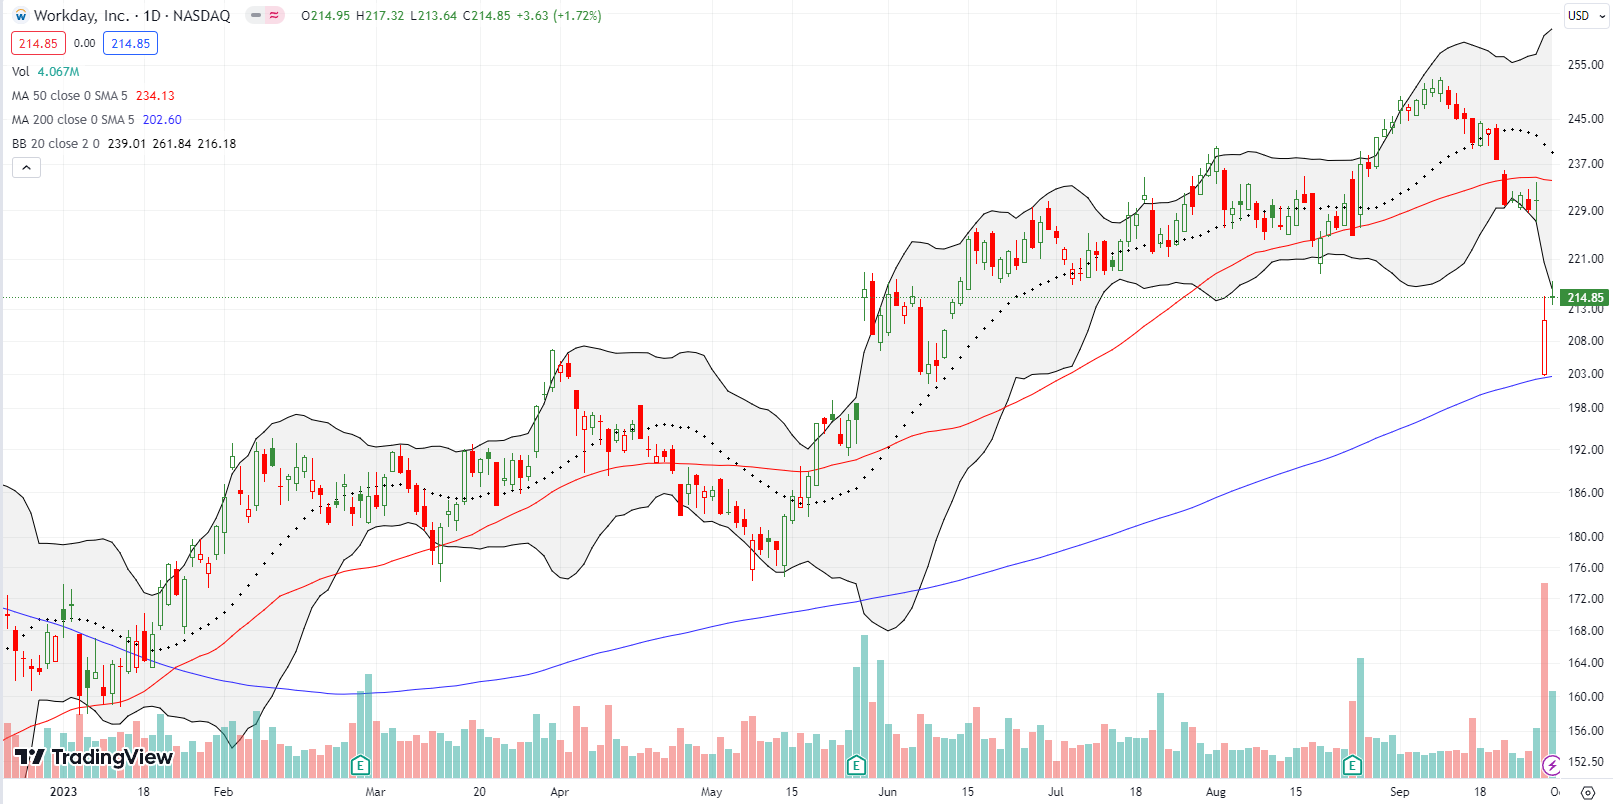
Sometimes there is beauty in drawdowns. Workday Inc (WDAY) cratered 8.5% after an earnings warning. Buyers prevented an even worse showing by stepping in right at 200DMA support. Like a rubber band snapping back, the overstretched WDAY worked its way back to the lower Bollinger Band (BB). I have WDAY on the radar as a test of buyer determination to buy dips.
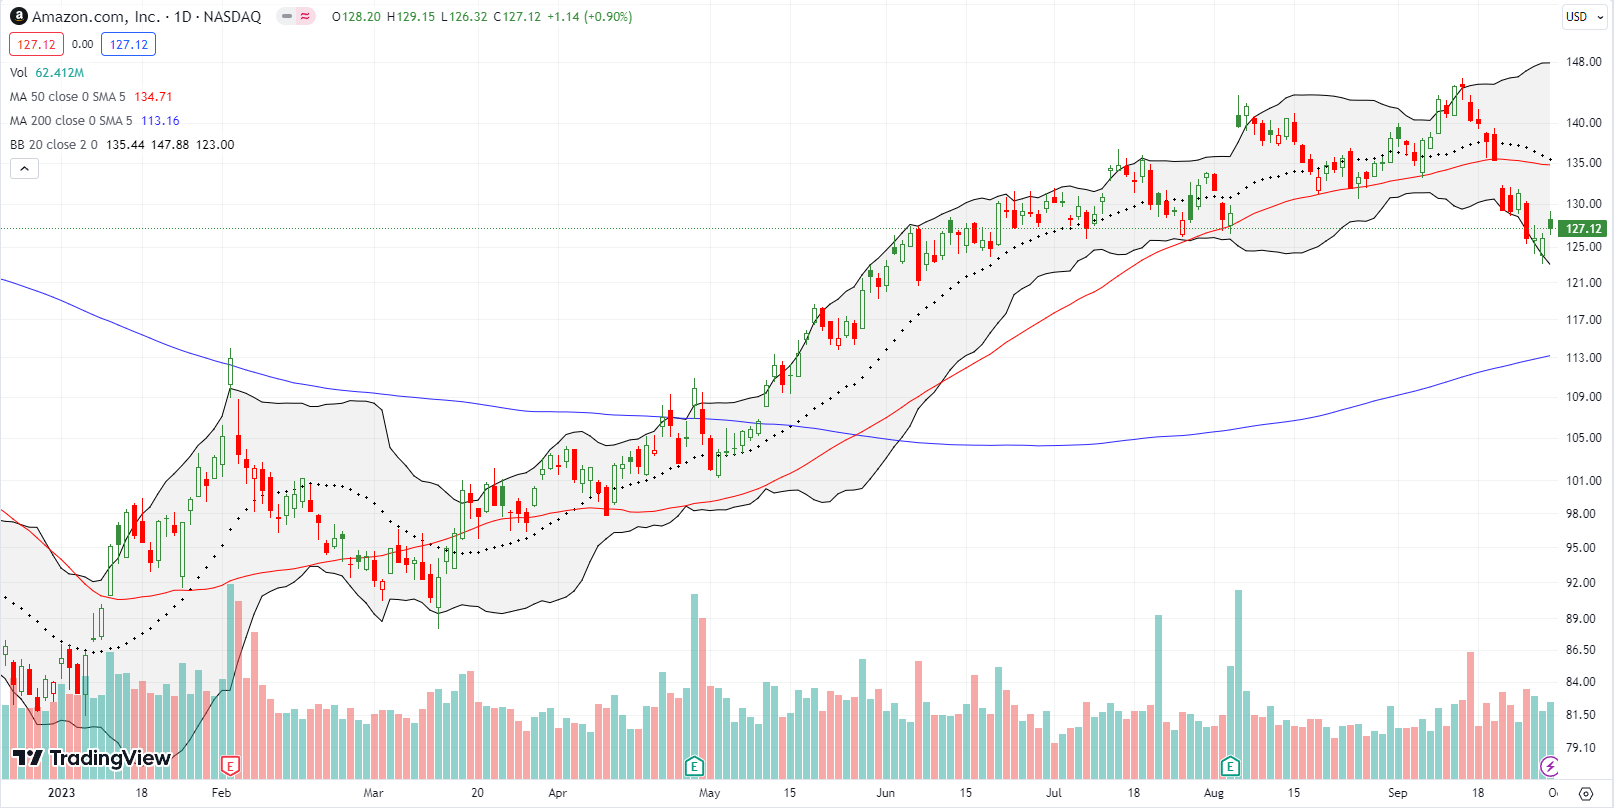
Amazon.com (AMZN) looks like it confirmed a double top from the highs of August and September. A 50DMA breakdown ruined a bet I made on 50DMA support holding (see the red line below). The continued selling from the breakdown challenged the July low. AMZN looks bearish enough to make it a target for a fade on a rally back to 50DMA resistance.
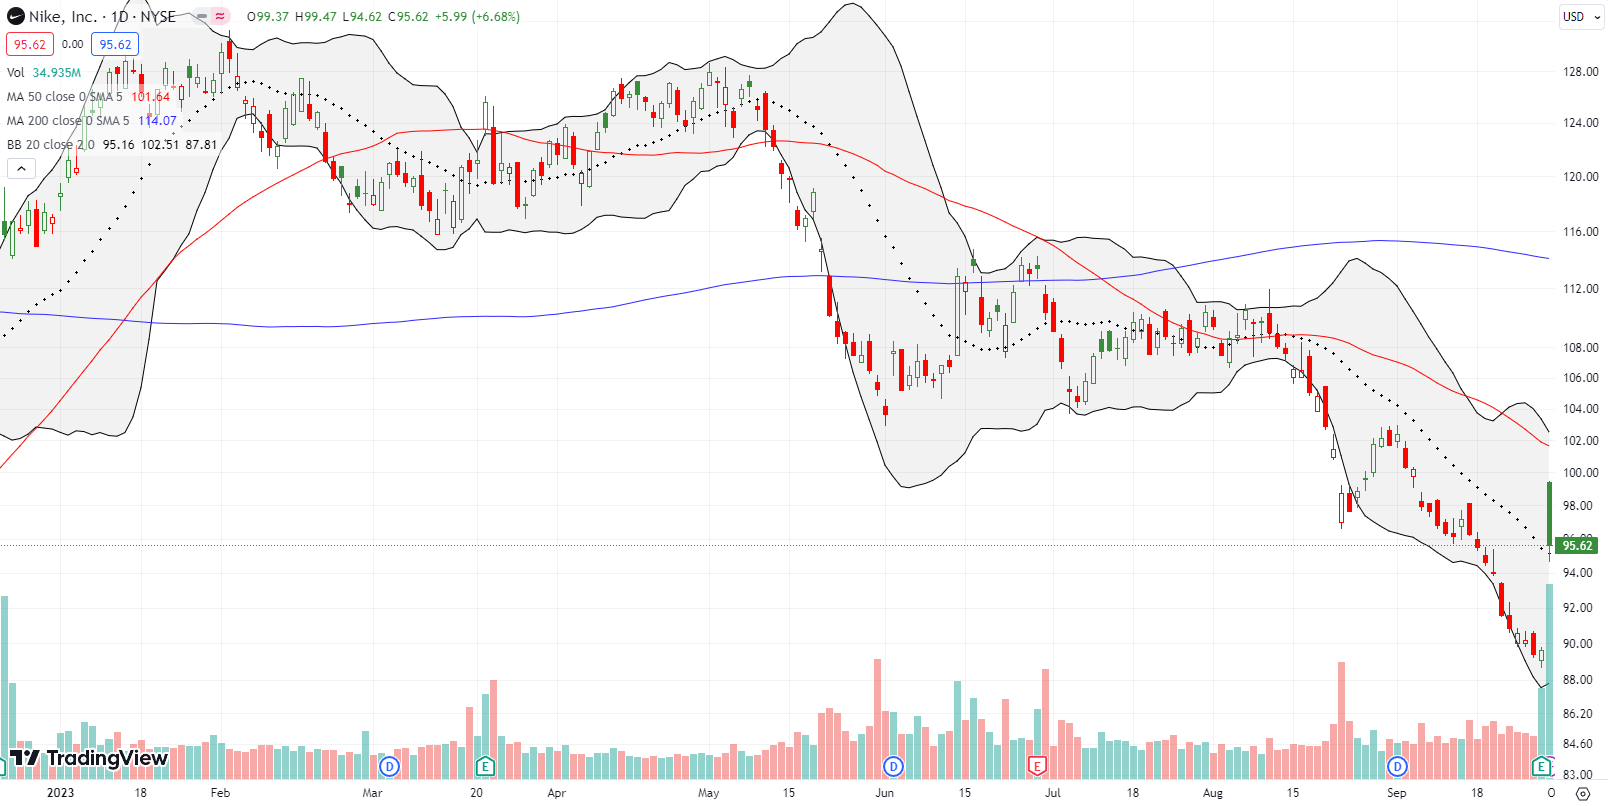
Nike Inc (NKE) went into last week’s earnings at an 11-month high. Its weakness has been symbolic of the precarious condition of consumer discretionary plays. NKE soared post-earnings in a counter-negativity move. However, the gap up was hit immediately by the day’s sellers and faders, leaving NKE with a 6% post-earnings gain. With technical precision, NKE closed right on top of its 20DMA (the dashed line) and thus clings to hope for a bounce in a move know as the “calm after the storm.” Still, the 50DMA downtrend looms large over NKE.
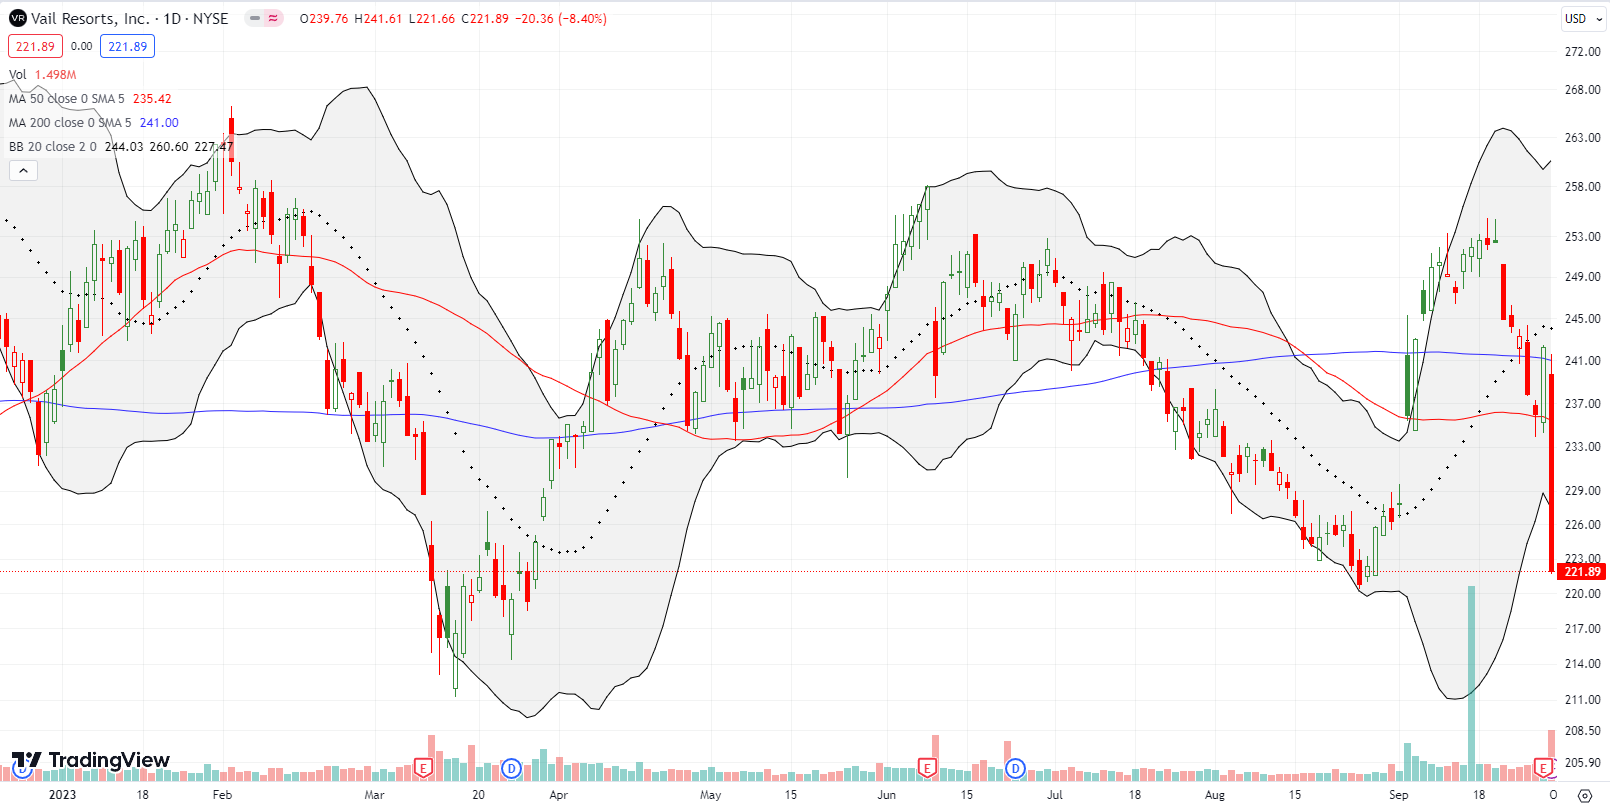
Vail Resorts Inc (MTN) was a stock I pointed out in my review of stocks holding 50DMA support. I failed to point out upcoming earnings. MTN’s 8.4% post-earnings plunge on Friday was a stark reminder of the dangers of trading precarious technical patterns ahead of earnings without considering the overall technical context. The selling going into earnings was the more important signal, and the traders who took MTN up 2.7% off 50DMA support got sorely disappointed the next day. MTN is now testing important support at the August lows.
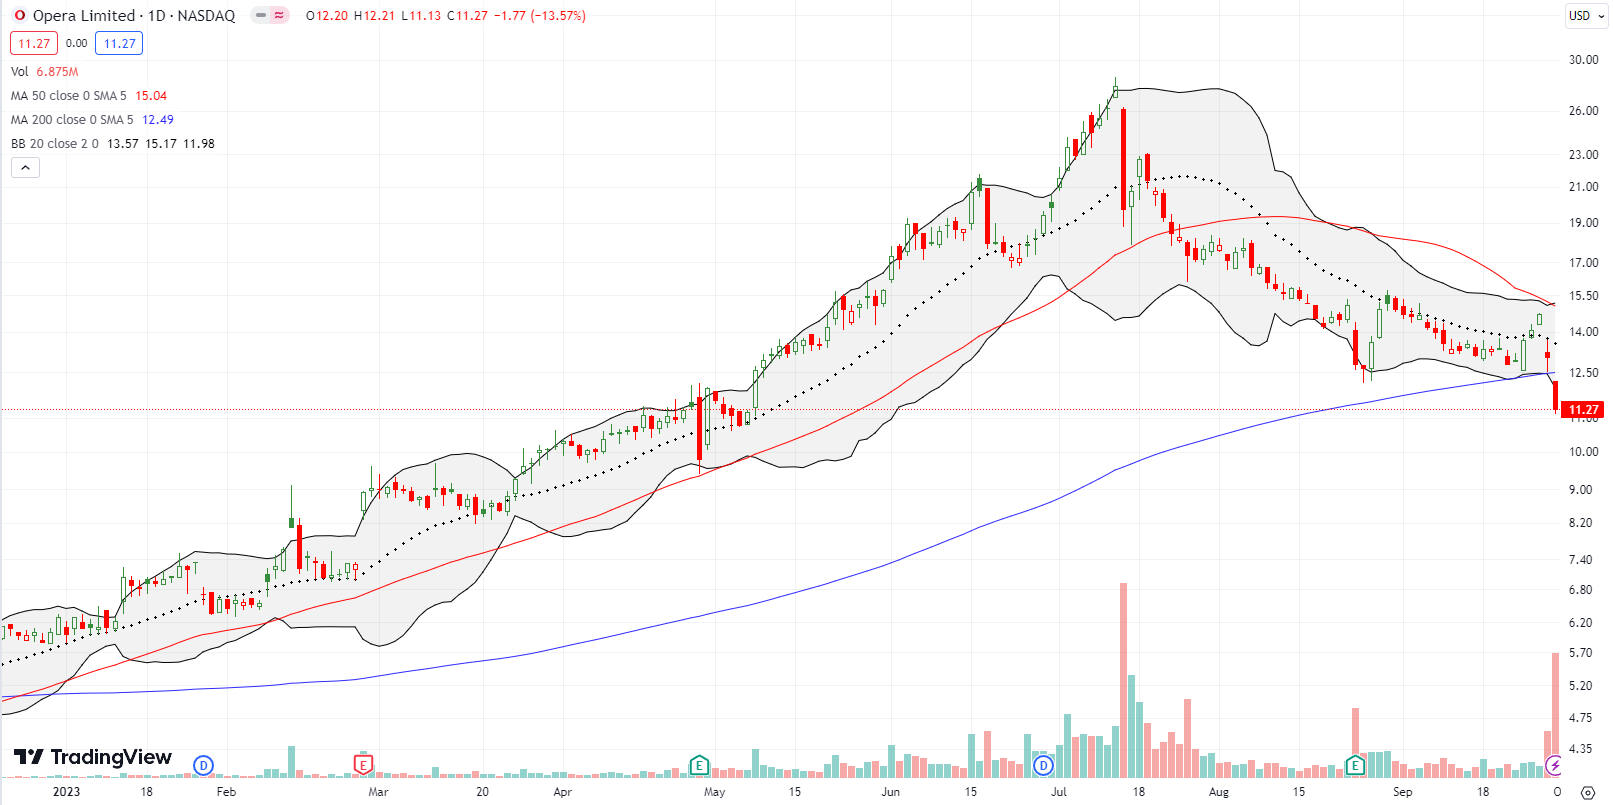
The drama in Opera Limited (OPRA) continues. Three months since a major investor tried to reassure investors (in vain) about a renewed authorization to sell shares, a “pre-IPO” shareholder decided to bail on a whopping 6,876,506 shares. The news sent the stock reeling by 11.3% the next day. The news of a $12.25 pricing for the secondary shares failed to build a floor for the stock. Sellers plunged the stock into a 200DMA breakdown and a near 5-month low. Per my rules on trading secondaries, OPRA is officially a broken stock until it manages to close above $12.25. Shareholders are clearly building momentum to take profits and other investors have taken the signals to heart; they are front-running all the other major sellers to come.
I got caught trying another trade on OPRA that went from perfect to bust. I bought OPRA after the picture-perfect bounce from 200DMA support. At 50DMA resistance, I failed to take quick profits as I kept my eyes on the bullish tailwinds from the oversold period. I will take my lumps and the loss on the next lower close.
Be careful out there!
Footnotes
Subscribe for free to get email notifications of future posts!
“Above the 50” (AT50) uses the percentage of stocks trading above their respective 50-day moving averages (DMAs) to measure breadth in the stock market. Breadth defines the distribution of participation in a rally or sell-off. As a result, AT50 identifies extremes in market sentiment that are likely to reverse. Above the 50 is my alternative name for “MMFI” which is a symbol TradingView.com and other chart vendors use for this breadth indicator. Learn more about AT50 on my Market Breadth Resource Page. AT200, or MMTH, measures the percentage of stocks trading above their respective 200DMAs.
Active AT50 (MMFI) periods: Day #3 over 20%, Day #9 under 30%, Day #19 under 40%, Day #33 under 50%, Day #38 under 60%, Day #41 under 70%
Source for charts unless otherwise noted: TradingView.com
Full disclosure: long S&P 500 call spread and call, long OPRA
FOLLOW Dr. Duru’s commentary on financial markets via StockTwits, Twitter, and even Instagram!
*Charting notes: Stock prices are not adjusted for dividends. Candlestick charts use hollow bodies: open candles indicate a close higher than the open, filled candles indicate an open higher than the close.


Well, we got a 45-day reprieve from one source of instability, the House of Representatives.
There is your dip….whats the buying level?
45 days is hardly enough sadly.
Well, we are back to oversold conditions, but I hardly think this is the end of the October swoon for the S&P 500 or IWM. The NASDAQ diverged with a decent gain.
Things get interesting after the S&P 500 falls about 3% for the month. That’s 4159 but that would also be a pretty deep visit into oversold territory. So let’s see how things look once the index finishes reversing its gains from the summer.