Stock Market Commentary
The economist “consensus” expectations for September job growth missed the mark by a mile, 336,000 actual versus 170,000 projected. These big misses represent the on-going struggles of conventional economics to understand the dynamics of today’s post-pandemic economy. Initially, the good jobs news frightened financial markets which think of good news as bad news for tighter monetary policy. Futures sold off and the S&P 500 gapped down to the lows of the week. However, a funny thing happened along the way to Wall Street’s grousing about the better fortunes for workers. Buyers stepped in and sent the major indices into gains and strong closes on the day. The action was what I will call a “dip and rip”, a whiplash catalyzed in this case by the September jobs report.
I interpret the trading narrative in terms of the dynamics of oversold trading. It takes a lot of motivated selling to push the market into oversold trading conditions. Oversold matters because at the extreme of market breadth, a single catalyst can wash out the remaining (short-term) motivated sellers. Their absence leaves a vacuum that buyers fill. The path of least resistance then points upward. The jobs dip and rip was sharp enough to pull market breadth out of oversold trading conditions for now. There is even a case to be made that the folks who filter jobs reports for bad news gave buyers an excuse to celebrate.
The Stock Market Indices
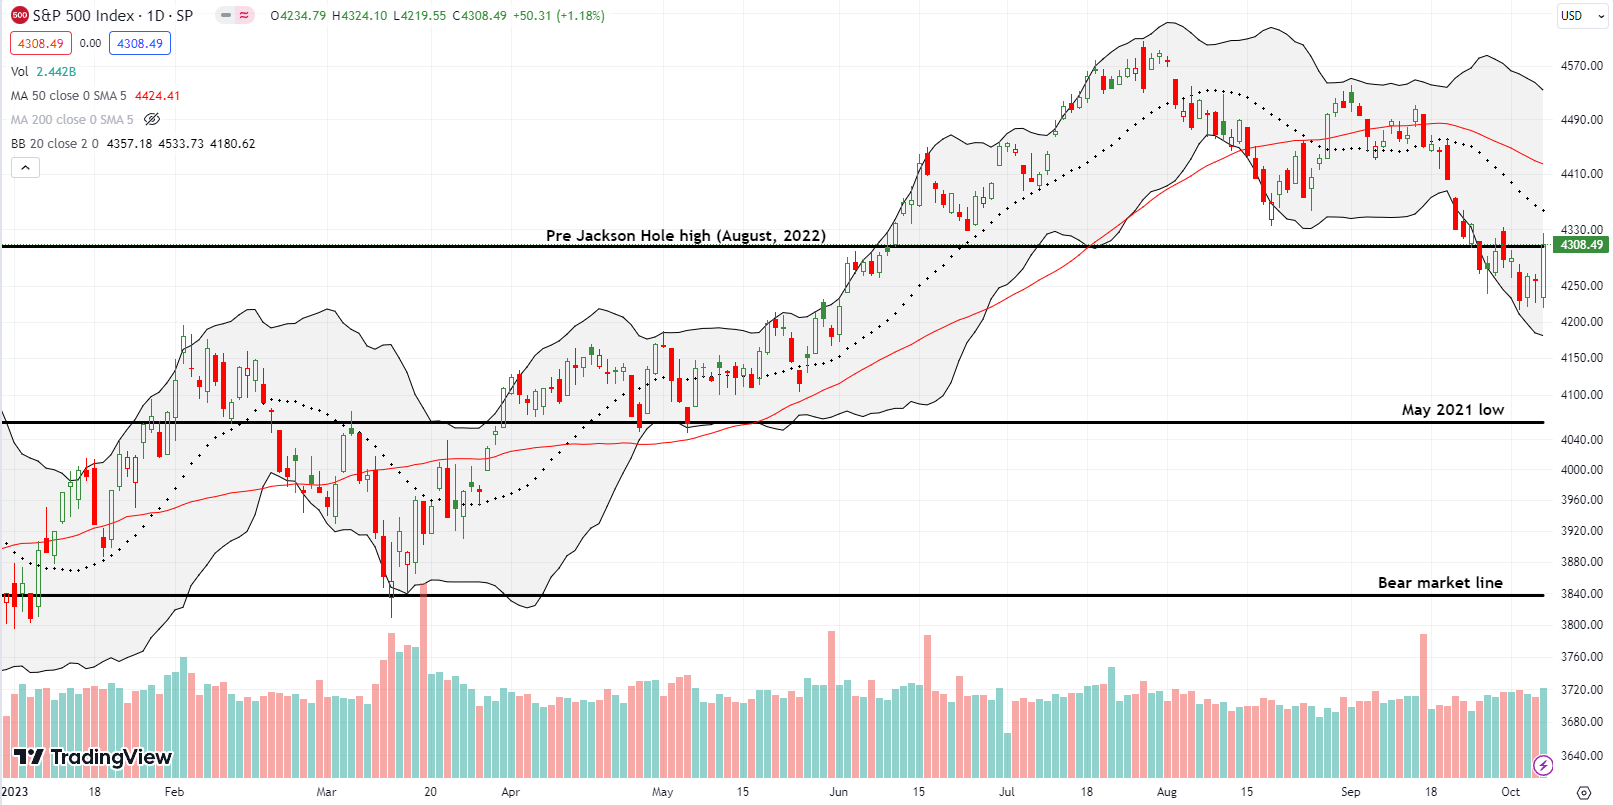
The S&P 500 (SPY) opened with a 0.5% loss. Sellers held court for 45 minutes before giving way to the upward path of least resistance. Buyers dominated the rest of the way until the last 15 minutes of trading. That slight intraday dip took the index back to the increasingly important pivot line at the pre Jackson Hole high from August, 2022. The S&P 500 now has to contend with overhead resistance from a declining 20-day moving average (DMA) (the dotted line below) – which is converging on important resistance from the August lows – and a declining 50DMA (the red line below). I took profits on my SPY calendar call spread and look to continue buying dips going forward.
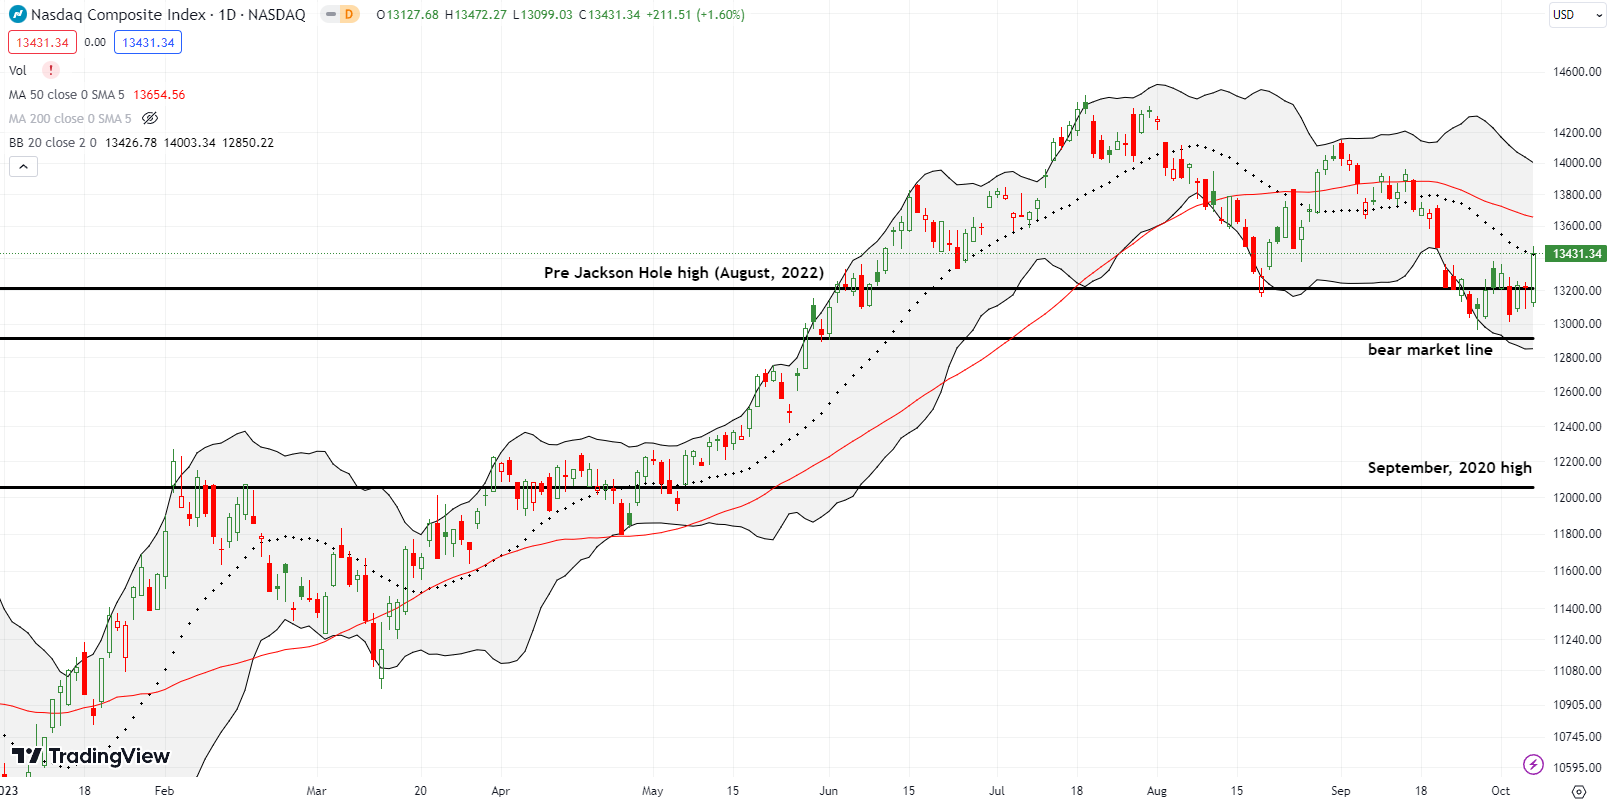
The NASDAQ (COMPQ) opened at a loss but fared a little better than the S&P 500. Its 1.5% gain on the day closed the tech-laden index right at downtrending 20DMA resistance. The move also separated the NASDAQ from its pivot at the pre Jackson Hole high and the August low. Thus, the NASDAQ is set up to make a run at 50DMA resistance. The bear market line looks safe for now.
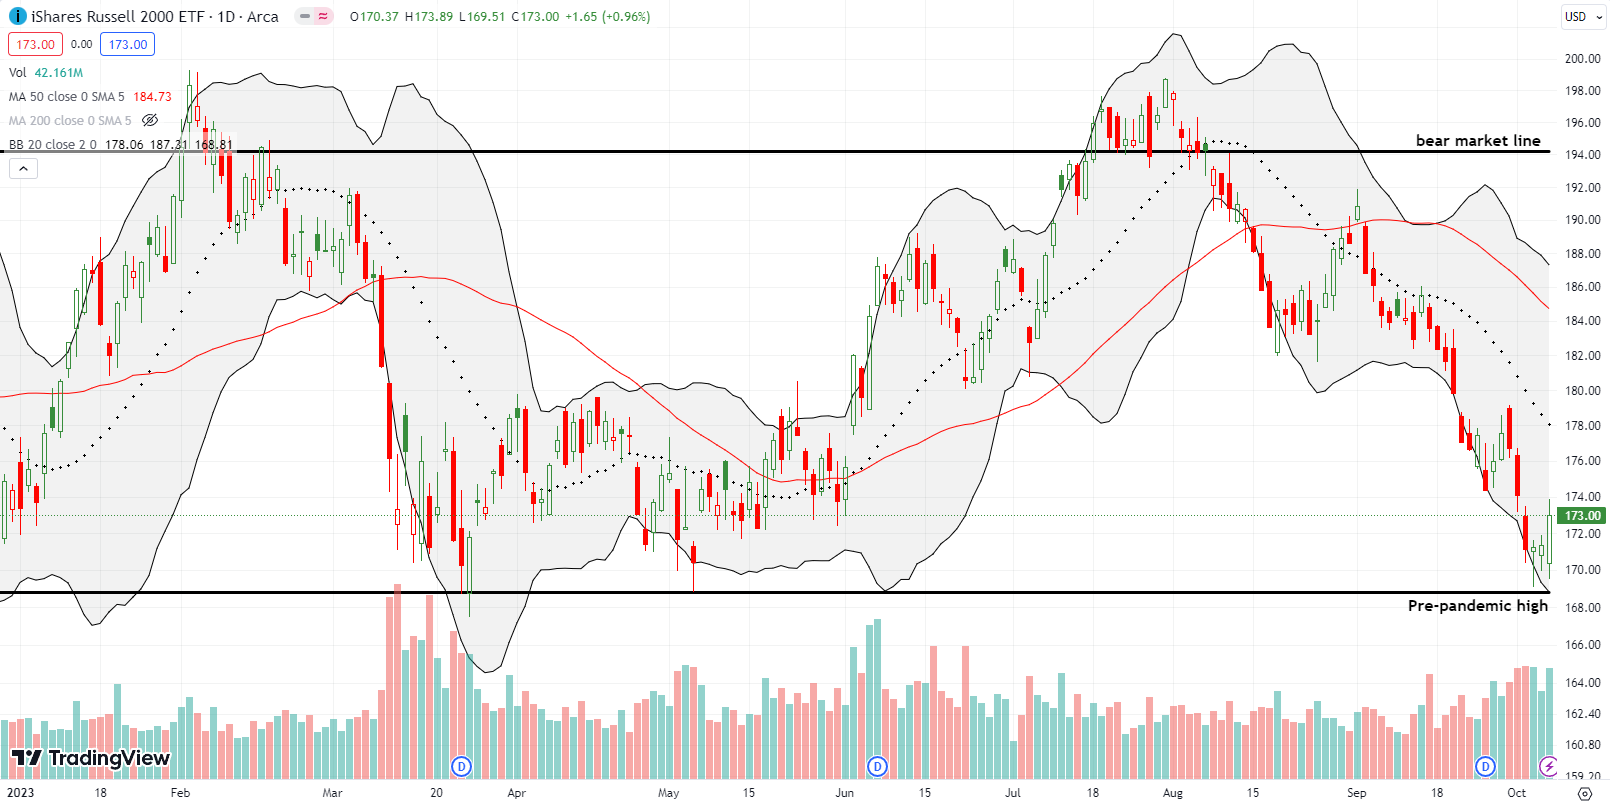
The iShares Russell 2000 ETF (IWM) snapped back with its jobs dip and rip for a 1.0% gain. Buyers over the last three days preserved the pre-pandemic high as support. Given the steepness of IWM’s 2-month decline, there is plenty of potential oversold bounce upside back to resistance. Still, I took profits on an IWM call option near the close.
The Short-Term Trading Call With A Dip and Rip
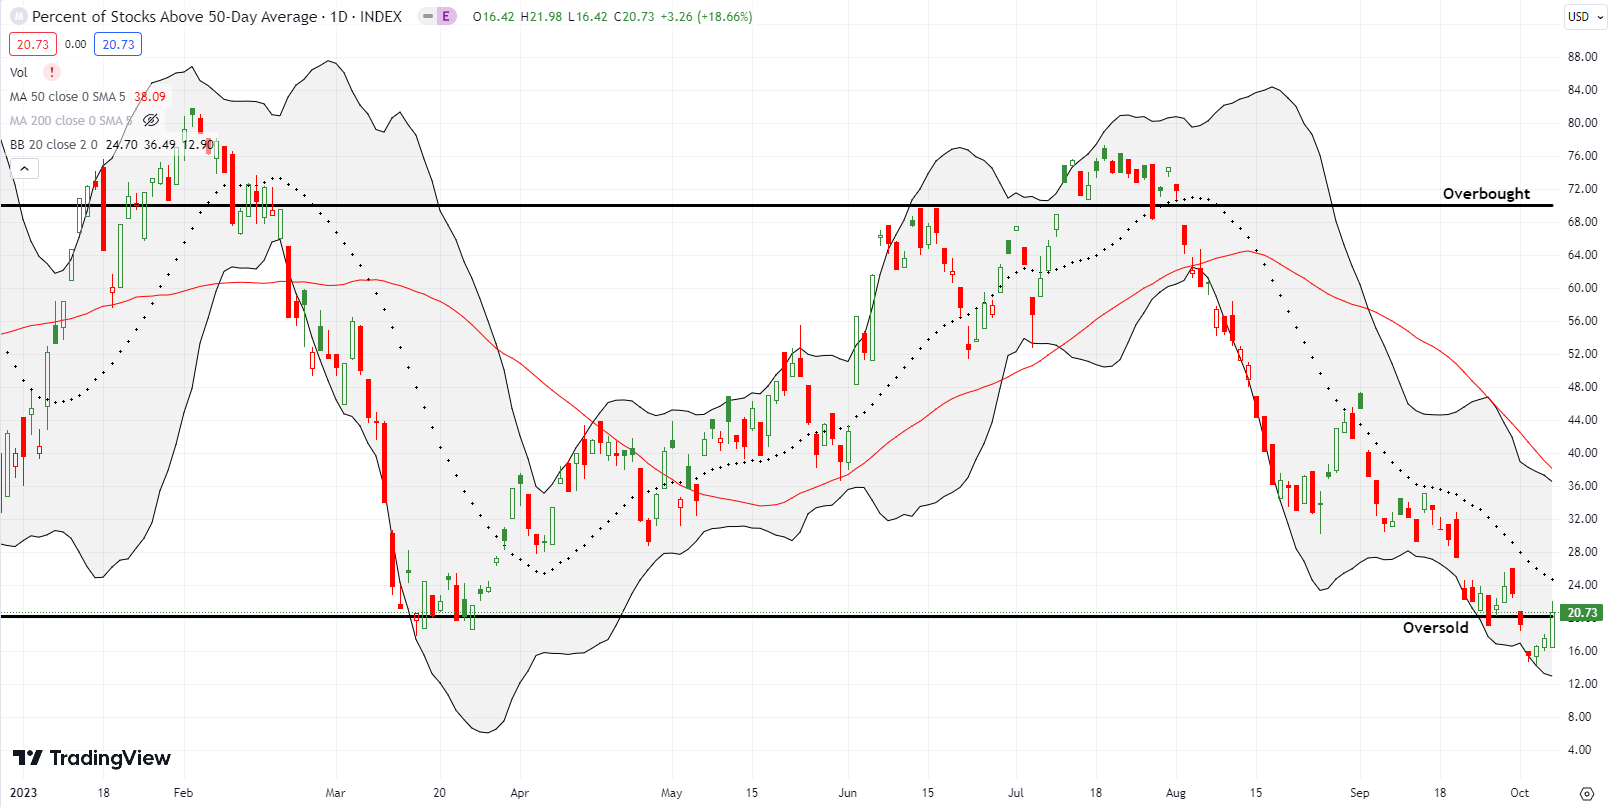
- AT50 (MMFI) = 20.7% of stocks are trading above their respective 50-day moving averages (ending a 4-day oversold period)
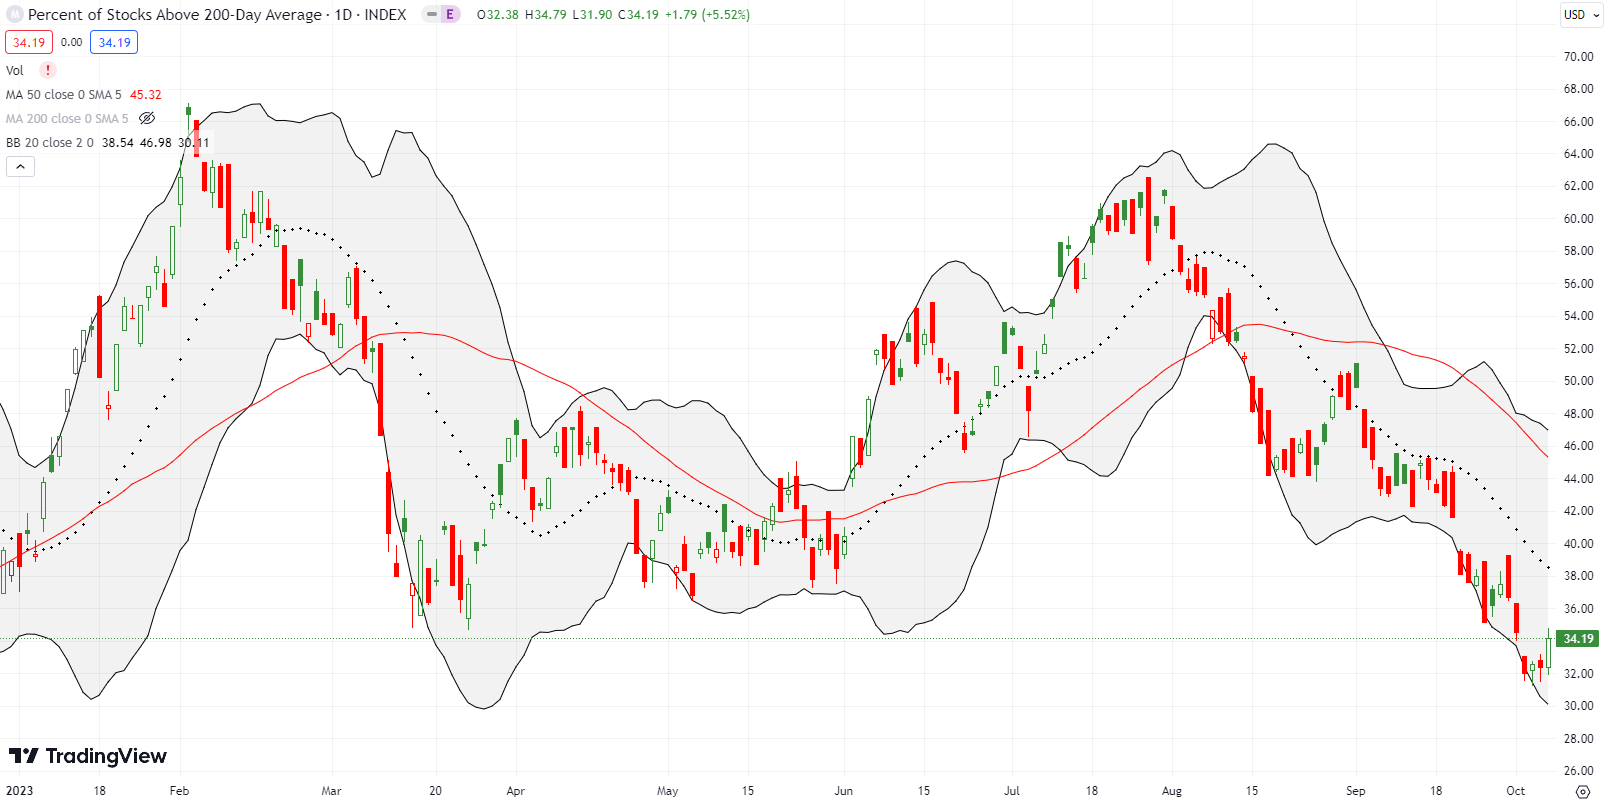
- AT200 (MMTH) = 34.2% of stocks are trading above their respective 200-day moving averages
- Short-term Trading Call: bullish
AT50 (MMFI), the percentage of stocks trading above their respective 50DMAs, bounced out of a 4-day oversold period and closed the week at 20.7%. As I explained on day #1 of the oversold period, the volatility index (VIX) did not spike high enough for me to go aggressively bullish with the oversold trading rules. The VIX obliged the next day with a 12.4% surge to a breakout and 6-month high. That was enough fear to flip my short-term trading call to bullish. I went into action with stock scans to identify the best trading opportunities. Almost all of these worked out very well by the end of the week. I shed most of the call options into Friday’s bounce but kept all my shares.
I left the short-term trading call at bullish, and I am in full buy-the-dip mode for this third of the stock market’s most dangerous months. As I note in my analysis of S&P 500 drawdowns, October is a month for buying dips and thus driving right into the middle of the market’s darkest fears.
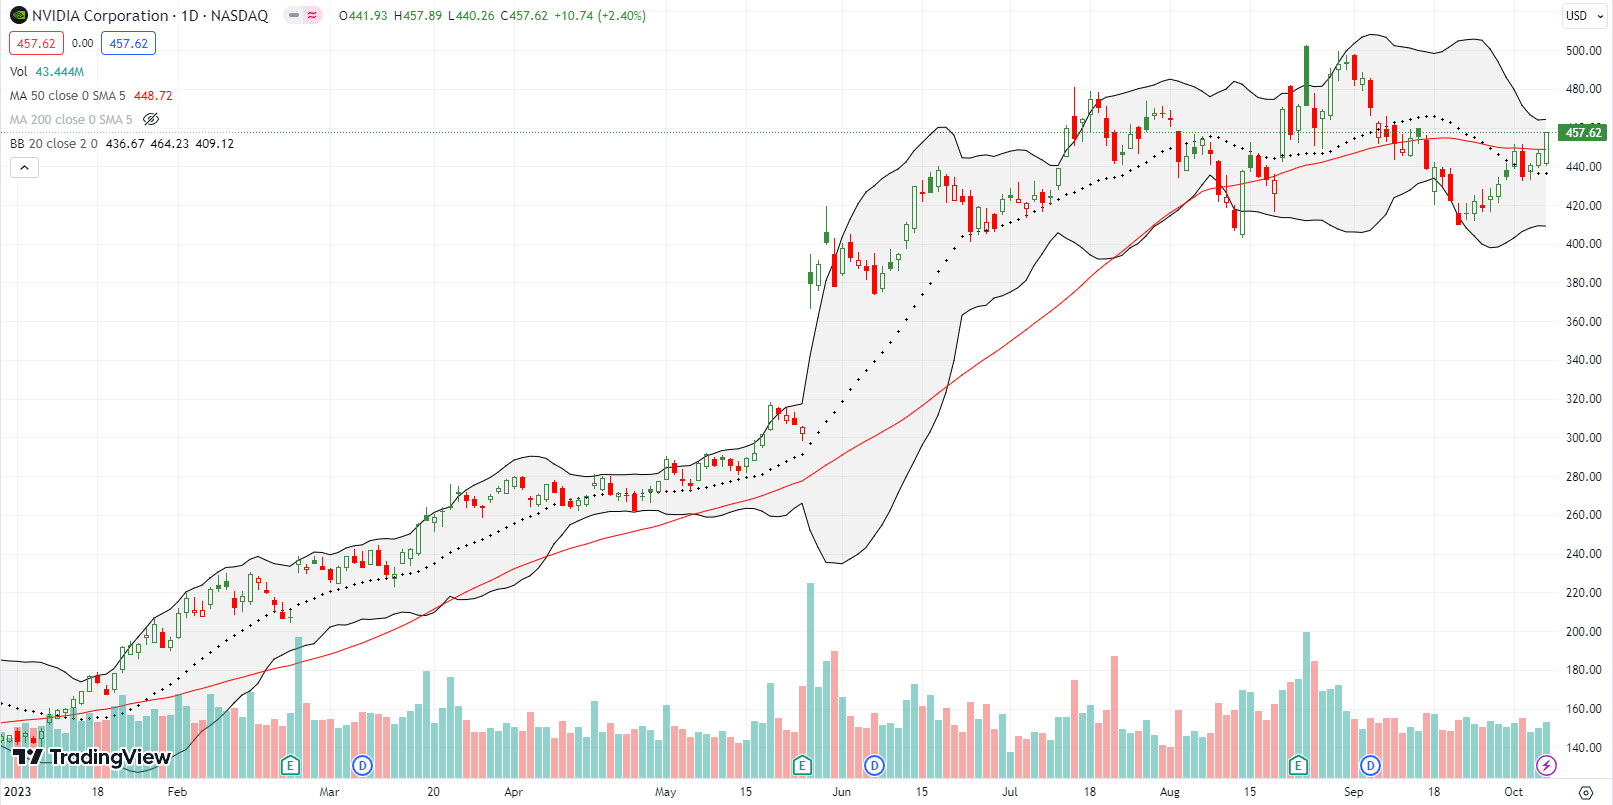
NVIDIA Corporation (NVDA) gave me some pause on my bullishness (I called it the NVDA dilemma). I was wary that Tuesday’s 2.8% loss and rejection from 50DMA resistance could be the beginning of an extended drawdown that would take the market further down as well. Instead, the momentum in place since NVDA successfully tested support at its August low continued. By Friday, NVDA was back into bullish territory with a 50DMA breakout. Per AT50, the stock joined the 20% minority of stocks enjoying this bullish positioning. Next up – worry about a potential head and shoulders top! (The left shoulder is the July churn, the head is the August post-earnings peak, the right shoulder will be….)
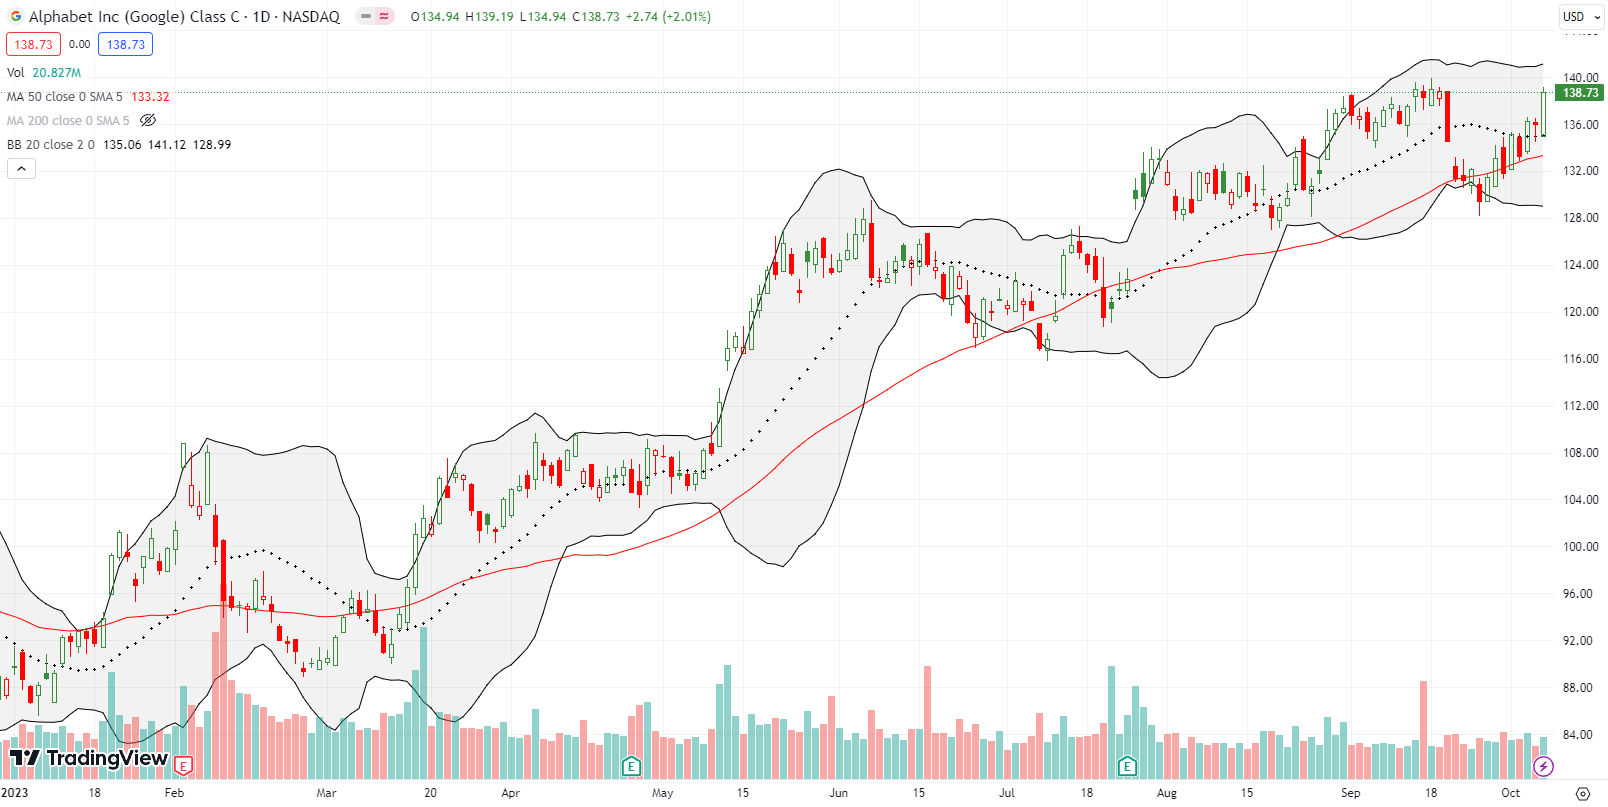
I thought I was aggressive with buying an Alphabet Inc (GOOG) call spread and then holding it on a test of downtrending 20DMA resistance. Turns out that I was not aggressive enough. I took profits the next day after GOOG failed to follow through, but buyers returned in force over the next 2 of 3 trading days. GOOG closed the week right at its high of the year. I am a buyer all over again if GOOG pushes higher on Monday (I will not chase a gap higher).
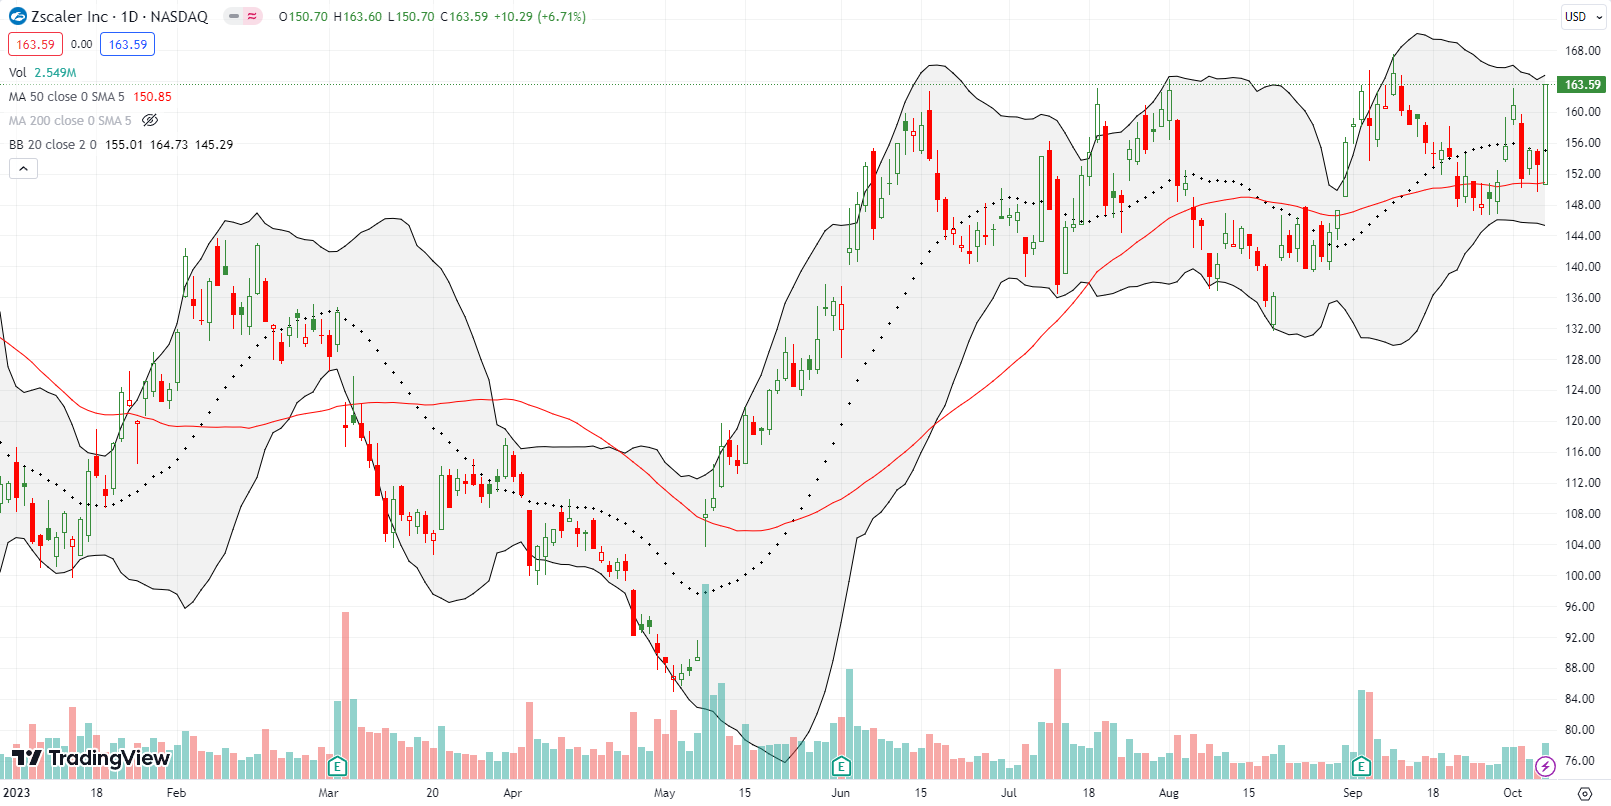
Zscaler Inc (ZS) was one of the cohort of winners from my stock scans for oversold trading opportunities. ZS bounced from 50DMA support in poetic fashion with a 6.7% gain. Since I held a weekly $155/$160 call spread I decided to wait on taking profits. There is a good chance now I can get closer to realizing maximum possible profits from the spread. I will close the position if ZS pulls back to $160. The stock is at critical resistance from the top of a trading range in place since June.
Consumer discretionary food stocks were distinct losers on the week. Investors are developing increasing fears that the success of appetite-suppressing drugs will significantly reduce demand for junk food and alcoholic drinks. These fears are unevenly impacting consumer discretionary with selling cascading outward and casting a wider net over the past two months or so.
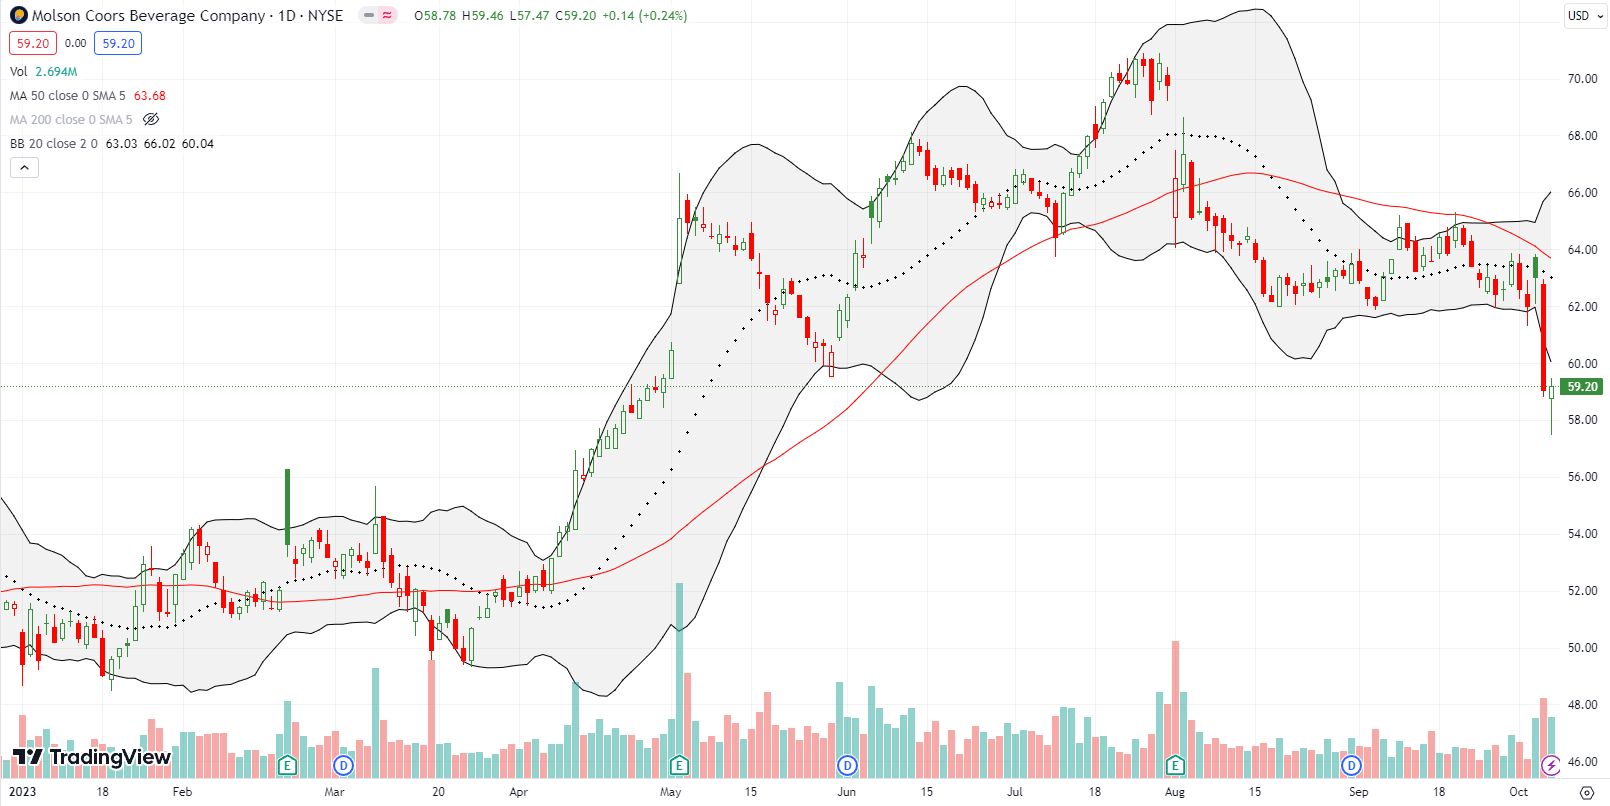
The oversold bounce was barely a help for the likes of Molson Coors Beverage Company (TAP). TAP plunged 6.3% on Thursday and barely recovered on Friday for a flat close. TAP also confirmed 50DMA resistance. (Herb Greenberg had an interesting take on what I am calling the “Ozempic-Wegovy panic”. Like a good contrarian, he is skeptical of the extremes of the growing Ozempic-Wegovy panic. See “The (Exaggerated?) Far-Reaching Effect of Miracle Weight-Loss Drugs“.)
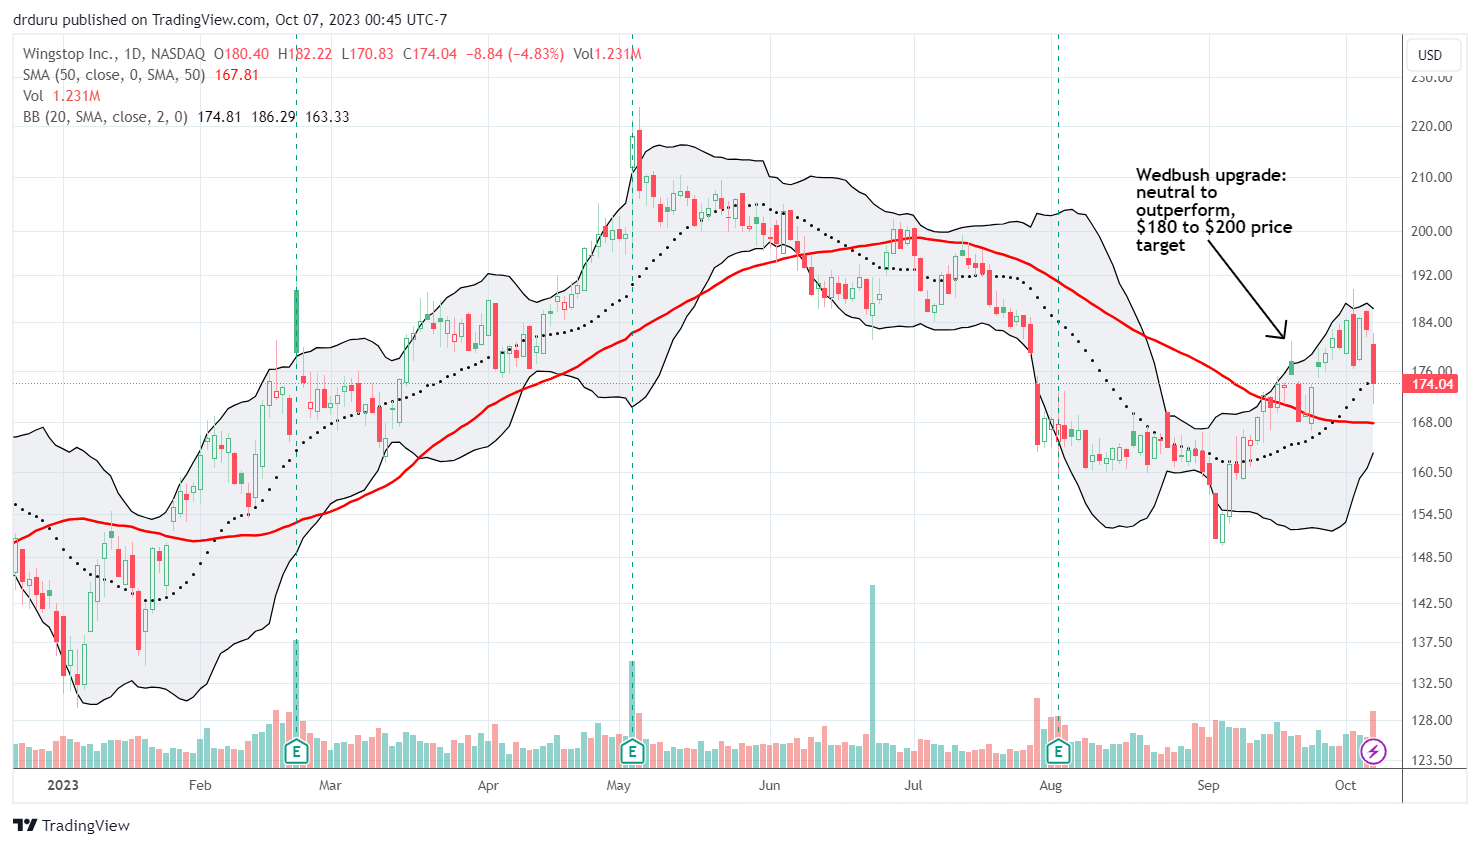
Apparently the miracle weight loss drugs may not significantly suppress appetites for chicken wings? Wingstop Inc (WING) got a boost from an analyst on September 20th. The breakout was faded from intraday highs and back to 50DMA support. However, buyers took over from there. More persistent sellers last week thwarted buyers one more time.
Like many discretionary food plays, WING under-performed the market on Friday. The stock lost 4.8% and closed at uptrending 20DMA support. I featured WING as a bearish play after sellers extended the breakdown in early September. I think the buyers who are playing contrary to the consumer discretionary food trend will exhaust themselves in due time. WING is also expensive at 12x sales and a 68 forward P/E; that valuation is extremely expensive given the potential sentiment headwinds in the sector. I have a fresh October put spread in place.
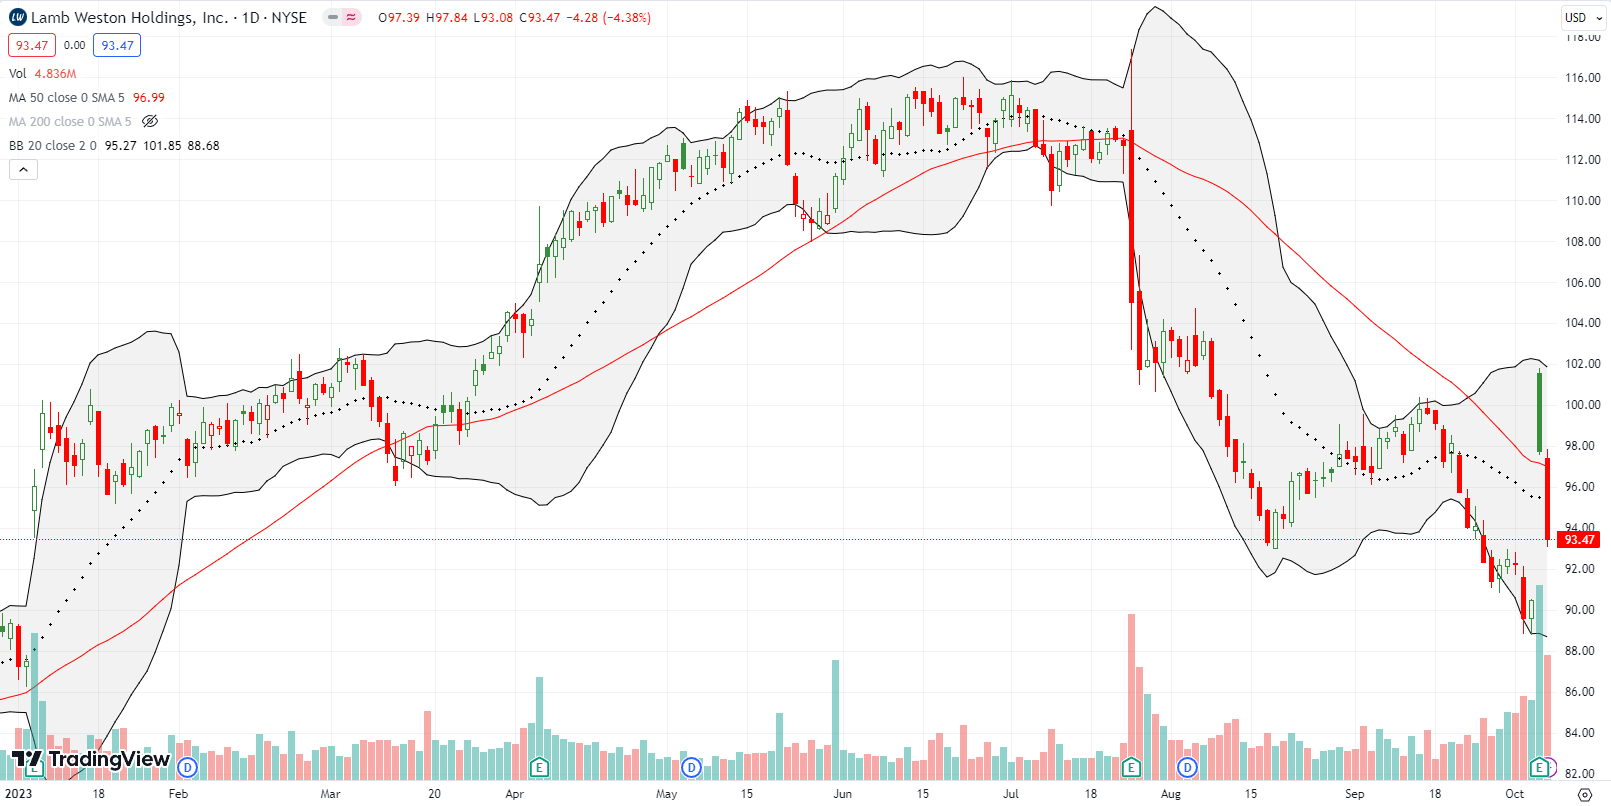
Lamb Weston Holdings, Inc (LW), a global frozen potato products company, stumbled into my scanning radar after a post-earnings surge on Thursday. Sellers sharply faded the stock from intraday highs, but LW held 50DMA support. At that point, LW looked like it could set up for a “calm after the storm” trade perfect for an exit from oversold conditions. Unfortunately, that support gave way to sellers on Friday as discretionary food plays banded together in suffering. The entire post-earnings gap is probably in danger as the post-earnings plunge from July looms as the larger signal. The following kind of guidance from the recent earnings conference call probably initially excited investors and analysts:
“While the overall potato category continues to be solid, due to the timing of contract openers, we are targeting our full year volume excluding acquisitions to be down mid-single-digits compared with the prior year. And we expect year-over-year volume trends will continue to improve as the year progresses, as we lap some of the significant low-margin, low product profit volume that we chose to exit in the second half of last year and as we gradually backfill the exited lower-margin business with more profitable business.”
LW finished erasing all its gains for the year just ahead of earnings, so this juncture is extremely important for the stock.
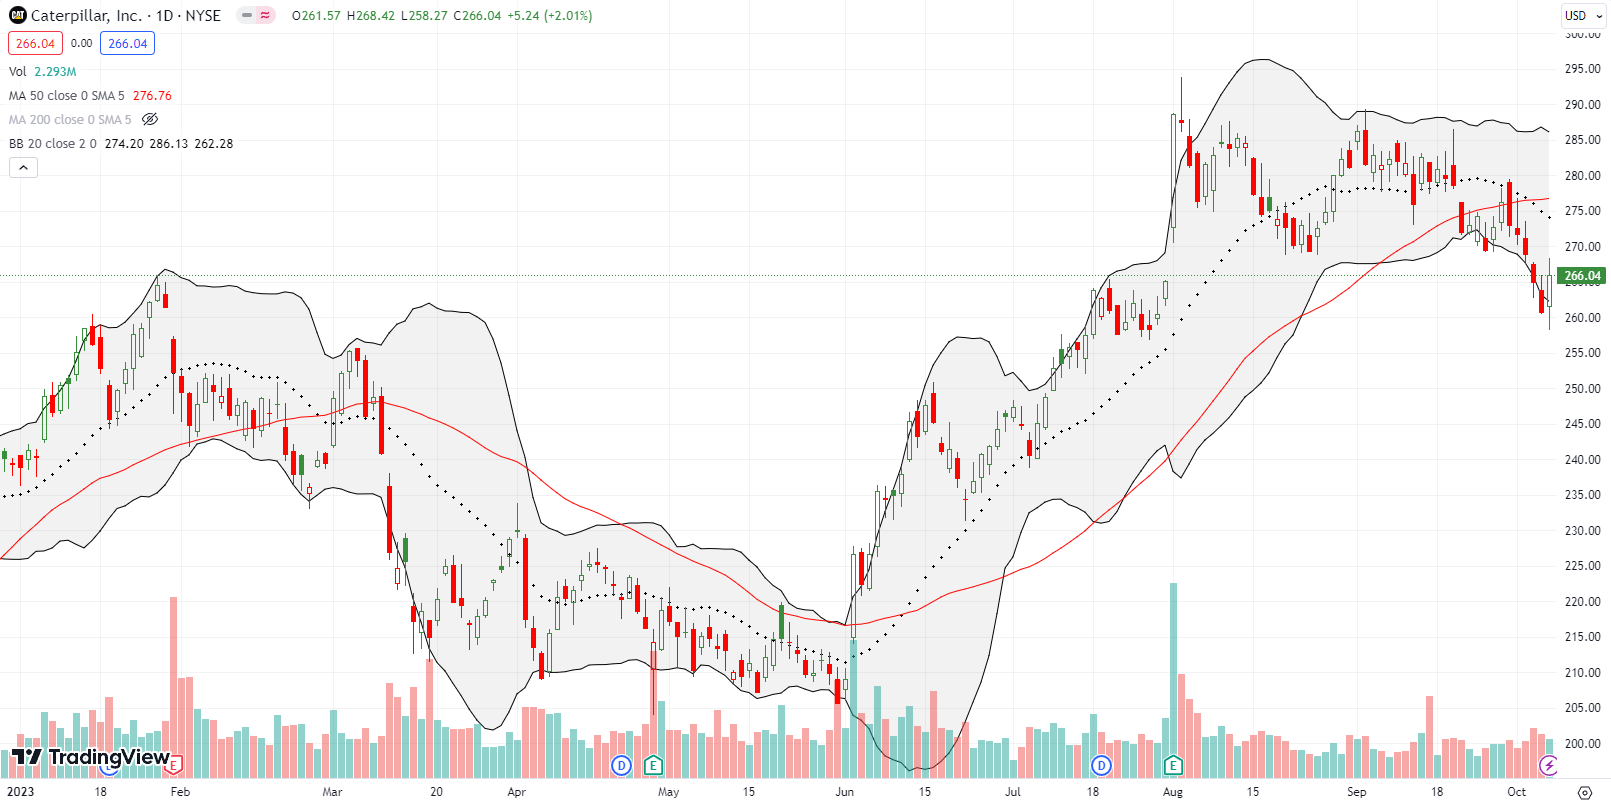
Caterpillar, Inc (CAT) confirmed a 50DMA breakdown last week. Thus, the bellweather industrial is flagging warnings for the market and general economy. Friday’s oversold bounce did not break the downtrend or even challenge resistance from the August lows. I am taking CAT off the trading shelf and will use it as one way to hedge against bullishness.
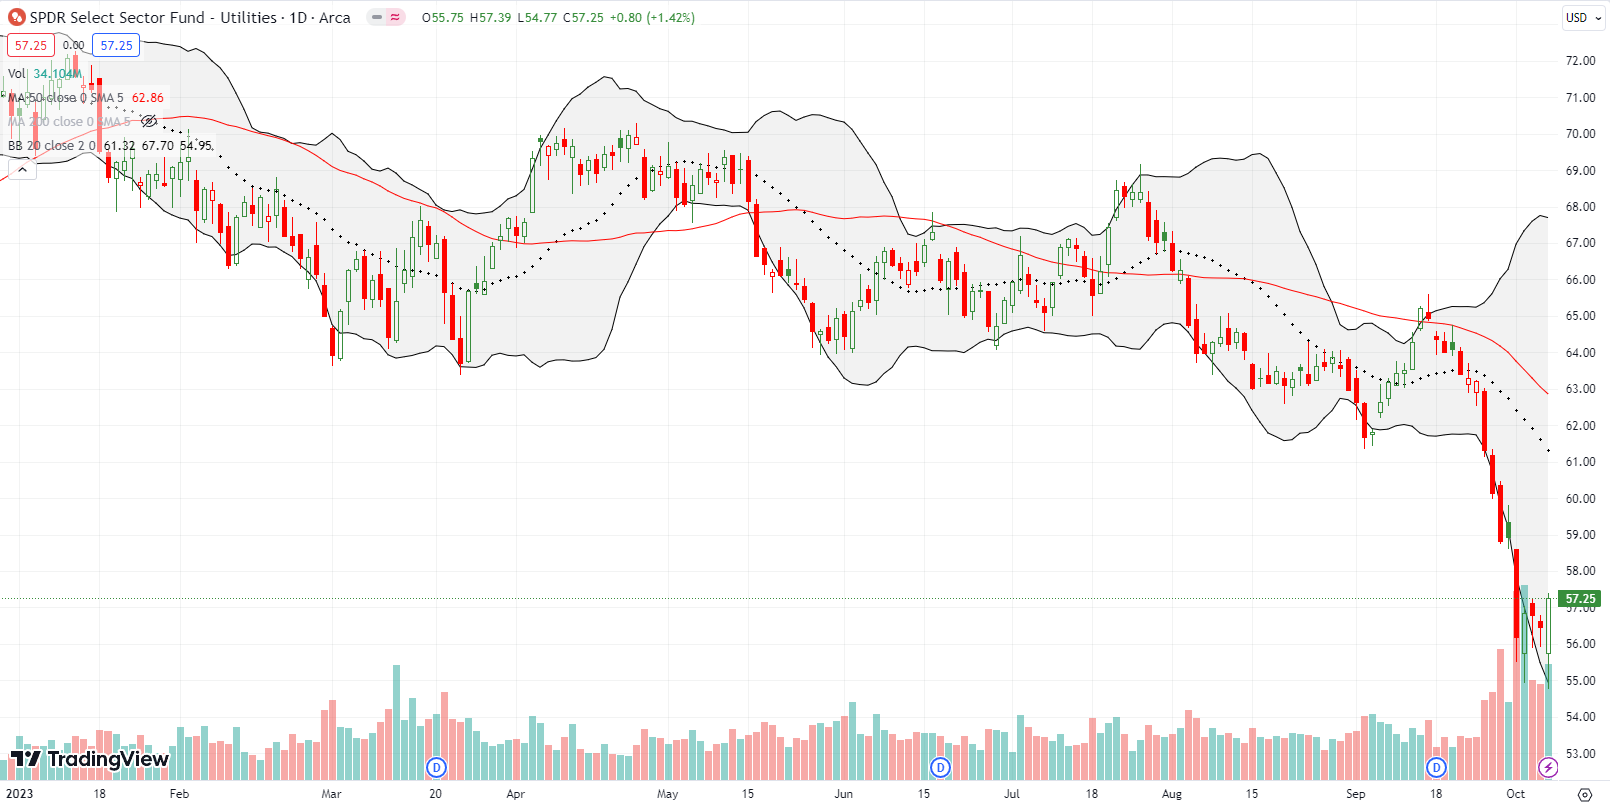
The extremes in interest rates have me on the hunt for potentially profitable contrary plays for an oversold bounce. The selling in utilities looked particularly over-extended last week with SPDR Select Sector Fund (XLU) punching out a series of closes below the lower Bollinger Band (BB) on high trading volume. I accumulated October call options on Wednesday and Thursday. Friday’s sharp rebound of 1.4% put the position well into the green. It will not take much more of an oversold bounce to deliver significant profits. Needless to say, I am looking to close out the swing trade next week.
Be careful out there!
Footnotes
Subscribe for free to get email notifications of future posts!
“Above the 50” (AT50) uses the percentage of stocks trading above their respective 50-day moving averages (DMAs) to measure breadth in the stock market. Breadth defines the distribution of participation in a rally or sell-off. As a result, AT50 identifies extremes in market sentiment that are likely to reverse. Above the 50 is my alternative name for “MMFI” which is a symbol TradingView.com and other chart vendors use for this breadth indicator. Learn more about AT50 on my Market Breadth Resource Page. AT200, or MMTH, measures the percentage of stocks trading above their respective 200DMAs.
Active AT50 (MMFI) periods: Day #1 over 20% (1st day of overperiod ending 4 days oversold), Day #14 under 30%, Day #24 under 40%, Day #38 under 50%, Day #43 under 60%, Day #46 under 70%
Source for charts unless otherwise noted: TradingView.com
Full disclosure: long VXX puts, long WING put spread
FOLLOW Dr. Duru’s commentary on financial markets via StockTwits, Twitter, and even Instagram!
*Charting notes: Stock prices are not adjusted for dividends. Candlestick charts use hollow bodies: open candles indicate a close higher than the open, filled candles indicate an open higher than the close.


