Stock Market Commentary
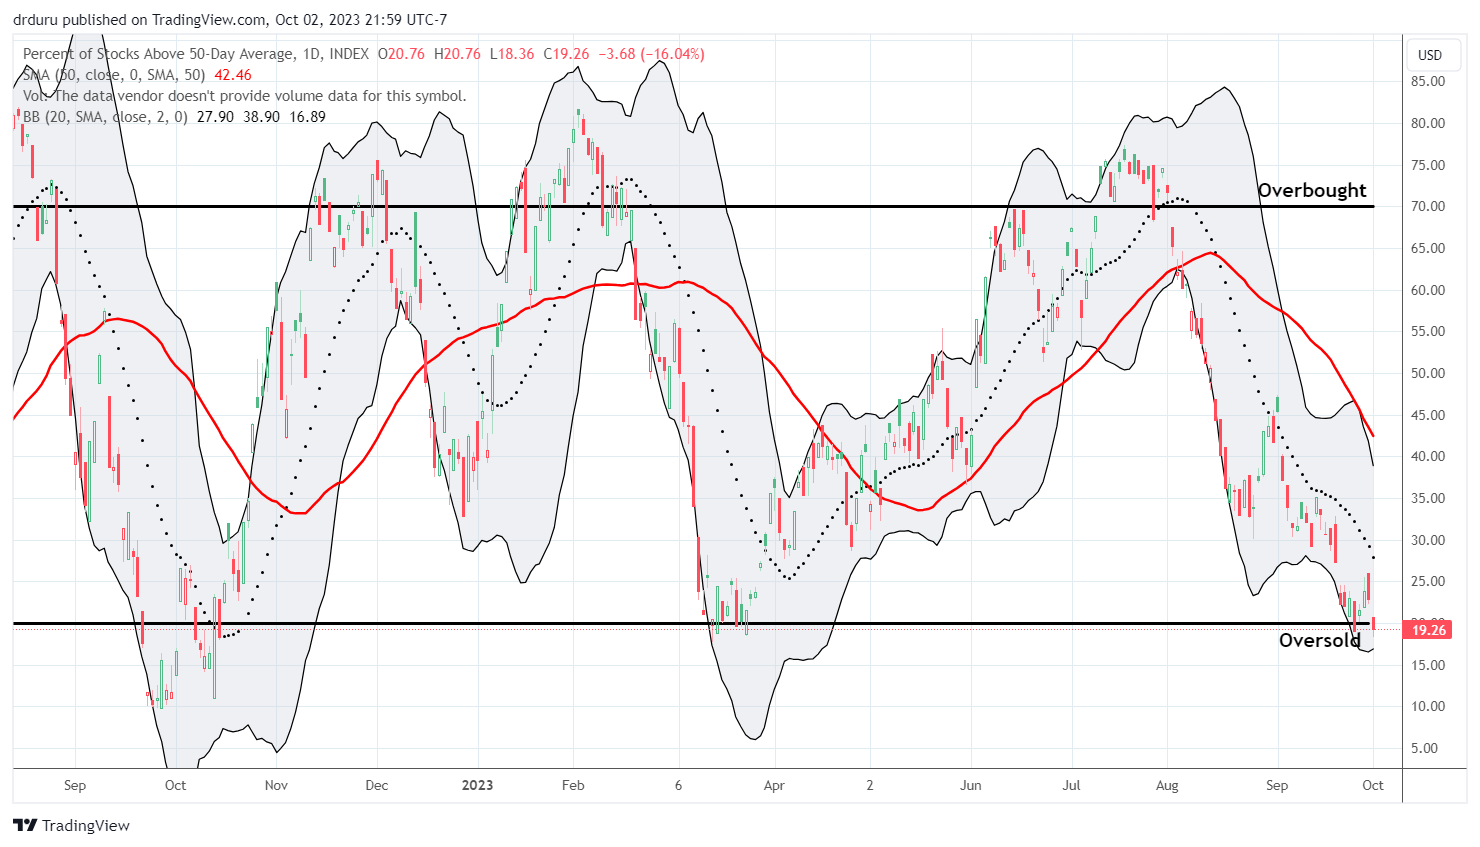
The last quarter of the year and the third of the stock market’s most dangerous months started off with a swirl of signals. Each of the three major indices exhibited its own behavior. Small cap stocks plunged and uncorked oversold trading conditions. The S&P 500 clung to flatline. The NASDAQ happily shot upward with a solid gain. This divergence is bearish as I always give advantage to market breadth. As a result, I could not get as bullish as I would like for this return to oversold conditions. I fully expect this visit to last longer than last week’s 1-day oversold period and/or October’s maximum drawdown will feature multiple oversold trips.
The Stock Market Indices
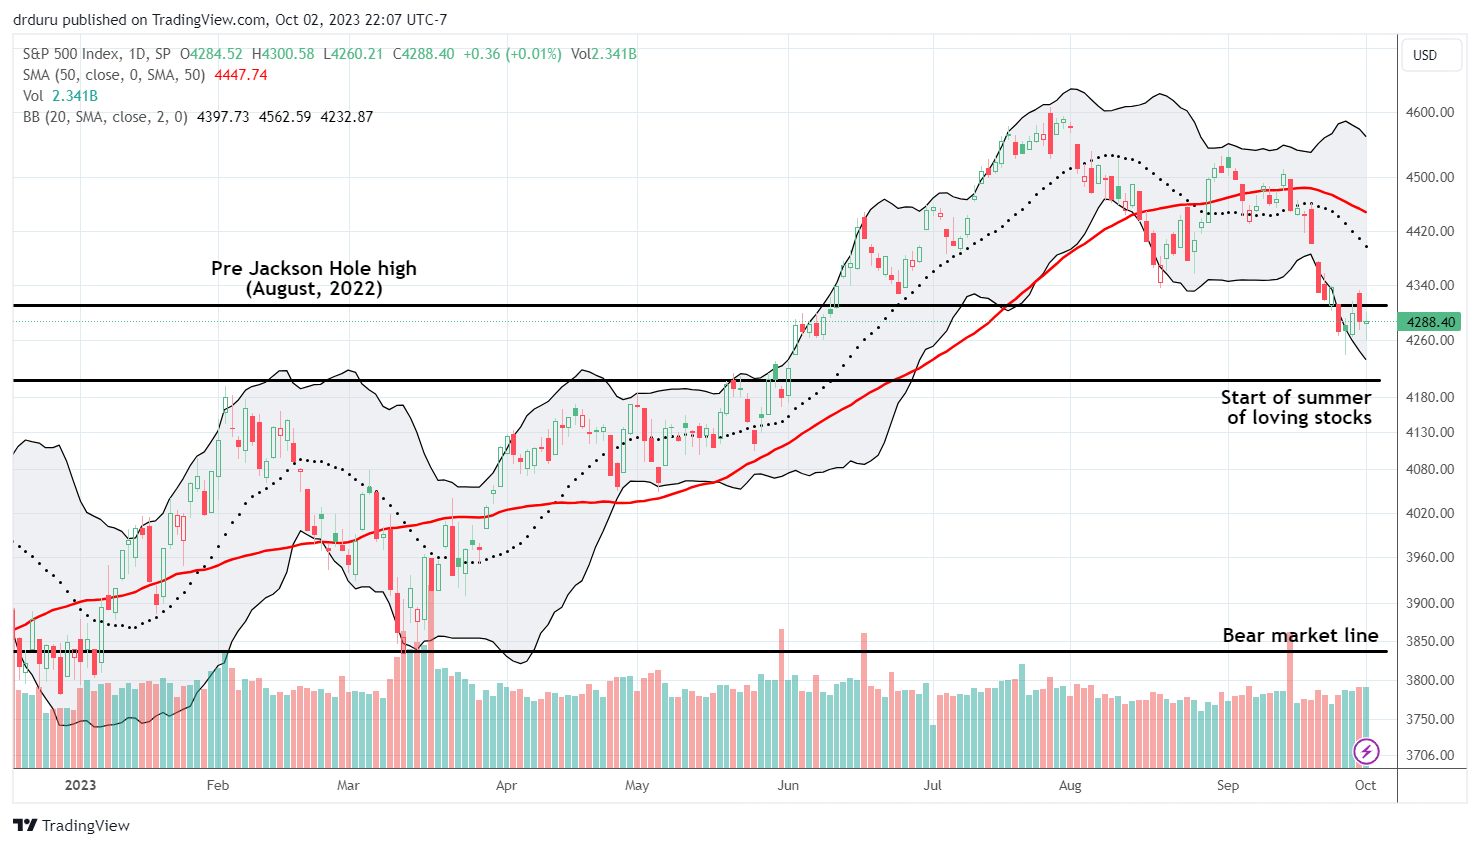
The S&P 500 (SPY) continued to churn under resistance from its pre Jackson Hole high from August, 2022. Buyers rushed into the fray at the intraday low and managed to stick a cork in losses on the day. However, the rebound failed to save the general stock market from reentering oversold trading conditions.
For now, the remaining gains from the summer of loving stocks look safe.
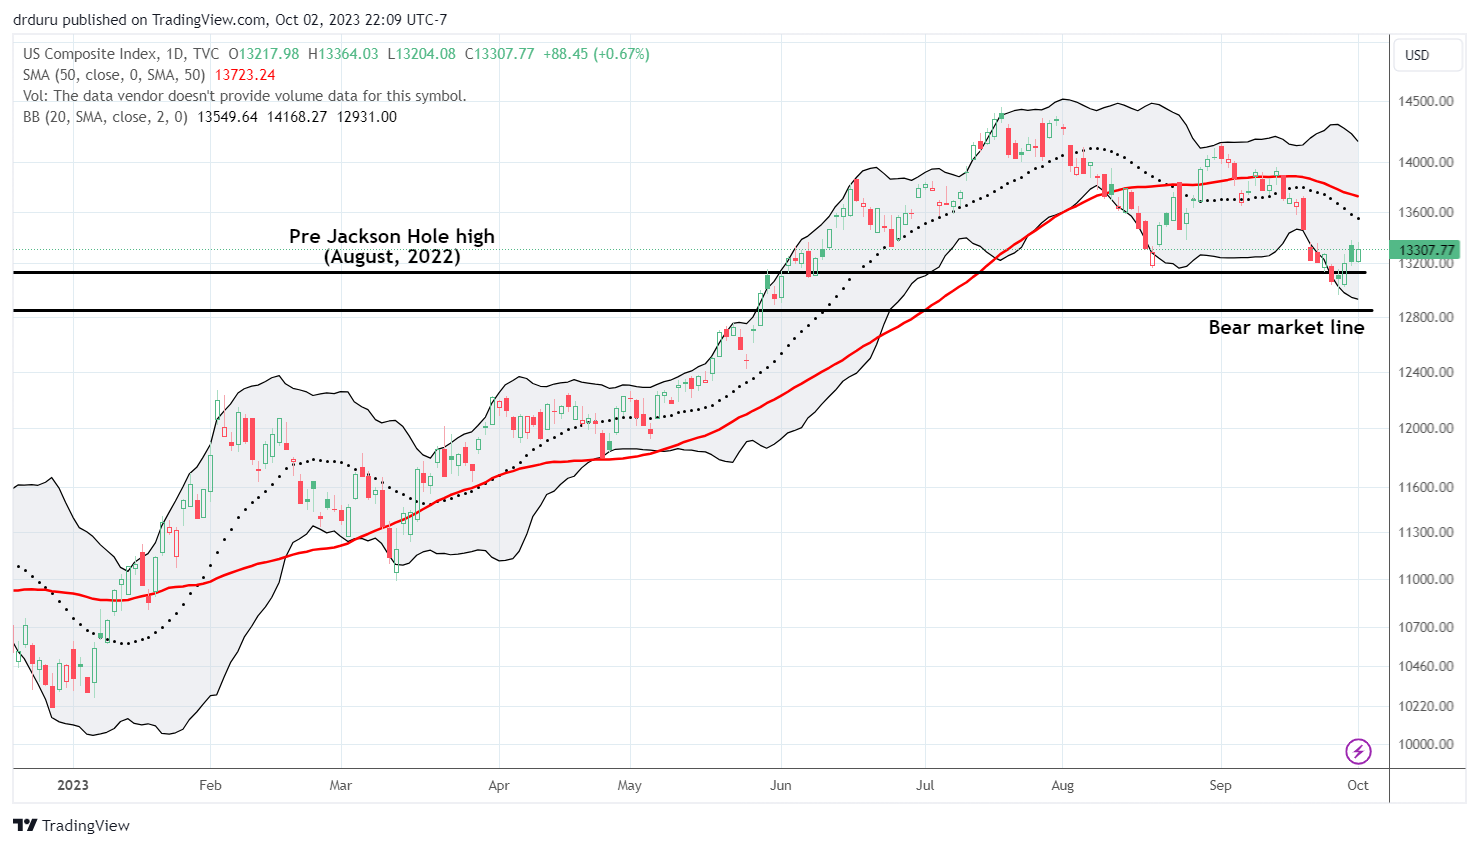
The NASDAQ (COMPQ) did the S&P 500 one better by spending most of the day in the green. The 0.7% gain managed to maintain the tech-laden index’s support at the pre Jackson Hole high. This support is in turn keeping the NASDAQ from reentering the previous bear market.
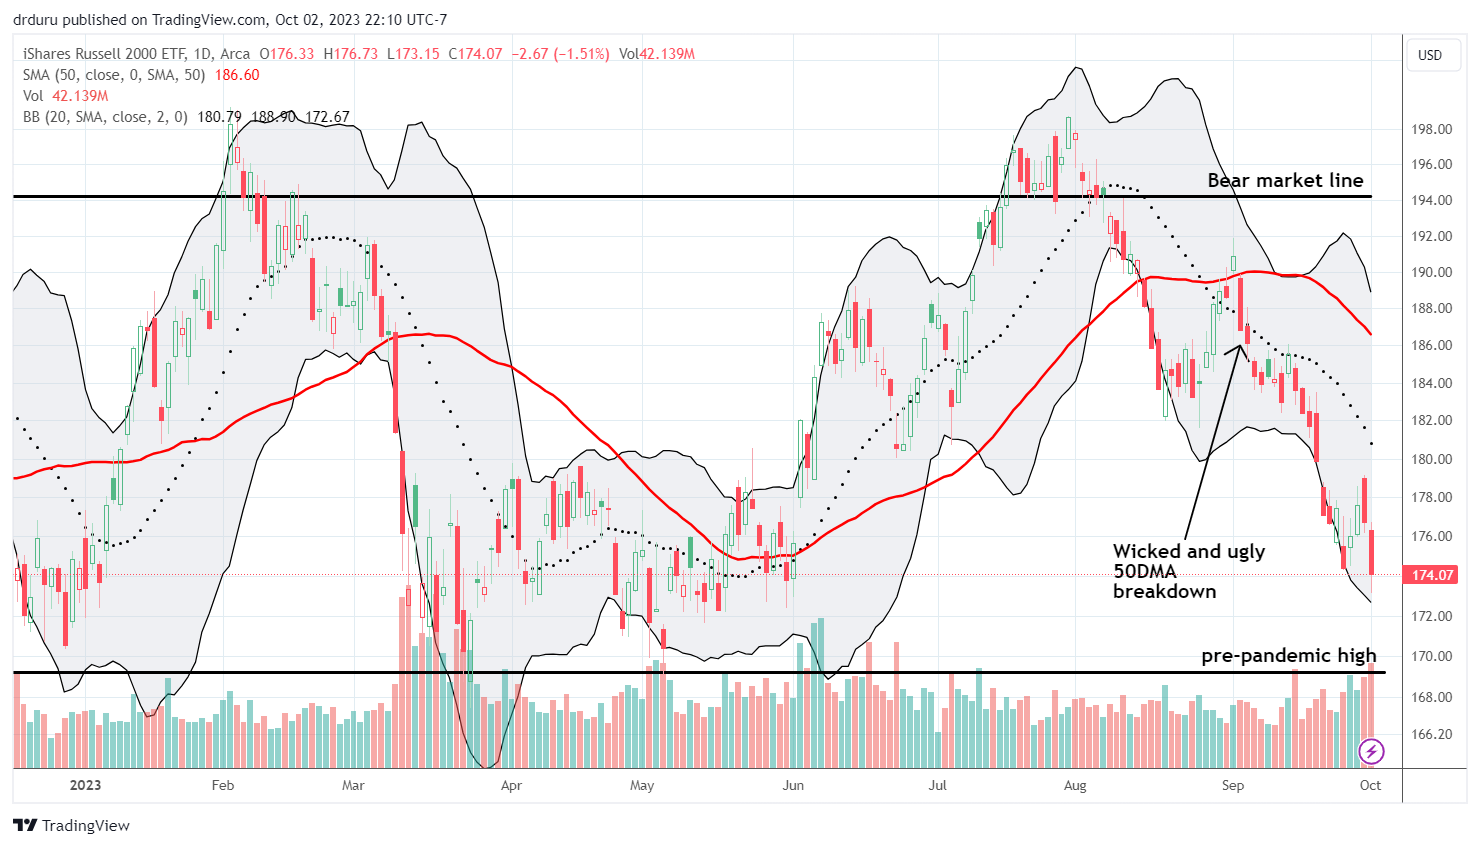
The iShares Russell 2000 ETF (IWM) was apparently largely responsible for uncorking oversold conditions. The ETF of small plunged 1.5% and crept ever closer to its (presumed) support at the pre-pandemic high. All of IWM’s gains for the year are gone and selling pressure is picking up. Unlike previous plunges, I decided not to speculate on a quick, rubber band bounce in IWM. The selling in the market was overly concentrated and not yet broad enough given the resilience in the S&P 500 and the NASDAQ.
The Short-Term Trading Call With Oversold Uncorked
- AT50 (MMFI) = 19.3% of stocks are trading above their respective 50-day moving averages
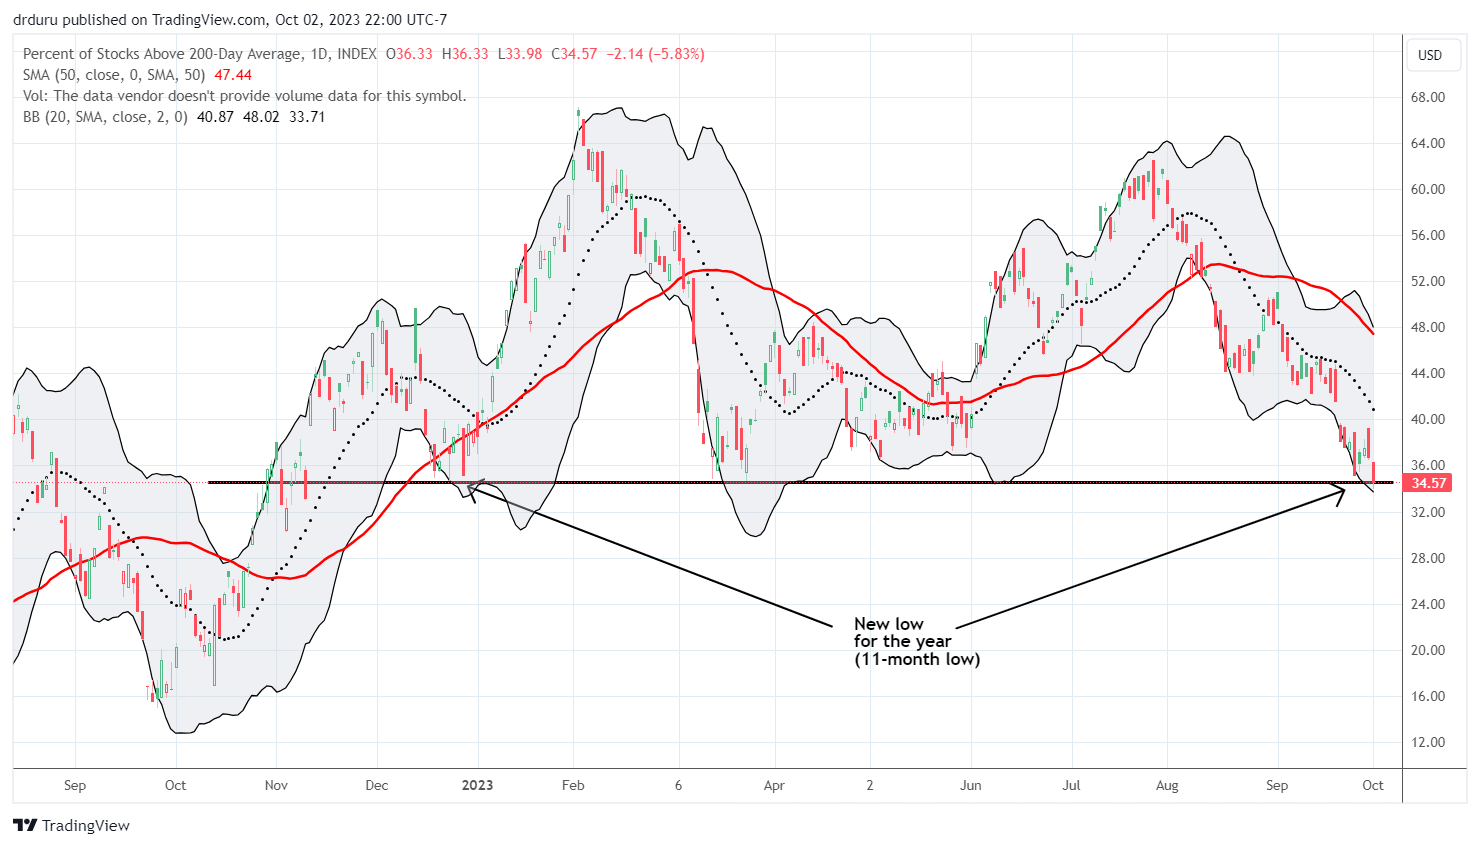
- AT200 (MMTH) = 34.6% of stocks are trading above their respective 200-day moving averages
- Short-term Trading Call: cautiously bullish
AT50 (MMFI), the percentage of stocks trading above their respective 50DMAs, only received a 3-day reprieve from oversold conditions. My favorite technical indicator wasted no time in trying to fulfill my expectation for an October return to oversold conditions. However, the NASDAQ also did its part to deliver the”obligatory” gains I expected for the whole market on the first day of trading for Q4.
The mixed trading left the volatility index (VIX) confused as well. The VIX only gained 0.5% after fading sharply from its intraday high. The VIX also fell short of last week’s highs. Thus, selling conditions were not extreme enough to get me excited about triggering my oversold buying rules. Accordingly, I left the short-term trading call at cautiously bullish instead of going all the way bullish as I had planned for the next oversold period.
One extreme that increasingly worries me is the plunge in the percentage of stocks trading above their respective 200DMAs, AT200 (MMTH). This longer-term indicator of health in the stock market fell to an 11-month low at 34.6%. The lower AT200 goes, the worse sentiment will get for holders of individual stocks who are watching uptrends and gains for the year evaporate.
The extremes also showed up in the bond market. U.S. Treasuries sold off sharply yet again as (presumed) fears continue over the massive funding needs of the U.S. federal government. The iShares 20+ Year Treasury Bond ETF (TLT) lost another 2.0% and closed at levels last seen in January, 2011! Another sign of extremes came on CNBC’s Fast Money where perennial sourpuss Rick Santelli delivered his scenario for a potential 13% yield on the U.S. 10-year treasury. Santelli prognosticated a 7-year runway which I assume is related to the Congressional Budget Office’s dire warnings that I discussed in the last post. This 7-year runway is too long to trade, but soon enough to contribute to extreme fear. While I refuse to chase TLT downward, I am staying alert for some kind of washout of selling that coincides with other extreme oversold signals.
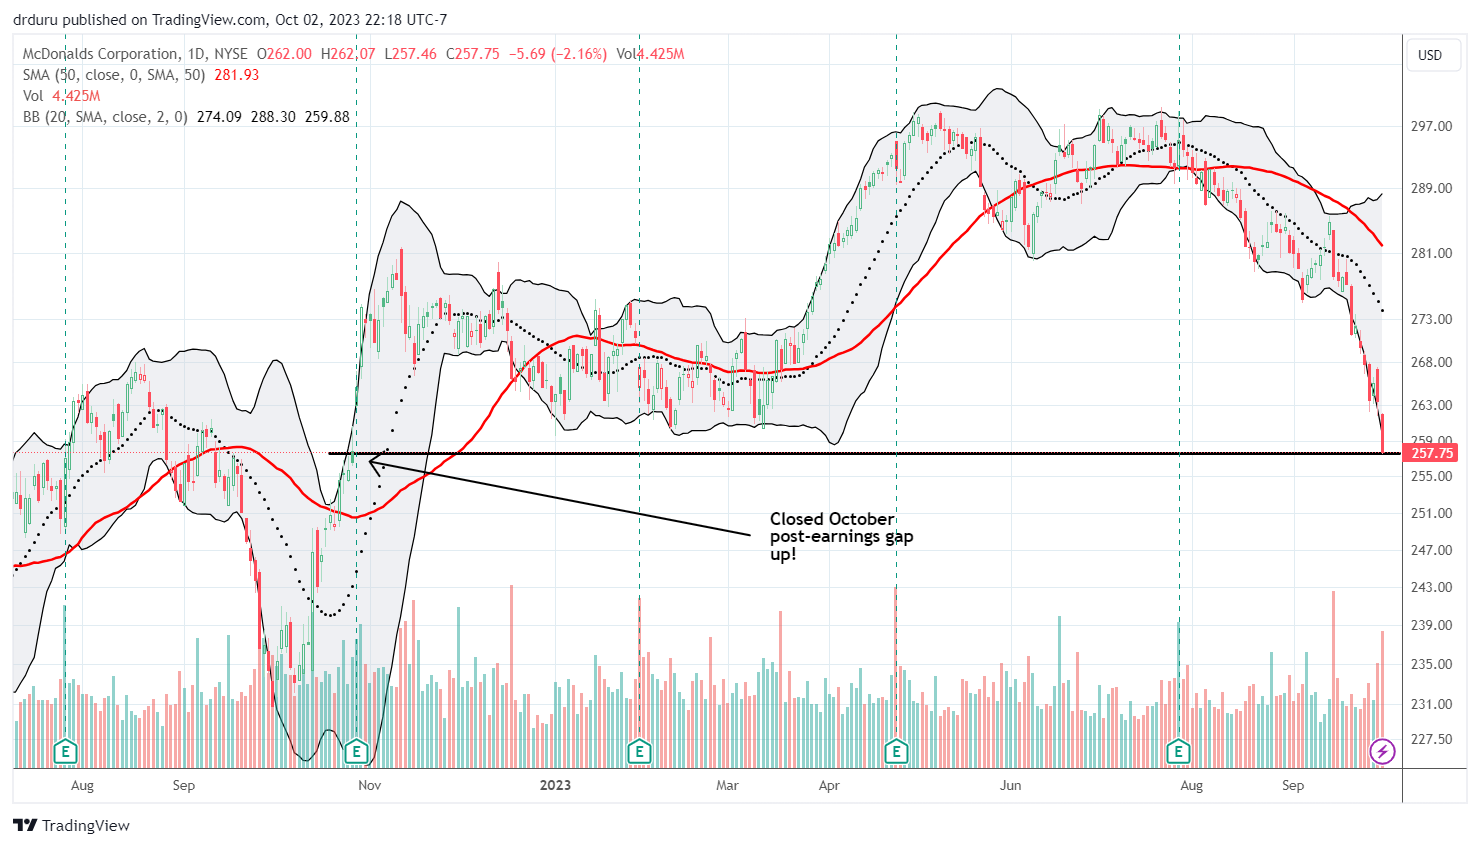
One more look at McDonalds (MCD). The speed and persistence of the sell-off in MCD is now taking me aback. I thought I did good to hold my put spread through the fakeout bounce earlier in September. Now I am of course wondering why I did not target taking profits at a full reversal of the October, 2022 gap up.
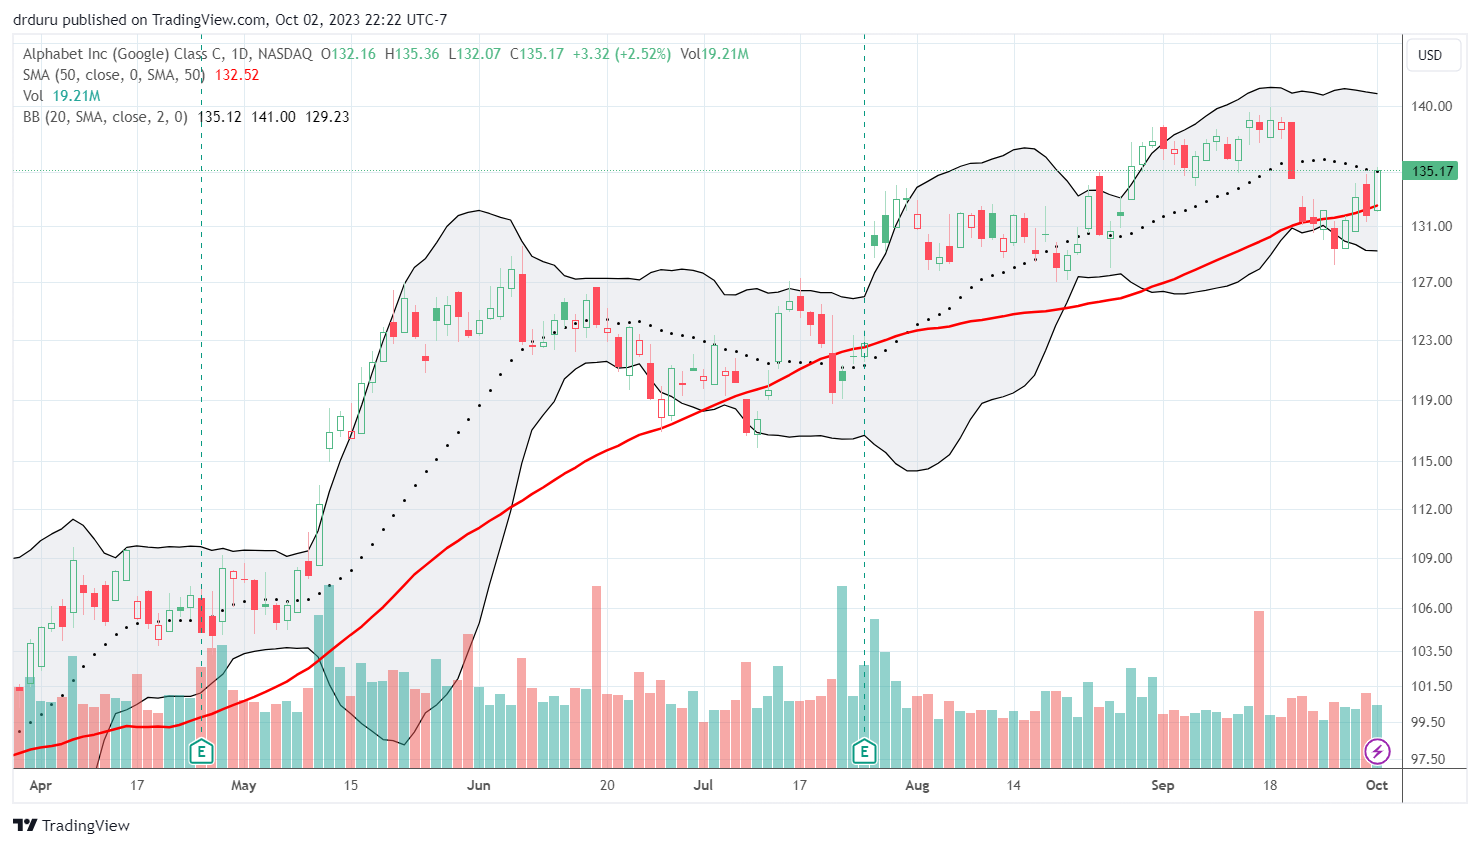
Alphabet Inc (GOOG) sat on the other side of the day’s ledger. One of my favorite generative AI trades put on a surprising show of strength with a 2.5% gain. Although GOOG tapped resistance at its 20-day moving average (DMA) (the dotted line below), I kept holding my call spread. I am looking to sell into a breakout tomorrow. Otherwise, I will take whatever remaining profits the market leaves for me.
Be careful out there!
Footnotes
Subscribe for free to get email notifications of future posts!
“Above the 50” (AT50) uses the percentage of stocks trading above their respective 50-day moving averages (DMAs) to measure breadth in the stock market. Breadth defines the distribution of participation in a rally or sell-off. As a result, AT50 identifies extremes in market sentiment that are likely to reverse. Above the 50 is my alternative name for “MMFI” which is a symbol TradingView.com and other chart vendors use for this breadth indicator. Learn more about AT50 on my Market Breadth Resource Page. AT200, or MMTH, measures the percentage of stocks trading above their respective 200DMAs.
Active AT50 (MMFI) periods: Day #1 under 20% (1st day oversold), Day #10 under 30%, Day #20 under 40%, Day #34 under 50%, Day #39 under 60%, Day #42 under 70%
Source for charts unless otherwise noted: TradingView.com
Full disclosure: long S&P 500 call spread and call
FOLLOW Dr. Duru’s commentary on financial markets via StockTwits, Twitter, and even Instagram!
*Charting notes: Stock prices are not adjusted for dividends. Candlestick charts use hollow bodies: open candles indicate a close higher than the open, filled candles indicate an open higher than the close.


