

Housing Market Intro and Summary
The window for new home sales stealing share from existing home sales may be grinding to an end. Another plunge in sentiment for home builders combined with mortgage rates trending fast and furiously upward toward 8% are exerting more and more friction on the entire housing market. The stocks of home builders are accordingly weighed down by the deteriorating housing market data.
The last Housing Market Review showed a housing market on an edge that divided encouraging data from concerning data. The latest data favor the concerning side of the ledger. The month’s small price declines did little to change the painful irony of fresh upward momentum in housing prices that further reduce market affordability. With the Federal Reserve comfortable leaving rates “higher for longer” to fight inflation, there are few prospects for a near-term positive catalyst for the housing market. Both housing sales and home builder stocks look topped out for some time to come.
Housing Stocks
In my last Housing Market Review, I claimed that iShares US Home Construction ETF (ITB) would not resume its uptrend after its rapid recovery from its August breakdown. I could not know it at the time, but ITB topped out exactly at that point and has sold off ever since. All the gains from summer are now gone. As long as mortgage rates continue their march toward 8%, I further expect ITB to go lower. Each point of deteriorating housing data will bring more sellers into the sector.
The upshot of the selling pressure is the concurrence with the imminent start of the seasonal strength for home builder stocks. Oversold conditions in the stock market represent the beginning of buying opportunities in home builders. Granted, such buys will be particularly difficult as housing data worsen. Accordingly, I am likely to push the start of the season later into November.
")
The rampant bullishness in home builder stocks running into the last top was certainly misplaced. That fervor provides the fuel for the pullback as sentiment cools off. The nearly orderly nature of the downtrend likely represents big institutions with planned selling programs. They cannot afford to dump their holdings all at once as the swell in volume could crash the stocks. I am still waiting to see a wave of analyst downgrades. For example, analysts are still at their most bullish of the year on Lennar (LEN).
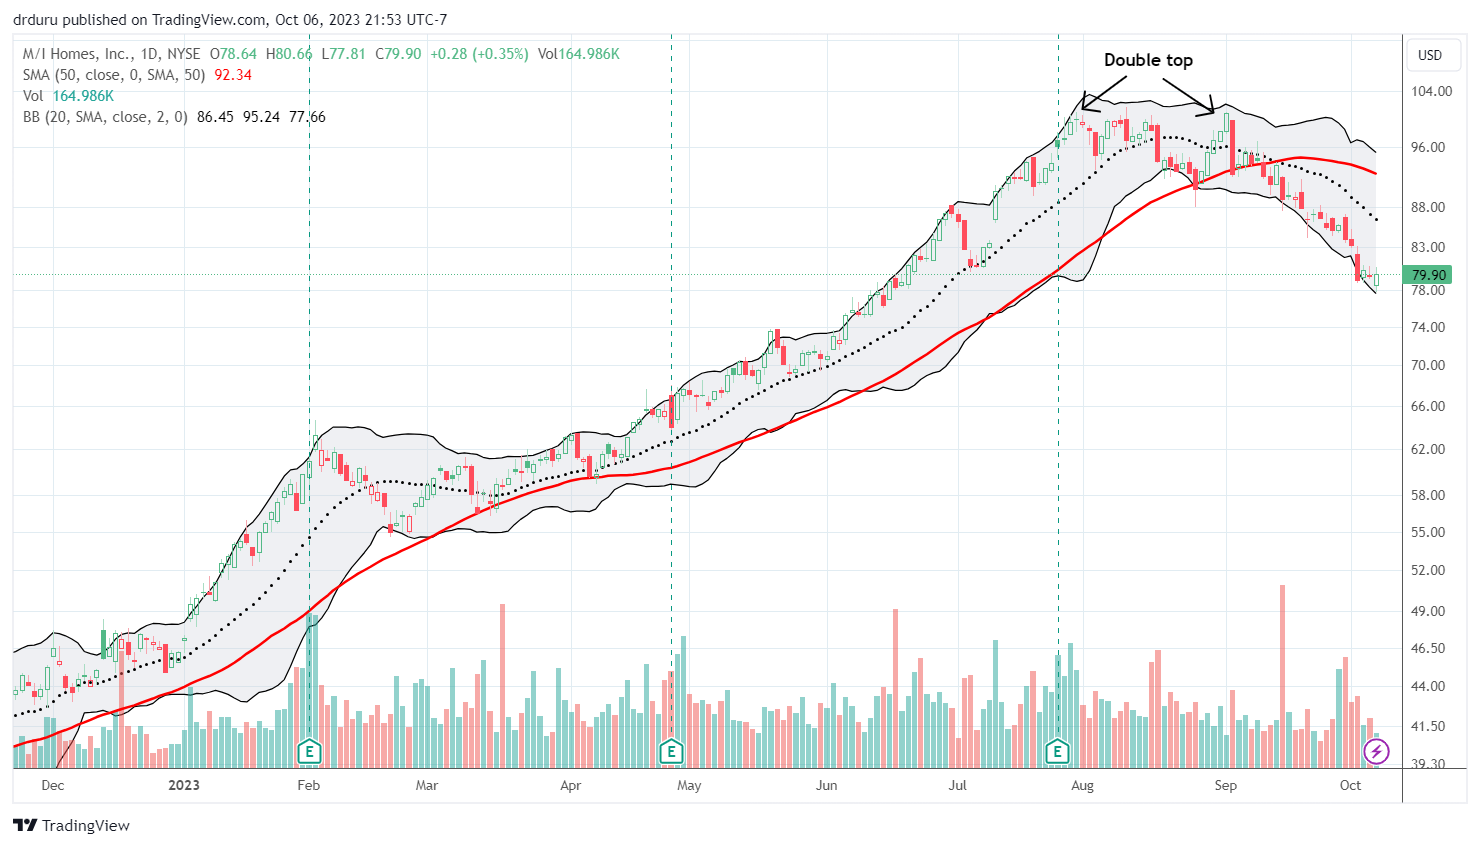
I previously featured M/I Homes (MHO) as the home builder which emerged strongest from the correction from all-time highs. Like ITB, that point marked the next top for MHO. MHO’s pullback has been even more consistent than ITB’s. Unlike ITB, MHO is still clinging to some of its gains from the summer. I will be earnestly watching earnings for signs of the next general direction for home builders.
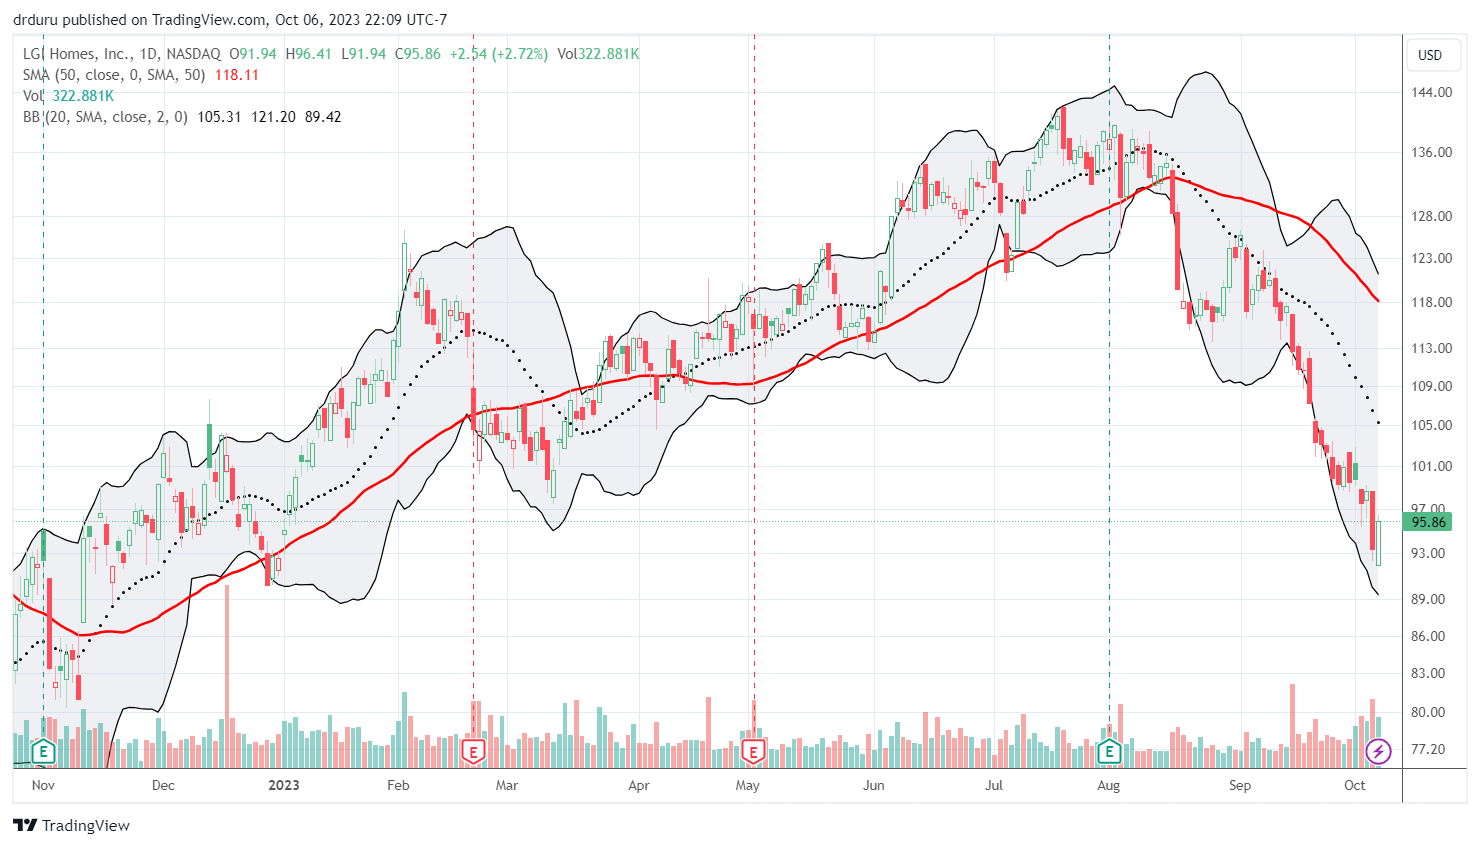
LGI Homes (LGIH) used to hold the crown for one of the strong home builders in my universe. Now, LGIH is one of the weakest as the recent pullback has eliminated almost all of LGIH’s gains for the year. LGIH’s high for the year fell far short of its all-time high from 2021. On a valuation basis (price/book), LGIH was last this “cheap” back in November, 2022.
Housing Data
Home Builder Confidence: The Housing Market Index – September, 2023
In June, the National Association of Home Builders (NAHB)/Wells Fargo Housing Market Index (HMI) entered positive sentiment territory (over 50) for the first time in almost a year. HMI further increased in July to a 13-month high. The persistent recovery in home builder confidence next hit a wall in August. Sentiment plunged back to 50. Sentiment returned to negative territory in September with a second monthly plunge to 45.
The NAHB suggested that stubbornly high mortgage rates above 7% helped to drive the steep two month decline in sentiment. The industry group reiterated supply-side concerns as a weight on sentiment and added the cost and availability of home insurance to the list. Thus, a return to price discounting further confirms the fresh decline in sentiment. The share of builders cutting prices returned to levels last seen in December, 2022 although the average price discount stayed flat at 6%. The share of builders providing incentives hit a 5 month high.
The lack of resale inventory from a general unwillingness to move by existing home owners has pushed buyers to new homes and bolstered the fortunes of builders. In the latest survey, the NAHB got a read on the share of first-time home buyers; these are people who do not have to sell a home to move. The NAHB found that “42% of new single-family home buyers were first-time buyers on a year-to-date basis in 2023. This is significantly higher than the 27% reading from a more normalized market in 2018.” Quite a telling statistic!
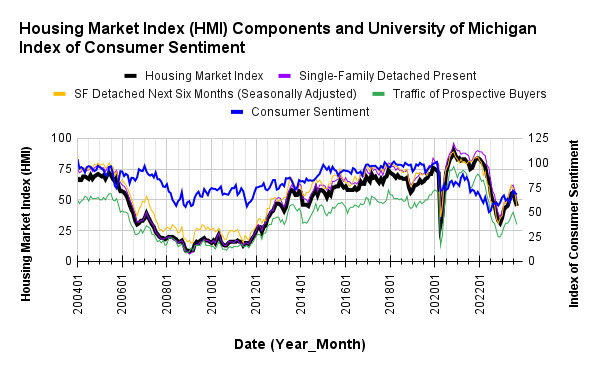
/Wells Fargo Housing Market Index (HMI) and the University of Michigan Index of Consumer Sentiment")
Source for data: NAHB and the University of Michigan
The HMI bottomed 5 months after consumer sentiment. Earlier, I thought consumer sentiment had topped out and would cap HMI as well. Instead, HMI helped pull consumer sentiment upward…but for just one month. My expectations for a topping out in housing activity and home builder stocks is now fully supported by the parallel declines in the HMI and consumer sentiment.
The decline in HMI was broad-based across the components. Each one declined significantly from August’s levels.
The regional HMIs each took a hit. The Northeast and the South joined the other two regions in negative sentiment territory. The plunge in the South is particularly notable as sentiment in the region is now below its March level. That ties the Midwest on a relative level. Such a sharp drop in the South augurs poorly for overall HMI in the coming months.
New Residential Construction (Single-Family Housing Starts) – August, 2023
Housing starts look like they have stalled out right under the 1M level. Housing starts decreased 4.3% month-over-month to 941,000. Starts continued year-over-year strength with a 2.4% gain in August. However, with a decline of HMI below 50, the 1M ceiling on housing starts looks ever firmer for the short-term.
![US. Bureau of the Census, Privately Owned Housing Starts: 1-Unit Structures [HOUST1F], first retrieved from FRED, Federal Reserve Bank of St. Louis, September 26, 2023](https://drduru.com/onetwentytwo/wp-content/uploads/2023/09/20230926_Housing-Starts.png "Housing starts")
Building permits in August generated a seventh consecutive monthly increase with a 2.0% gain (July’s 0.6% monthly gain was not revised). The sequential growth picked back up again despite the stalled growth in new housing starts. The surprising message from building permits appears to be to expect a breakout later this year. However, I am not ready to believe the message given mortgage rates continue climbing.
The South was the only region with a year-over-year gain in starts. It was also the only region with a month-over-month gain in starts. The South must be a primary beneficiary of the robust building permits growth as a rebound seems underway for starts in the region. However, given the South also suffered the largest relative sentiment decline in September, I fully expect starts growth to hit a wall in the South. Housing starts in the Northeast, Midwest, South, and West each changed -10.0%, -15.1%, +14.6%, -12.8% respectively year-over-year.
New Residential Sales (Single-Family) – August, 2023
New home sales look weighed down by the burdens of mortgage rates elevating over 7%. The drop in August ended an impressive uptrend for the year and likely signaled the top in new home sales for months to come. The 739,00 new single-family homes sold in July (revised upward from 714,000) were a 17-month high. The 675,000 sold in August were a 5 month low. While sales fell 8.7% month-over-month, favorable comparables facilitated a 5.8% year-over-year gain. August’s decline is consistent with my claims from the last Housing Market Review: “With rates above the 7% level, I still expect new home sales to flatten out in the near-term. The plunge in builder confidence suggests a flattening is in store.”
![US. Bureau of the Census, New One Family Houses Sold: United States [HSN1F], first retrieved from FRED, Federal Reserve Bank of St. Louis, October 1, 2023.](https://drduru.com/onetwentytwo/wp-content/uploads/2023/10/20231001_New-Home-Sales.png "new home sales")
The median price dropped 1.4% from July to $430,300, also a 2.3% year-over-year decrease. The year-over-year changes look like they have bottomed out and supports July’s big price jump as a bottom in prices.
A transition in price mix could be underway, but it is still difficult to determine the dominant narrative. In August, the year-over-year changes featured the middle price ranges giving up share to the edges with the lower ranges outweighing the higher ranges. On a monthly basis, the reduction in the middle shifted more share to the top ranges than the lower ones.
The inventory for new homes increased to 7.8 months of sales from 7.3 in July. While the market remains above the 6.0 level characteristic of a balanced market, absolute inventories decreased slightly from 437,000 to 436,000.
In July, all four regions surged in sales year-over-year with the South gaining the least. For August, the South was the only region with a year-over-year decrease in sales. The Northeast, Midwest, South, and the West changed +18.5%, +24.2%, -9.2%, and +44.1% respectively. The West enjoyed a second monthly surge.
Existing Home Sales – August, 2023
Existing home sales continued a near year-long decline with a 0.7% month-over-month drop in August. The seasonally adjusted annualized sales in August of 4.04M declined 15.3% year-over-year. With sales essentially back to the lows of the year, my expectations for stabilization are almost shot. The second chart below shows that existing single family homes, excluding condos and coops, are not just back to the low of the year but also below the pandemic low. Sales are close to hitting a new 12-year low. The stabilization I expected for existing home sales is happening for condos and coops. I suspect better affordability works in favor of these housing units.

(For historical data from 1999 to 2014, click here. For historical data from 2014 to 2018, click here) Source for chart: National Association of Realtors, Existing Home Sales© [EXHOSLUSM495S], retrieved from FRED, Federal Reserve Bank of St. Louis, October 1, 2023

After falling month-over-month for the first time in July, the median sales price of an existing home resumed its incline in August. The 0.3% price increase was too small to return the median to an all-time high, but it is still up 3.8% year-over-year. Combined with higher mortgage rates, existing homes are as unaffordable as ever. The National Association of Realtors (NAR) claimed that “supply needs to essentially double to moderate home price gains.”
Unfortunately, absolute inventory keeps shrinking instead. August’s absolute inventory of 1.1M homes fell 0.9% from July and decreased 14.1% year-over-year. According to the NAR, “unsold inventory sits at a 3.3-month supply at the current sales pace, identical to July and up from 3.2 months in August 2022.”
The significant demand pressures kept the average time on market for an existing home flat with July’s 20 days, up from 18 in June and May. The 72% of homes that sold within a month is down from the 74% in July.
The share of sales to first-time home buyers surged to 30% in July but slipped a percentage point in August. The 29% share for first-time home buyers matched the share from a year ago. First-time home buyers are supposed to be most sensitive to price and early to exit from a tough market. These resilient levels are happening even with the large share first-timers have achieved in new home sales. The NAR’s 2017 Profile of Home Buyers and Sellers reported an average of 34% for 2017, 33% for 2018, 33% for 2019, 31% for 2020, 34% for 2021, and 26% for 2022. The first-time buyer share for 2022 is the lowest on record for the NAR. I no longer think that record will break this year.
As has been the pattern for most of the year, all regions declined significantly in sales year-over-year. The West and the South were the two regions which also declined month-over-month. The regional year-over-year changes were: Northeast -22.6%, Midwest -16.4%, South -12.4%, West -15.7%.
No region experienced a year-over-year price decline. The West was the first region to flip negative in January, but the region was flat for July and up for August. The regional year-over-year price changes were as follows: Northeast +5.8%, Midwest +6.8%, South +3.2%, West 1.0%.
Single-family existing home sales decreased 1.4% from July and declined on a yearly basis by 15.3%. The median price of $413,500 was up 3.7% year-over-year and up 0.6% month-over-month for single-family existing home sales.
California Existing Home Sales – August, 2023
The California Association of Realtors (C.A.R.) remains hopeful for the near-term future for existing home sales in California, but the narrative is a bit convoluted. The Association describes rising prices as a good feature of the market but also claims that stabilizing prices and moderating mortgage rates will bring out both buyers and sellers into the market.
“The highly competitive housing market continued to provide support to home prices, with the statewide median price steadily improving since early 2023. As California housing prices continue to stabilize, buyers and sellers on the sidelines will get back into the market once interest rates begin to moderate in the fourth quarter.”
What will moderate mortgage rates? A softening in economic conditions. A softening bad enough to materially bring down rates normally delivers higher unemployment. Housing markets typically go the way of the jobs market. Thus, the C.A.R.’s combined logic seems to be a goldilocks economic scenario featuring just enough but not too much softening.
“While rates may remain elevated for a little longer, macroeconomic fundamentals are expected to soften starting in the last quarter of this year. Mortgage rates should begin to ease, albeit gradually, in the next couple months, and provide a much-needed boost to both the supply and the demand sides of the housing market.”
I expect prices to moderate with softening economic conditions. Yet, sellers are no more likely to add to inventories with “easing” mortgage rates than they were a year ago. Hopefully, the C.A.R. is not making an oblique reference to foreclosures forcing inventory on the market!
Sales of existing single-family homes in California declined 5.3% from July to August and declined 19.0% year-over-year to 254,740. August’s median home price increased 3.3% from July and held above $800,000 for the fifth month in a row and to a 15-month high. The median price is now up 3.0% year-over-year, the largest yearly price gain in 14 months. The month-over-month price change on a square footage basis increased from $404 a year ago to $417 (a 3.2% gain).
The Unsold Inventory Index (UII) fell 14.3% year-over-year from 2.8 to 2.4. The UII decreased 4.0% which the C.A.R. described as a seasonal effect. Active listings are on a 5-month losing streak based on year-over-year losses, but they have also increased sequentially for the last 5 months. Slowly but surely, active listings are trickling back into the market.
The on-going competitiveness lightened up just a touch with the average time to sell a home increasing back to 18 days from 16 days in July but still well off the 23 days a year ago. The statewide sales-price-to-list-price ratio stayed flat for the fourth month in a row at 100.0%.
Home closing thoughts
Taking Someone Else’s Lunch to Grow
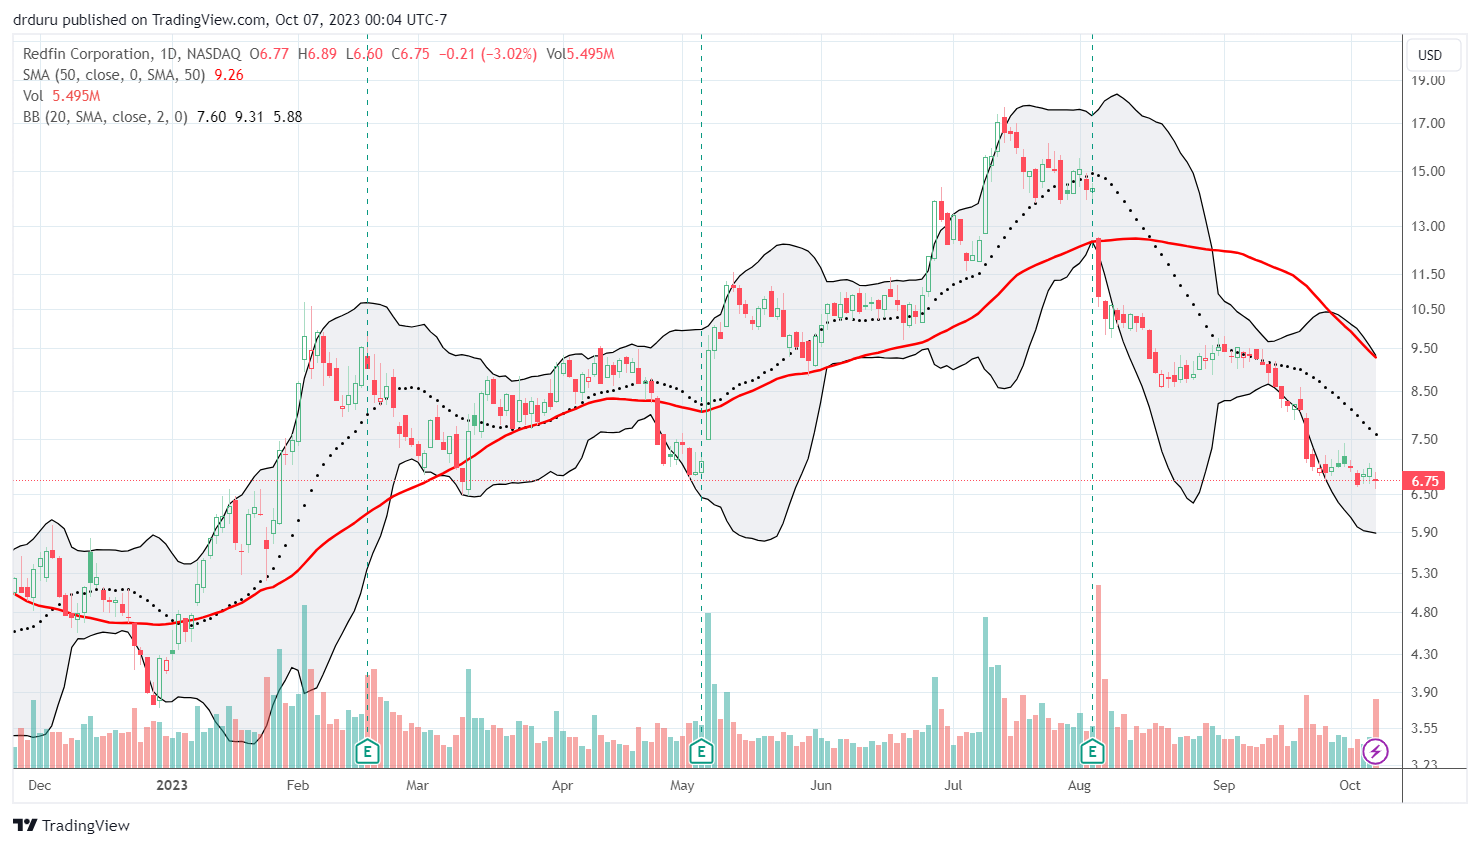
At the end of May, I expressed skepticism about the prospects for online real estate broker Redfin Corporation (RDFN). From that point, on no news, the stock proceeded to take off in a spectacular run for 6 weeks. The bizarre move came to an end first from a sharp cooling following a parabolic move and, no surprise to me, earnings brought reality crashing into the stock price. The stock has sold off since then and is now finally at the stock price I targeted over 4 months ago. Such is the randomness of the stock market that traders can get things wildly wrong.
So I took great interest in a CNBC interview with CEO Glenn Kelman in which he explained the troubles in the housing market. Kelman spoke to familiar narratives, but my ear perked up when Kelman offered the ability to take market share in a declining market as the company’s value proposition (emphasis mine): “We just have to reduce our costs…we’ve cut non-core businesses…it’s put us in a position where as we take market share, we can build a profitable business. But there’s no free lunch here. We have to take someone else’s lunch to be able to grow because we are in a shrinking market.” The problem, of course, is that if the market is shrinking faster than you can take share, you still lose on balance. RDFN is losing on balance along with other housing-related companies reliant on sales transactions.
Kelmann also helped me realize that home builders will soon stare down a similar problem if it has not started already. Builders have thrived for over a year by taking share from existing homes. Unfortunately, if the overall market does not kick back into growth, then builders will continue to feel the same pressure as the rest of the housing industry.
The Assumable Mortgage
Speaking of relying on real estate transactions….Yahoo Finance recently wrote about real-estate start-up Roam, a company trying to extend affordability in the housing market by enabling buyers to take on the existing loan of the seller. The article is not clear on the mechanics of transferring a loan from seller to buyer, but the article does note there are specific conditions for assuming a mortgage loan:
“Loans that are backed by the Federal Housing Administration (FHA) or by the Department of Veterans Affairs (VA) or United States Department of Agriculture (USDA) are assumable as long as the requirements are met. And sellers with FHA and VA loans need lender approval.”
Roam’s CEO stated that around 30-33% of home loans originated in 2020 or 2021 are assumable, government-backed loans.
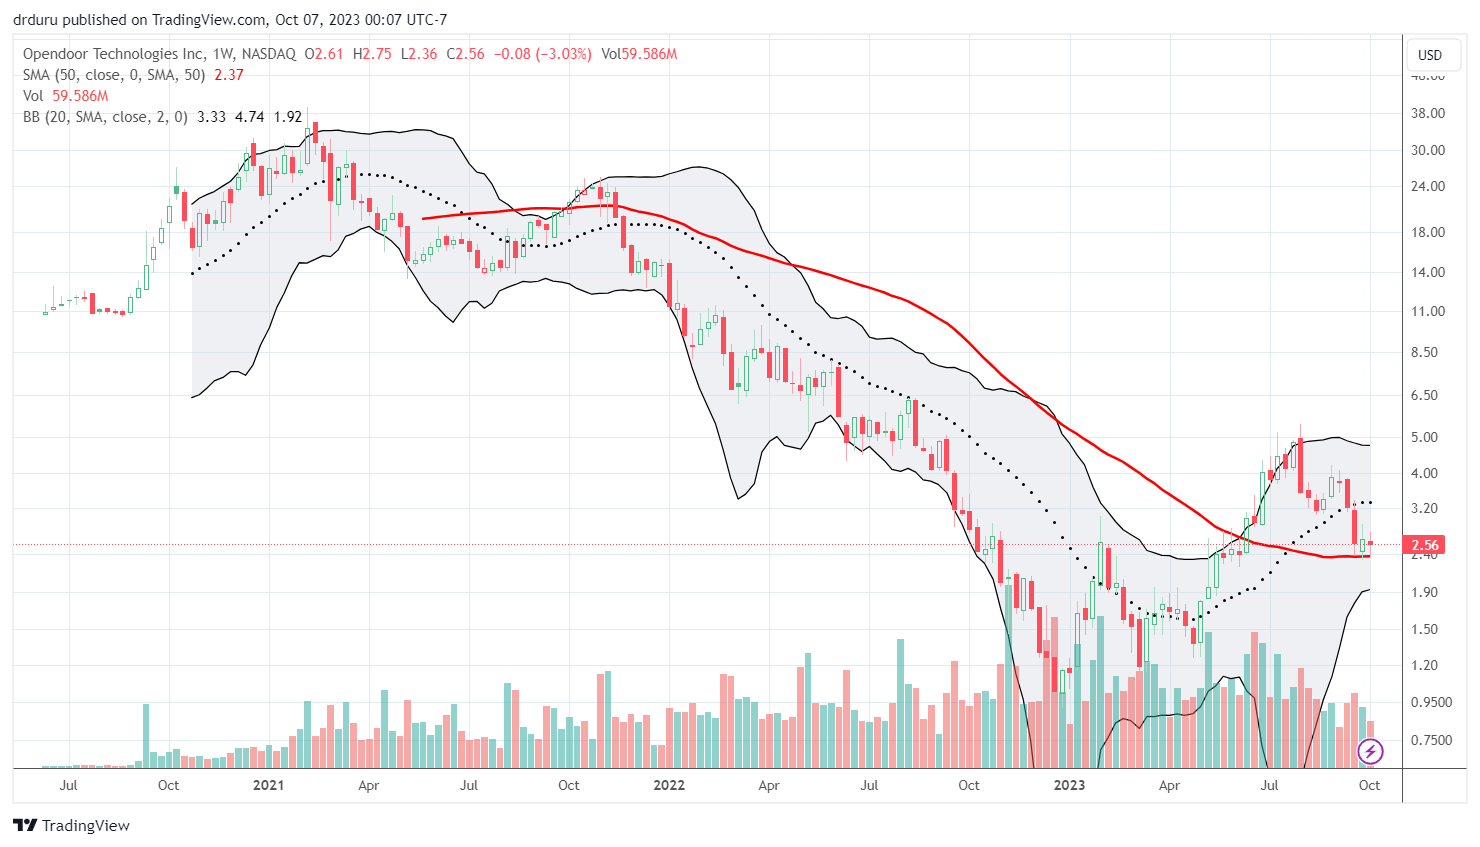
Roam’s website indicates the company handles the entire loan assumption process with the loan servicer. For its service, Roam collects a fee equal to 1% of the sales price. The company has a lot of pedigree from Opendoor Technologies (OPEN). Presumably they took lessons on what to do differently!
“While US real estate is the largest, and arguably most important, asset class – most real estate startups take an incrementalist approach and never break through the clutter. Our team takes a fresh perspective on the largest transaction in a consumer’s life, made possible by the largest dislocation in economic history at a time that begs for a fresh solution to affordability.”
Freddie Mac Housing Update
FreddieMac released its update on the economic outlook including a section on housing. The mortgage company has very muted expectations for next year. Thus, I cannot expect home builders to surpass this year’s highs in the near future.
“We expect mortgage rates to remain above 6% for the rest of the year which will keep sales volume low. While there is still demand in the housing market from a large cohort of Millennial first-time homebuyers, the shortage of housing will keep sales volume muted through this year. As more new homes hit the market and the mortgage rate lock-in effect wanes, we may see sales pick up next year, but any increases would be modest.
Our forecast for the next twelve months has house prices rising by 0.8% and an additional 0.9% over the following twelve months. We expect home price growth to continue due to a combination of housing supply shortage and demographic-driven demand relative to supply.”
A Shaky Foundation for Housing Insurance
Home builders have expanded more in areas at risk from natural disasters. Home buyers have perhaps become overly comfortable taking on these risks. The marketplace is starting to lean against this behavior as insurers drop coverage in markets where insurance premiums cannot cover the risk of loss from natural disasters. Those constraints come from a combination of regulatory limits and willingness/ability to pay by home buyers already burdened with higher property taxes, mortgage rates, and home prices.
The Economist’s “Money Talks” podcast examined the drivers behind the exodus from home insurance coverage. The punchline: Americans will soon be forced to change purchasing behaviors or face more and more market distortions with taxpayers in more stable areas paying for the risks taken on by people in disaster-prone areas.
Spotlight on Mortgage Rates
The Mortgage Bankers Association (MBA) reported a weekly decrease in mortgage applications 3 out of 4 weeks in September. These dynamics follow yet another year-over-year surge in mortgage applications in August for new homes. The 20.6% increase continues to reinforce the on-going shift in housing activity away from existing homes and toward new homes. Given the breakout in mortgage rates above the 7% level, a 23-year high, and a steep trend toward 8%, I still expect an imminent slowdown. The buyers who rushed to get mortgages over the summer are counting themselves fortunate!
![Source: Freddie Mac, 30-Year Fixed Rate Mortgage Average in the United States [MORTGAGE30US], retrieved from FRED, Federal Reserve Bank of St. Louis, October 6, 2023](https://drduru.com/onetwentytwo/wp-content/uploads/2023/10/20231006_30-year-fixed-rate-mortgage-average.png)
Be careful out there!
Full disclosure: long ITB