Stock Market Commentary:
Last week started strong with Goldman Sachs (GS). Analysts there looked beyond the coming Federal Reserve meeting and hiked their year-end price target for the S&P 500 to 4500. The index quickly moved half the remaining distance and opened the door for more price chasing by analysts before 2023 hits the halfway mark. The shifting price targets align with the upward adjustments for Q4 earnings expectations. Combined with the Federal Reserve’s upward revisions for the economy, there is clearly less fear and concern about a recession later this year.
All these positive dynamics open the potential for an overbought rally in the coming days and weeks. Bears have complained about market breadth all the way up and suddenly market breadth is now at the frontier of an overbought rally. A push higher from here leaves them clinging to worries about a bubble. A pullback from here will get them declaring victory…even before the uptrend actually ends.
The Stock Market Indices
The S&P 500 (SPY) gained 2.6% for the week although Friday’s small pullback ended a 6-day winning streak. The index is practically going parabolic as it follows its upper Bollinger Band (BB) higher and higher. The index closed the week at a 14-month high. The summer of loving stocks is well underway for the S&P 500 with a 4.9% gain since the close of trading before Memorial Day. The index looks ready for the frontier of an extended overbought rally.
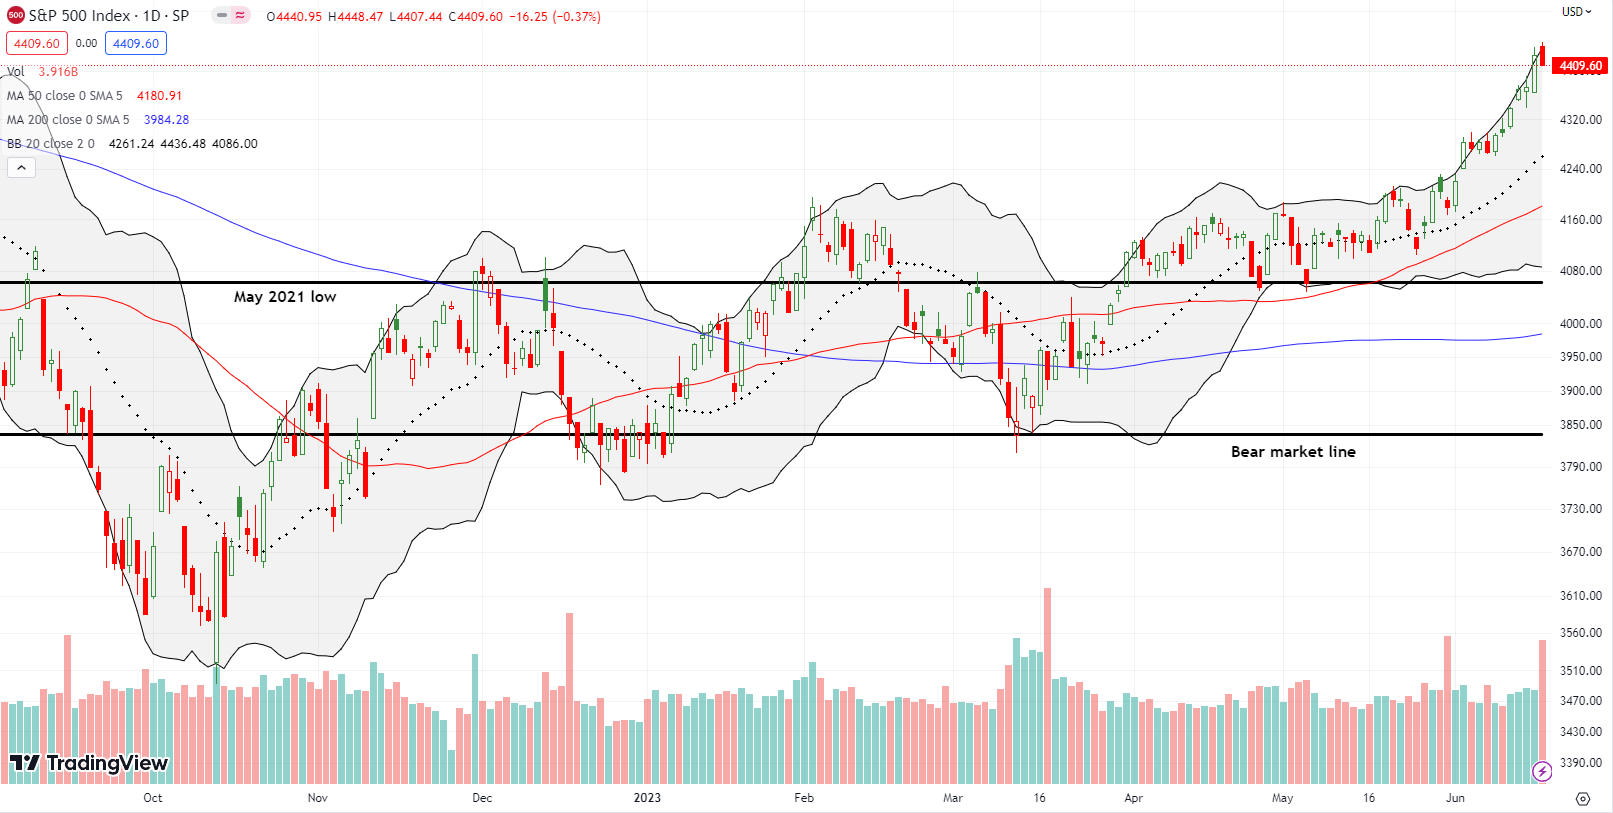
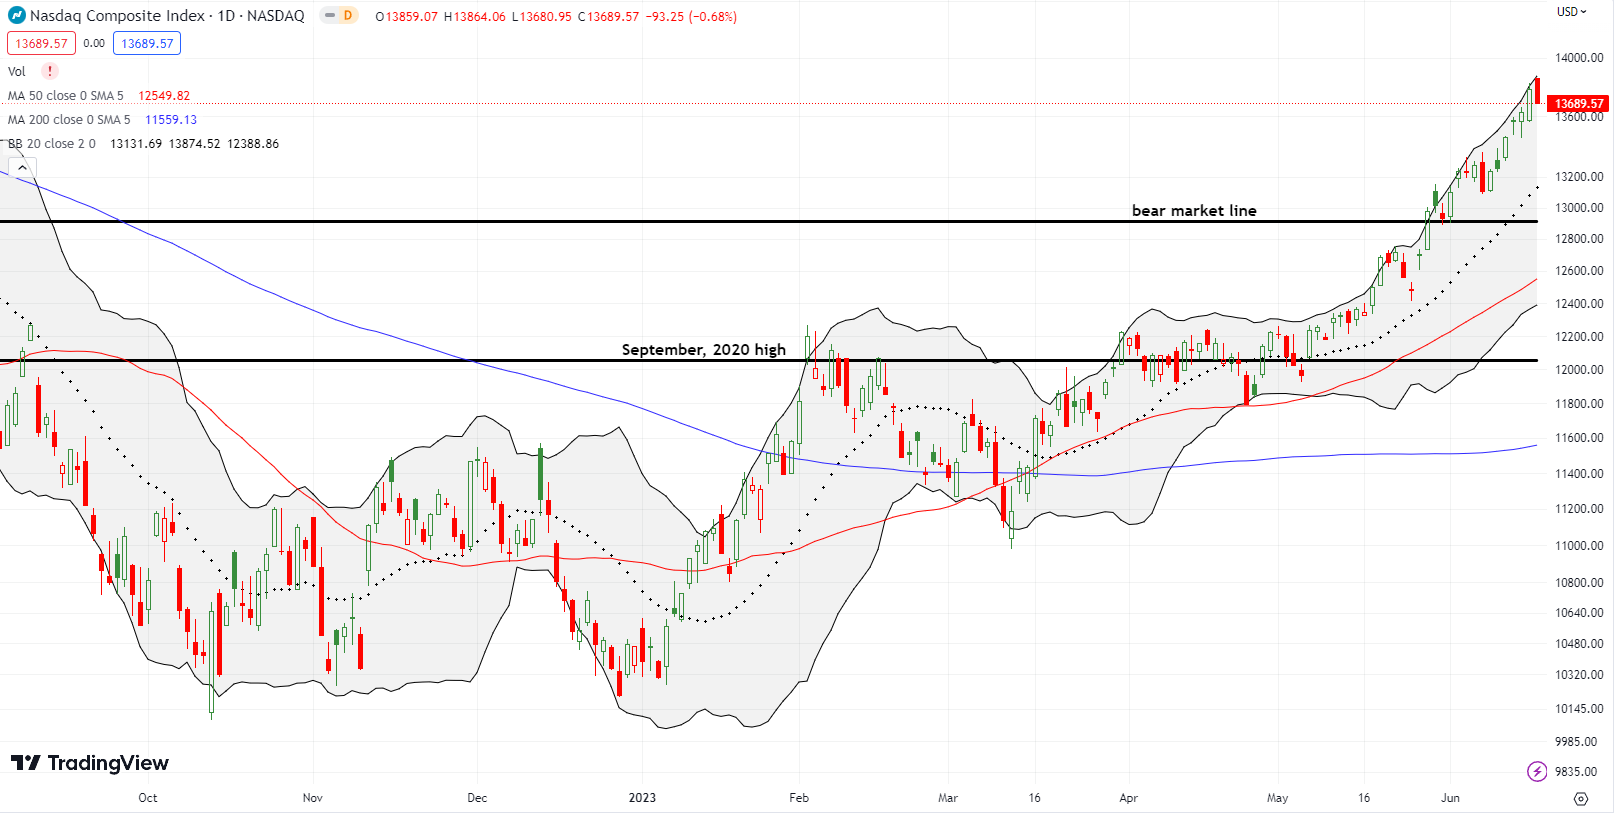
The NASDAQ (COMPQ) is up 5.5% for the summer of loving stocks. The tech-laden index looks even more ready for the frontier of overbought trading than the S&P 500 for the frontier of an overbought rally. The NASDAQ has levitated mainly just under its upper BB. Thus, it does not look quite as stretched. The NASDAQ grabbed a 3.3% gain for the week and closed at a 14-month high.
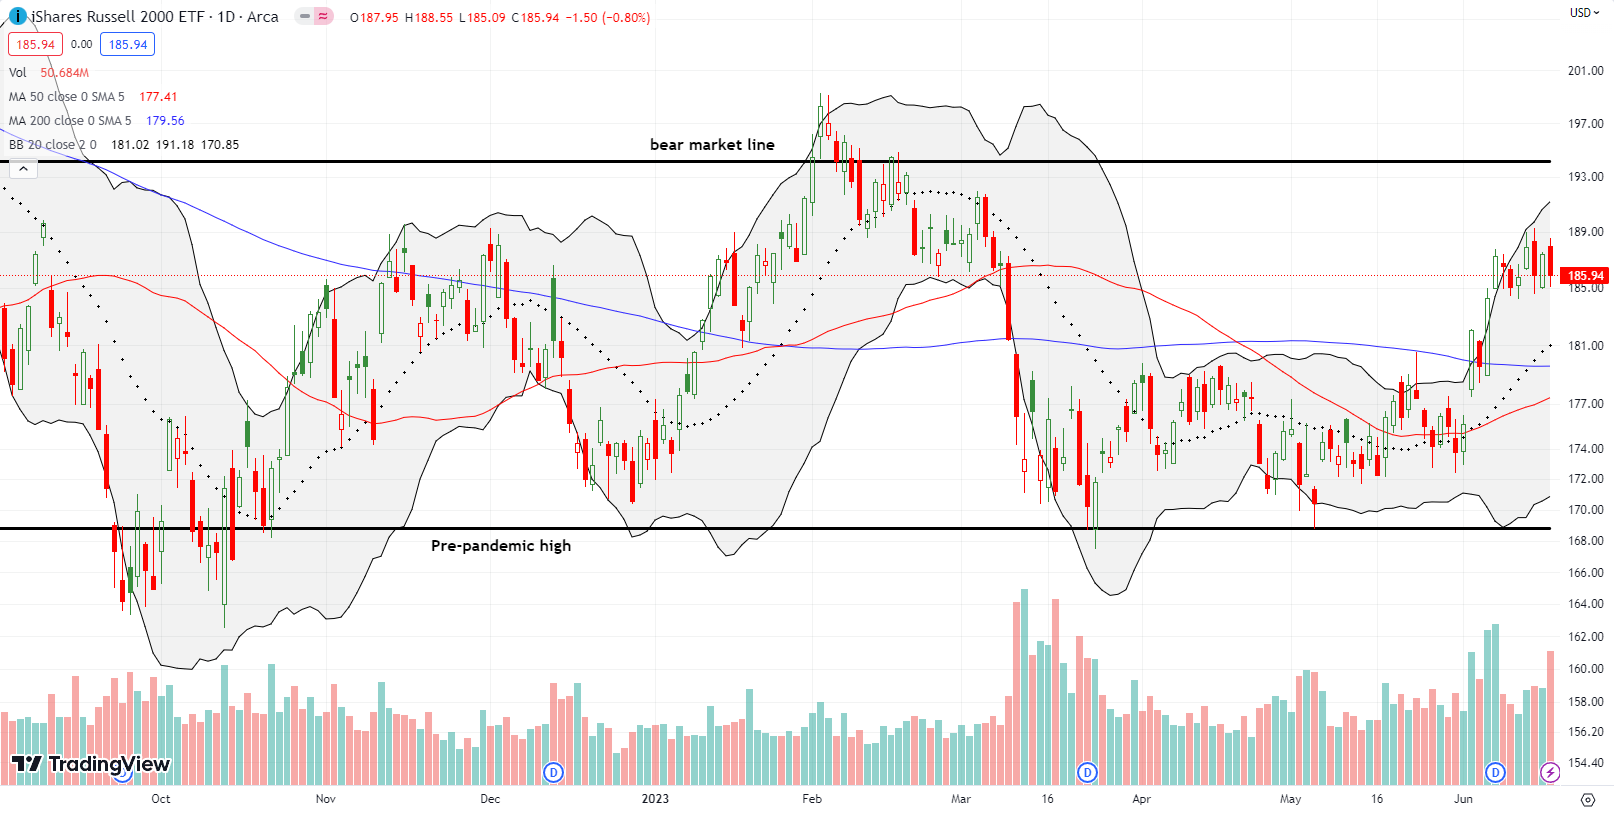
The iShares Russell 2000 ETF (IWM) scraped out a 0.5% gain for the week. A trading range has developed since the previous week’s breakout. I am guessing holders who were surprised by March’s plunge are using current prices to close out positions in relief. After these motivated sellers finish, IWM will likely gain the most from crossing the frontier of overbought trading. The next challenge of the bear market line could precede a longer lasting breakout.
Stock Market Volatility
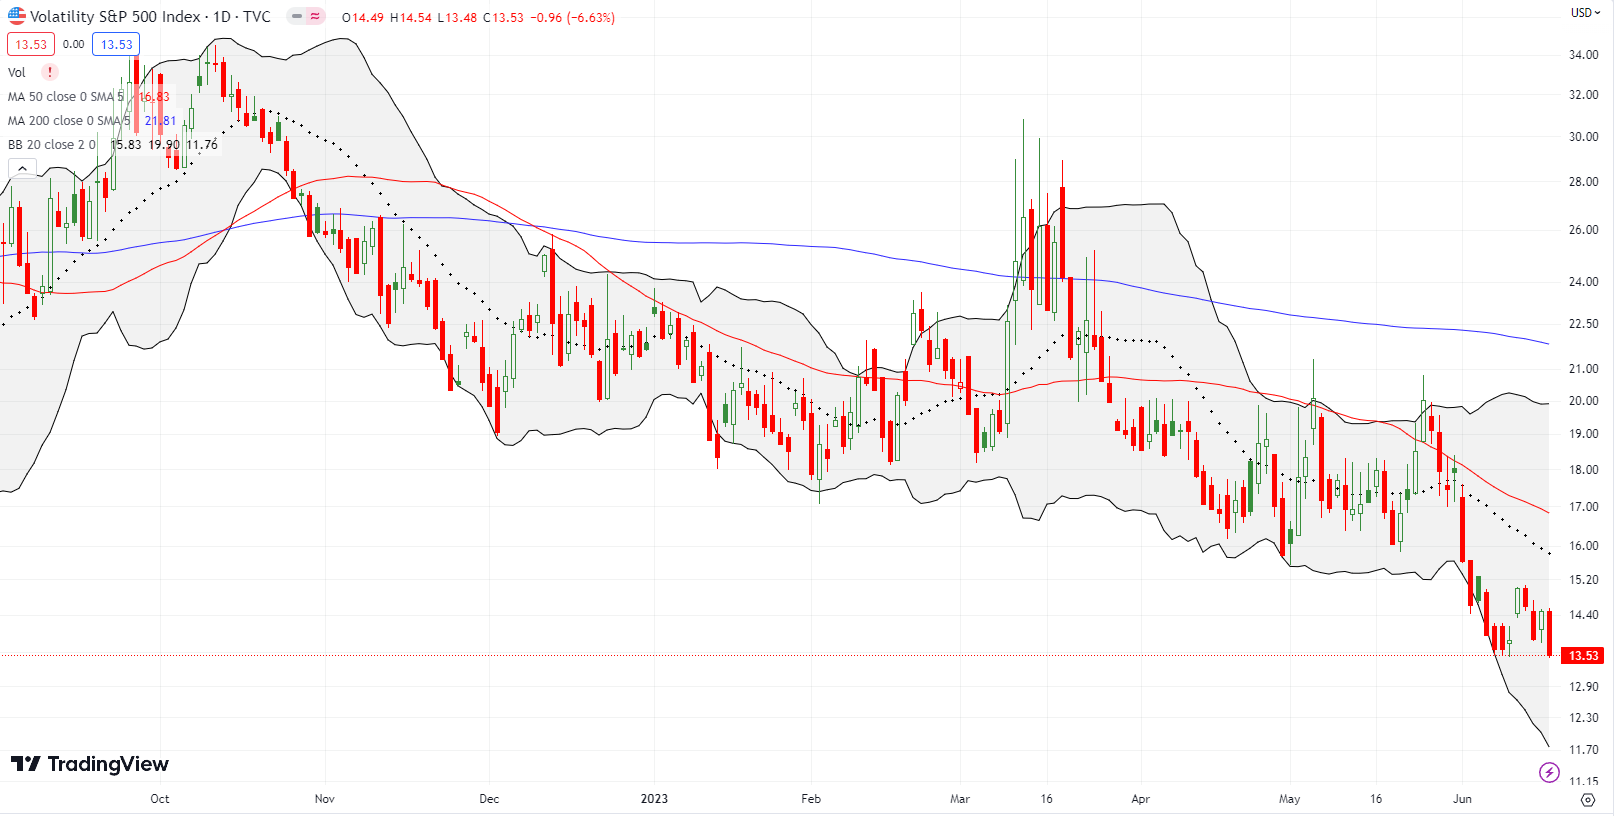
The volatility index (VIX) lost 5% in the wake of the Fed. The VIX reversed almost all those losses the next day despite a strong market rally day. The VIX plunged on Friday to a new 41-month closing low despite pullbacks across the major indices. The volatility index still looks broken, but the overall message is clear: the VIX wants to keep moving lower. Such a bias fully endorses and supports crossing the frontier for an overbought rally. This kind of complacency is just the right fuel for buyers to press on despite stretched trading conditions.
The Short-Term Trading Call at the Frontier of Overbought Trading
- AT50 (MMFI) = 66.8% of stocks are trading above their respective 50-day moving averages
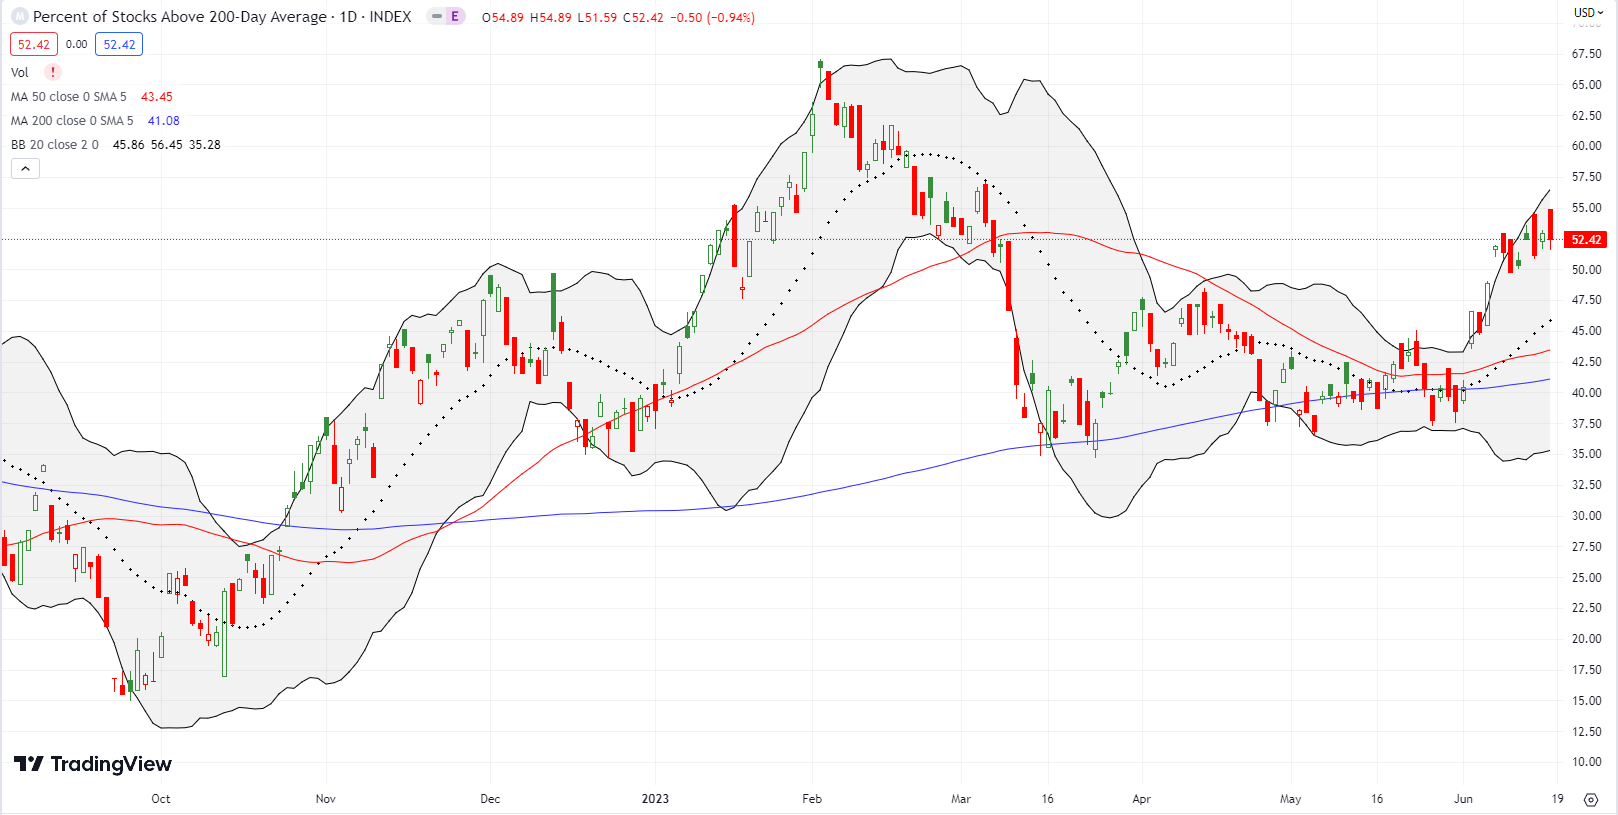
- AT200 (MMTH) = 52.4% of stocks are trading above their respective 200-day moving averages
- Short-term Trading Call: cautiously bullish
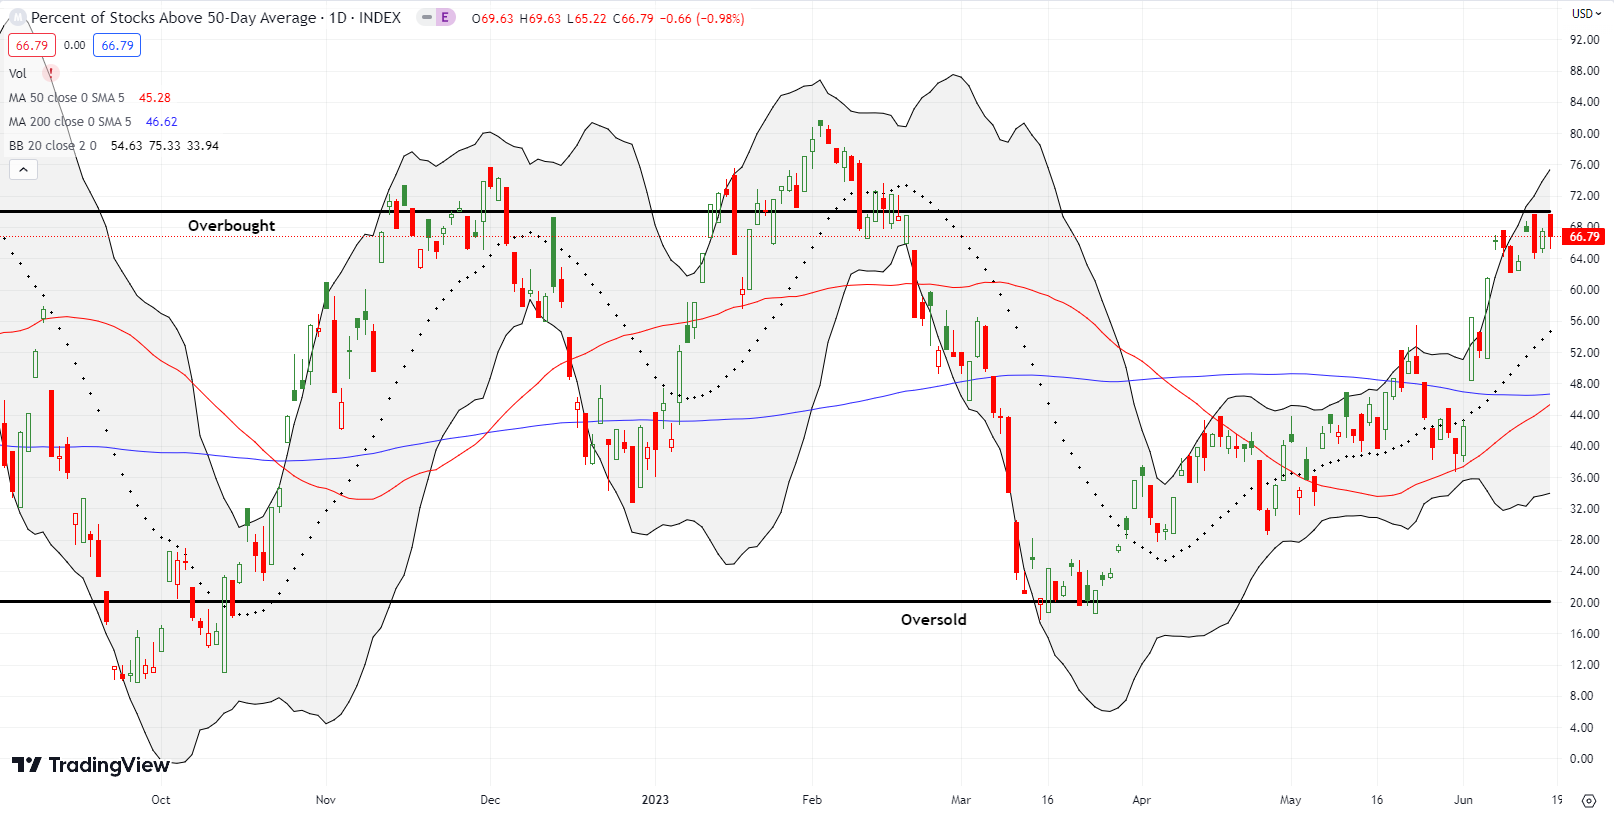
AT50 (MMFI), the percentage of stocks trading above their respective 50DMAs, closed the week at 66.8% after opening at 69.6%. This tease at the frontier of overbought trading (the threshold of 70%) was the second of the last three trading days. I will consider a move by my favorite technical indicator across the frontier of overbought trading as a further confirmation for the summer of loving stocks. I definitely prefer to hold onto my cautiously bullish short-term trading call. However, if AT50 prints two lower closes below the 70% threshold defining overbought conditions, I will flip cautiously bearish by rule. Note I did not trigger the rule a week ago because AT50 did not seem to get close enough to the overbought threshold. I made a judgment call that paid off. I still think any near-term pullbacks will find firm support at the uptrending 20DMAs and/or 50DMAs.
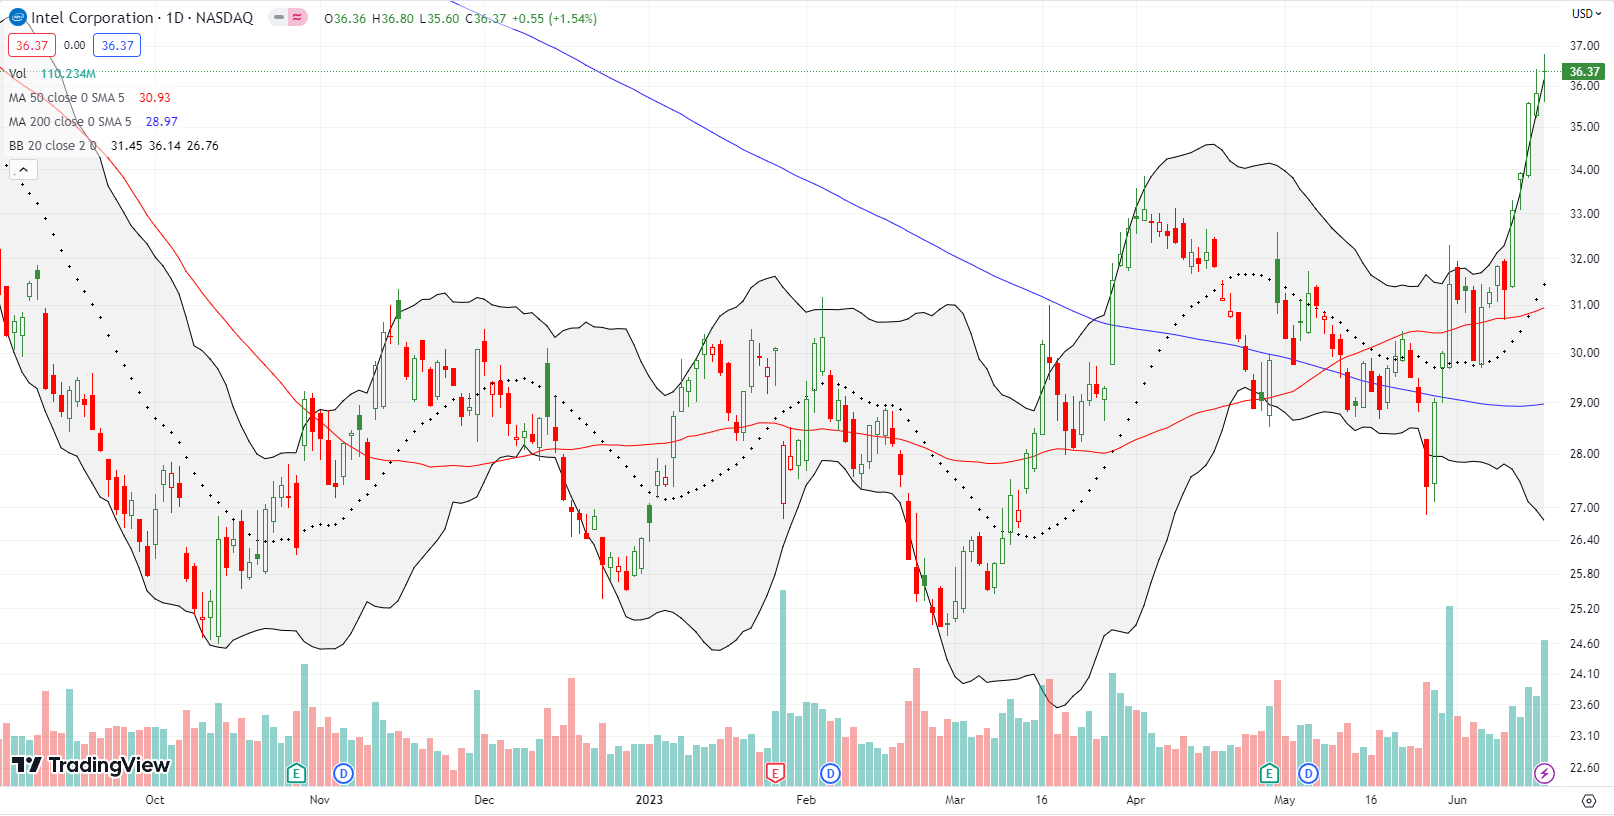
Readers know I typically buy call options in Intel Corporation (INTC) between earnings. However, since the blow-up in January I have hesitated. That wariness has caused me to miss some fantastic between earnings trades! Last month’s plunge below 200DMA support really threw me for a loop. Now all I can do is wait for the next pullback. INTC is clearly on a comeback trail with this breakout above the consolidation period in place since October. This move makes the most sense as a part of the generative AI trade.
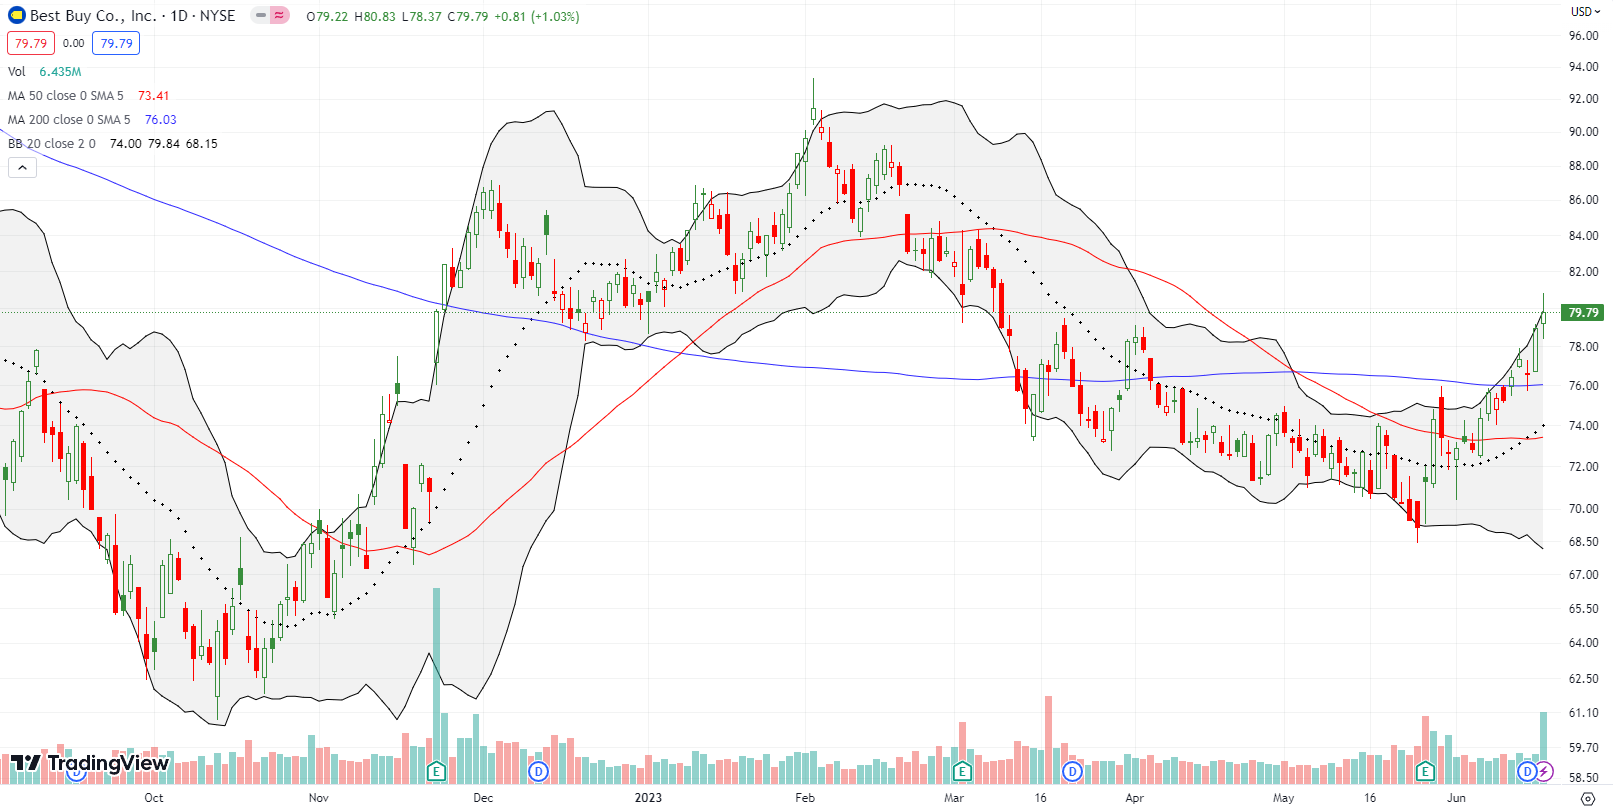
Best Buy (BBY) is one of an increasing number of stocks defying expectations for a recession later this year. (Do stocks really discount events 6-12 months out? Yes, when they agree with the observer’s expectations!). Last week’s confirmed 200DMA breakout positions BBY to eventually challenge its high for the year. I added an August call spread to shares.
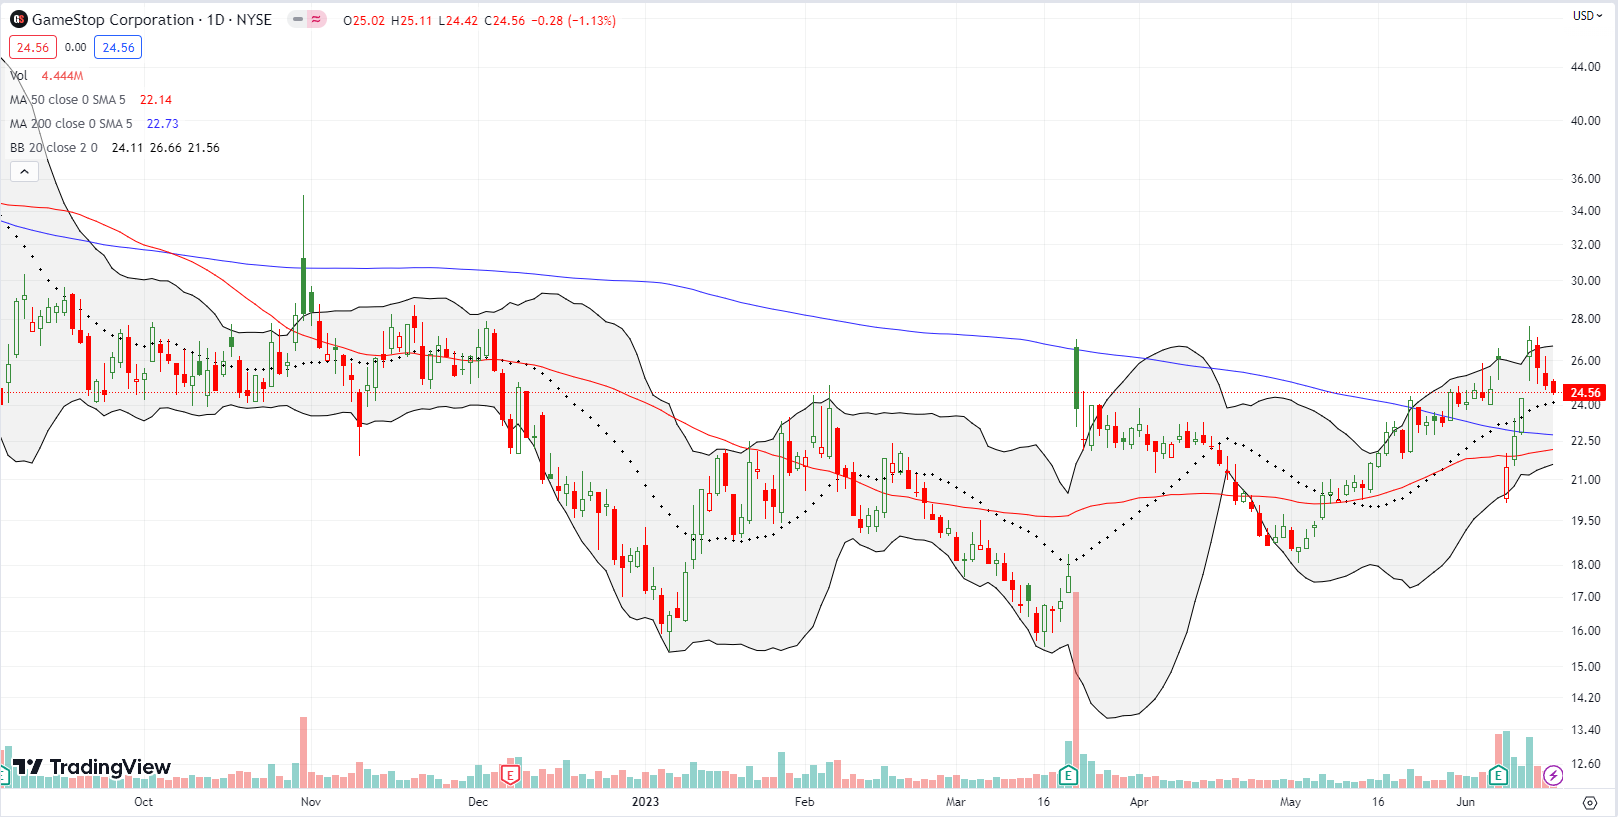
GameStop Corporation (GME) is the latest candidate for what I call the “they know nothing!” stock market reactions. GME gapped down post-earnings on June 8th. Buyers stepped into the gap but stopped short of 50DMA resistance. The rebound continued until the post-earnings gap filled. Now, the stock is trickling back down to the next technical test at 20DMA support. Back in March, GME soared 35.2% post-earnings but faded from 200DMA resistance. Over the next 6 weeks, the stock drifted lower until it almost reversed the entire post-earnings gain. Clearly, no one knows what to make of GME’s earnings. The stock looks like a trader’s plaything in a know-nothing haze of trigger happy reactions to stock news.
Oracle Corporation (ORCL) is staying consistent. Very “quietly” ORCL has trended higher since its October low. A post-earnings 6.0% gain has triggered a near parabolic move for ORCL. The stock now sits at fresh all-time highs. When you get a chance, check out the long-term chart dating back at least to 2002. I can only shake my head and lament because a former colleague from the 1990s always insisted that I should buy and hold ORCL, but I just was not impressed with the company. Silly me. At least I eventually listened to her about the importance of buying and owning a home!
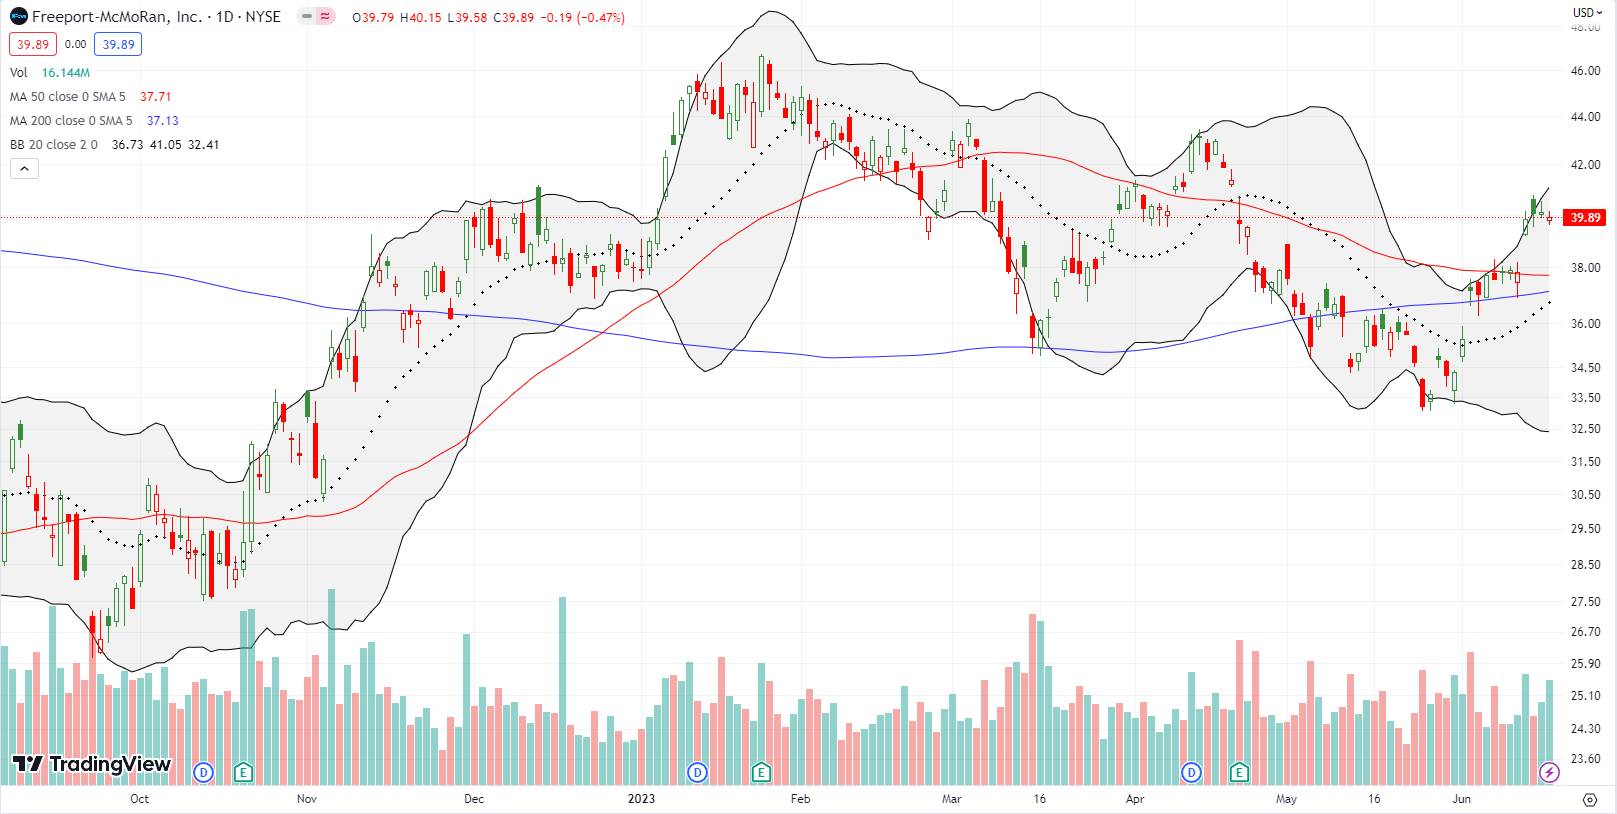
Bears have looked at the commodity complex for confirmation of impending economic doom. Yet, all of the sudden, that leg of the stool broke down as commodity stocks broke out last week. Freeport-McMoRan (FCX_ confirmed 200DMA support with a 5.3% gain and gap above its 50DMA. FCX confirmed its 50DMA breakout but needs to conquer the April high to end the downtrend. In the meantime, bears could next complain about the fresh inflationary pressures signaled by the likes of Dr. Copper.
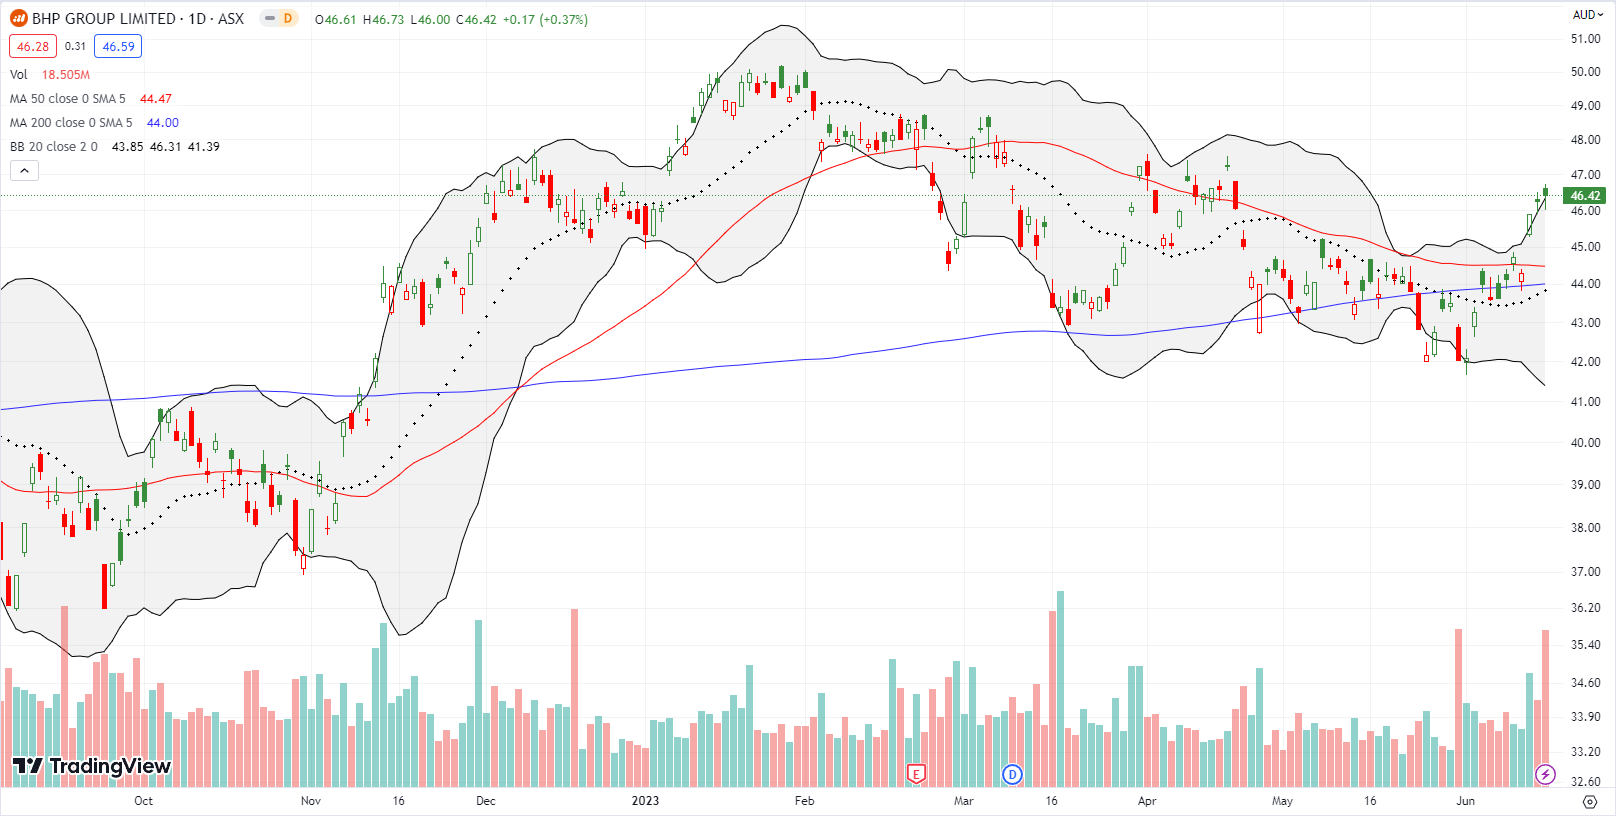
Diversified commodities player BHP Group Limited (BHP) looks even better than FCX. The chart below is from the Australian Sock Exchange (ASX) to show how BHP is already challenging its previous highs. Like FCX, the 200DMA is trending higher, so I want to buy dips from here.
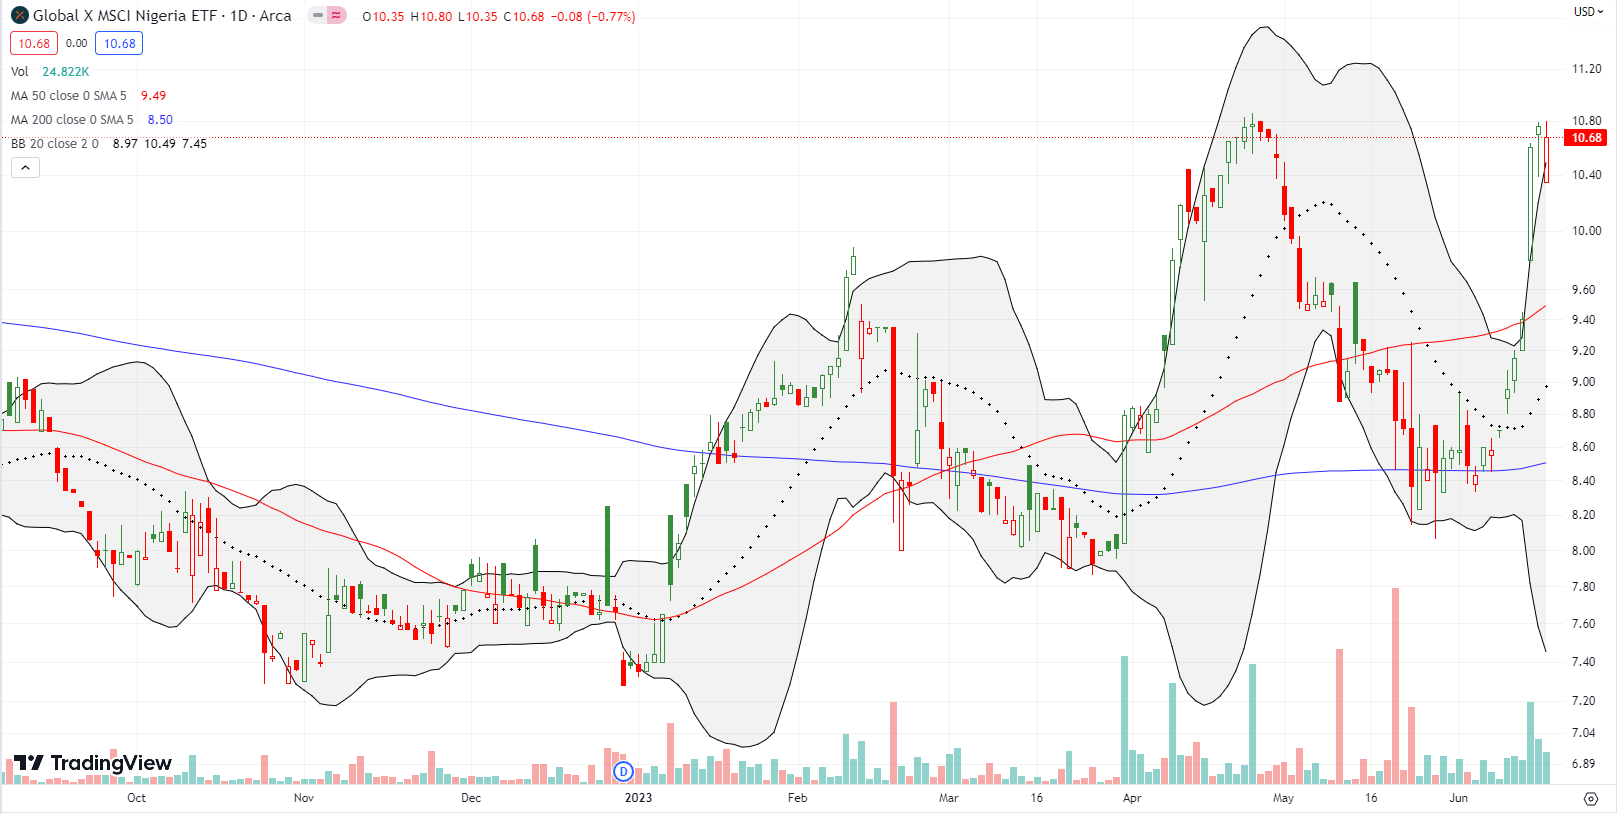
Global X MSCI Nigeria ETF (NGE) is my surprise of the week, maybe the year. NGE has been on a roller coaster ride through February presidential elections in Nigeria. The latest surge has come in the wake of the new President’s inauguration, the end of gasoline subsidies, and now liberalization of foreign exchange that promises to align the naira closer to black market rates. I am looking to buy the dips from here as the action in 2023 makes NGE look like it has finally generated a bottom.
Be careful out there!
Footnotes
Subscribe for free to get email notifications of future posts!
“Above the 50” (AT50) uses the percentage of stocks trading above their respective 50-day moving averages (DMAs) to measure breadth in the stock market. Breadth defines the distribution of participation in a rally or sell-off. As a result, AT50 identifies extremes in market sentiment that are likely to reverse. Above the 50 is my alternative name for “MMFI” which is a symbol TradingView.com and other chart vendors use for this breadth indicator. Learn more about AT50 on my Market Breadth Resource Page. AT200, or MMTH, measures the percentage of stocks trading above their respective 200DMAs.
Active AT50 (MMFI) periods: Day #54 over 20%, Day #28 over 30%, Day #25 over 40%, Day #11 over 50%, Day #8 over 60%, Day #79 under 70%
Source for charts unless otherwise noted: TradingView.com
Full disclosure: long QQQ call spread, long IWM call spread, long BBY shares and call spread
FOLLOW Dr. Duru’s commentary on financial markets via StockTwits, Twitter, and even Instagram!
*Charting notes: Stock prices are not adjusted for dividends. Candlestick charts use hollow bodies: open candles indicate a close higher than the open, filled candles indicate an open higher than the close.


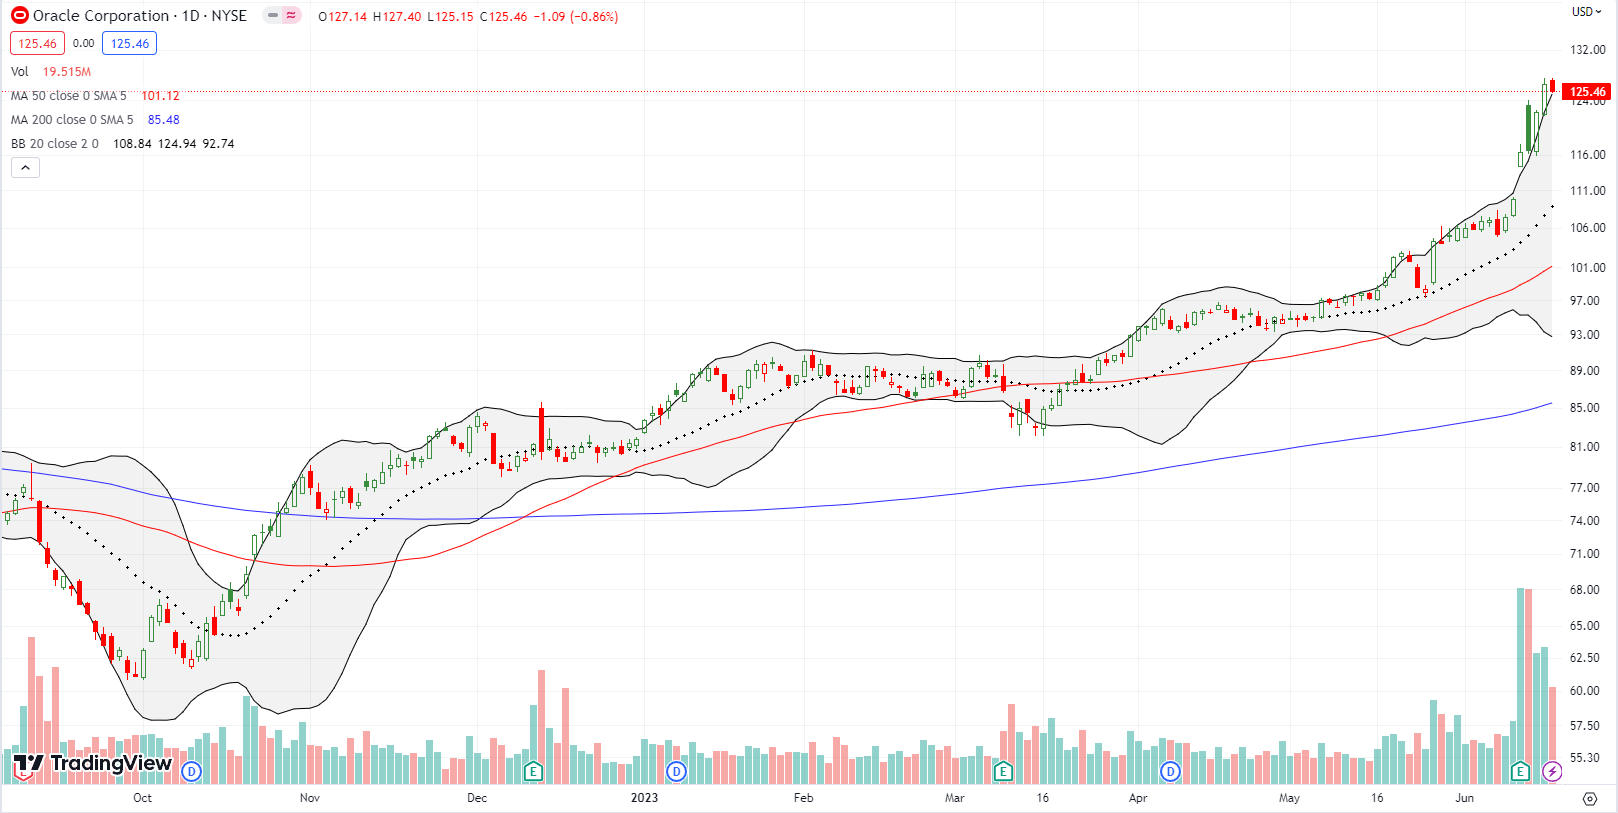
• ORCL: impressive chart (although not nearly as impressive as AAPL’s), but also note that someone who bought ORCL at the top in 2002 had to wait 20 years to get their money back.
• Intel: the USA’s CHIPs Act inspired/provoked multiple other countries to offer Intel (and some other US semiconductor companies) subsidies in return for building fabrication plants in their countries. Besides the USA, Intel has made huge deals with Germany and Israel. We won’t know for ~5 years whether Intel will be able to make those plants make money, but it sure doesn’t hurt to have sovereign-sized muscles pushing for you. (I haven’t checked, there may still be time to buy the stocks of the companies who make the fab-plant equipment Intel will be buying. Well-known examples are ASML, AMAT, LRCX, KLAC, but there are dozens more.
• Commodities (particularly Australian companies): China is beginning to apply some stimulus to try to kick-start their stumbling economy.
ORCL: True! I conveniently smoothed that out. 🙂
INTC: I have tried to buy into AMAT and have been shaken out. Maybe I can buy and hold after the next sell-off. Speaking of sell-offs, YIKES! What a fresh plunge in INTC!
Commodities: Yes, Chinese stimulus is distorting markets all over again. It’s helped the Australian dollar too!