Stock Market Commentary:
On a weekly basis, the stock market seems to flip its abiding theme. One week after I accused the stock market of sleepwalking, buyers roused the major indices out of their slumber with a new and sudden display of strength. A 13.9% post-earnings surge from Meta Platforms, Inc (META) seemed to set the tone and ignite animal spirits even as the crisis in regional banks took another turn for the worse with First Republic Bank (FRC) freshly collapsing. The major indices started April leaving the regional banks behind and ended the month in a similar fashion. The end result is a revived stock market that dares the Federal Reserve to remain hawkish in its upcoming decision on monetary policy.
The showdown could send sparks flying especially with the GDP report for Q1 demonstrating persistent and sticky signs of inflation. The Fed’s favorite measure for inflation, the core PCE (Personal Consumption Expenditure), jumped to 4.9% from the 4.4% in Q4 despite a slowing in growth from 2.6% to 1.1% (stagflation anyone?). The Fed fund futures are holding the line at one more rate hike for this cycle of monetary tightening.
The Stock Market Indices
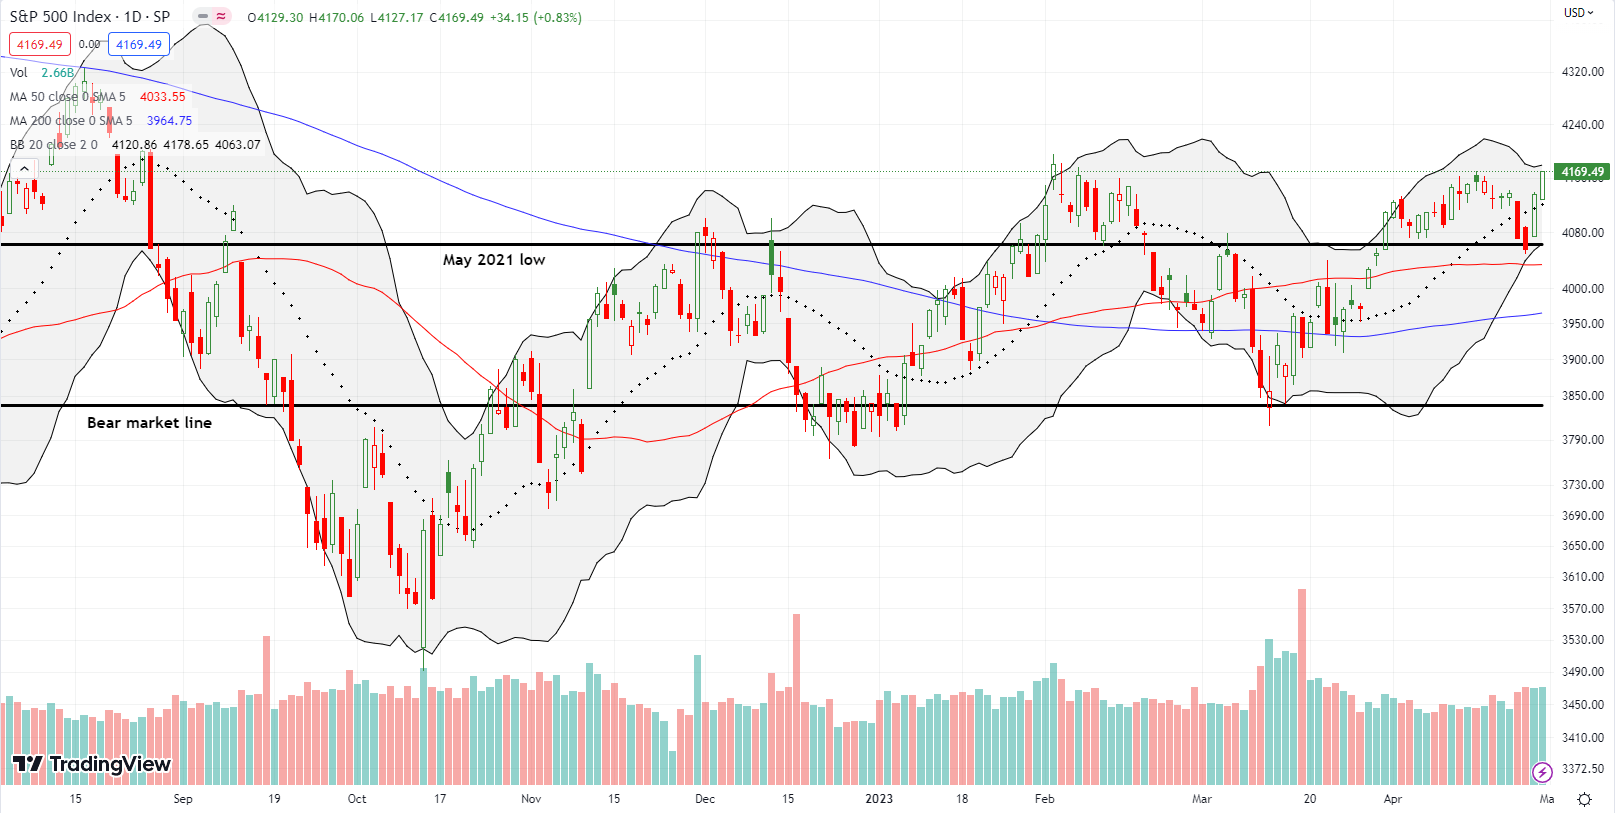
The S&P 500 (SPY) looked like it confirmed the top for the year with a 2-day pullback into and through the May, 2021 low. Buyers jumped in from there and avoided a test of support at the 50-day moving average (DMA) (red line below). Two days of buying sent the index within a few points of the February high. I am holding a SPY put spread. My decision to hold after the pullback cost me a small profit. With a May monthly expiration, I am keeping the position as a hedge.
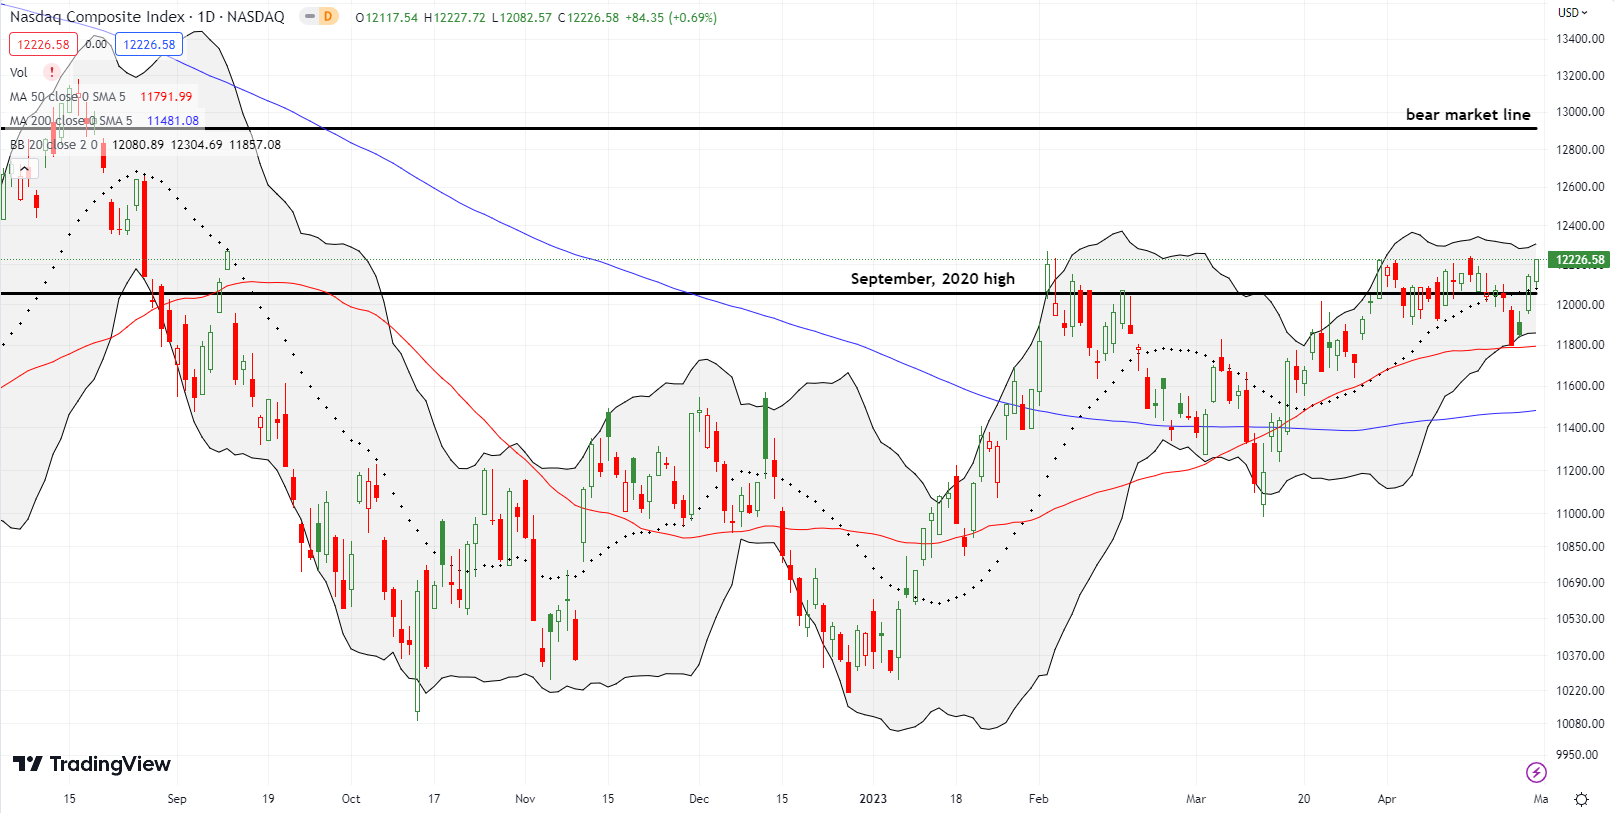
The NASDAQ (COMPQ) decided to test its 50DMA support. As a result, the subsequent rebound is more convincing than the bounce for the S&P 500. The tech laden index even closed at a new marginal high for the year that in turn challenges the high from September, 2022. Overall, April was a month of pivoting around the September, 2020 high.
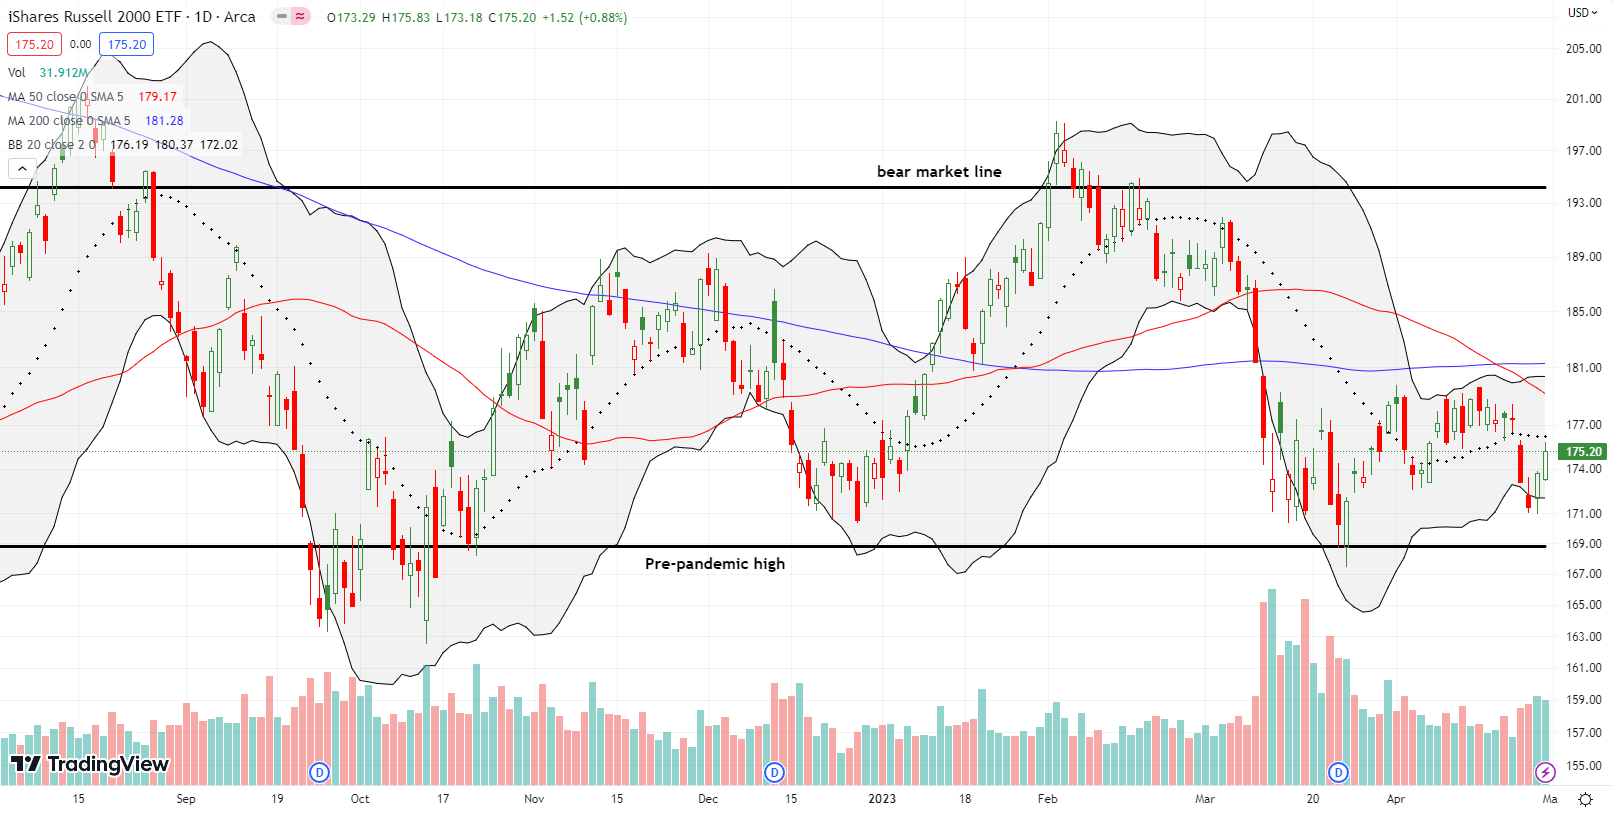
The iShares Russell 2000 ETF (IWM) is the big laggard. The 2-day display of strength for the ETF of small cap stocks only managed to achieve a return to 20DMA resistance.
Stock Market Volatility
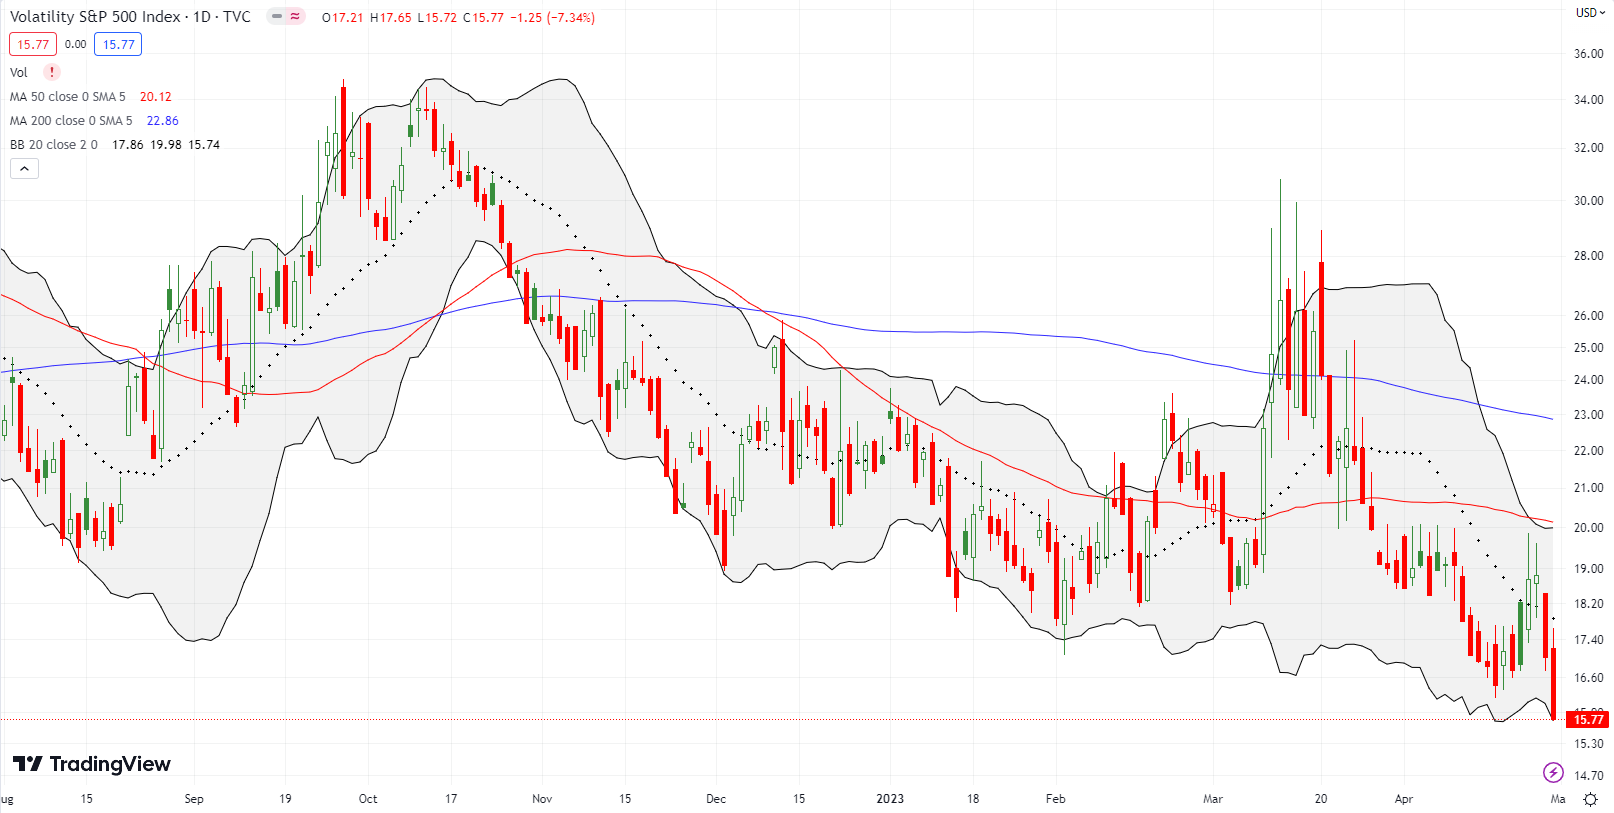
The volatility index (VIX) rose from its slumber during the first three trading days of the week. However, almost like clockwork, faders stepped in at the critical 20 level. The reversal was sharp and swift. The VIX closed the week at a fresh 18-month low, right where the NASDAQ printed its all-time high. I still do not believe these complacent, sub 20 levels are sustainable. Then again, the market has shown incredible resilience throughout these latter stages of the Fed’s monetary tightening.
The Short-Term Trading Call With A Sudden Display of Strength
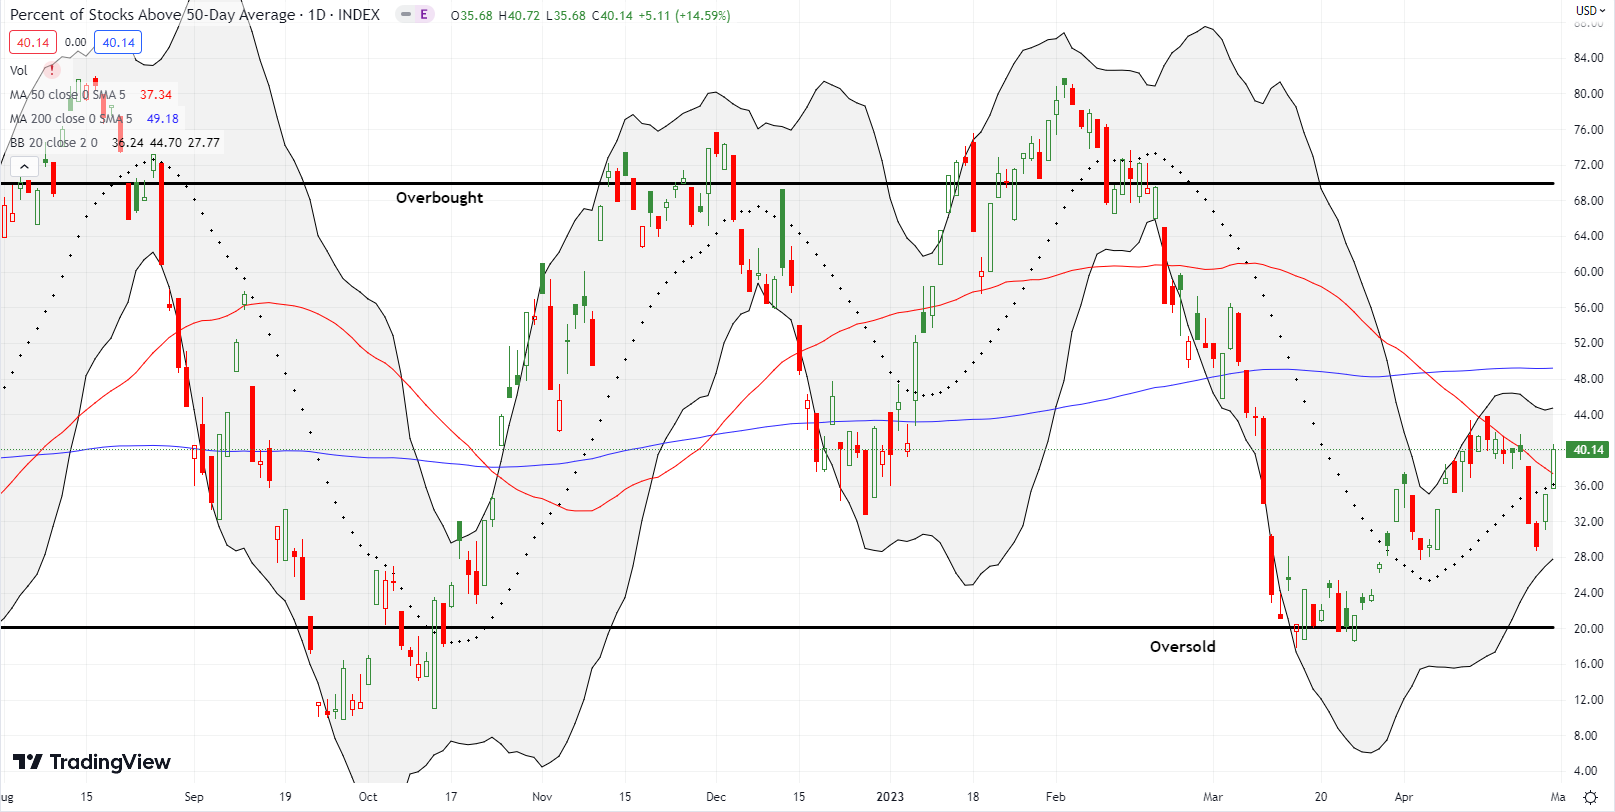
- AT50 (MMFI) = 40.1% of stocks are trading above their respective 50-day moving averages
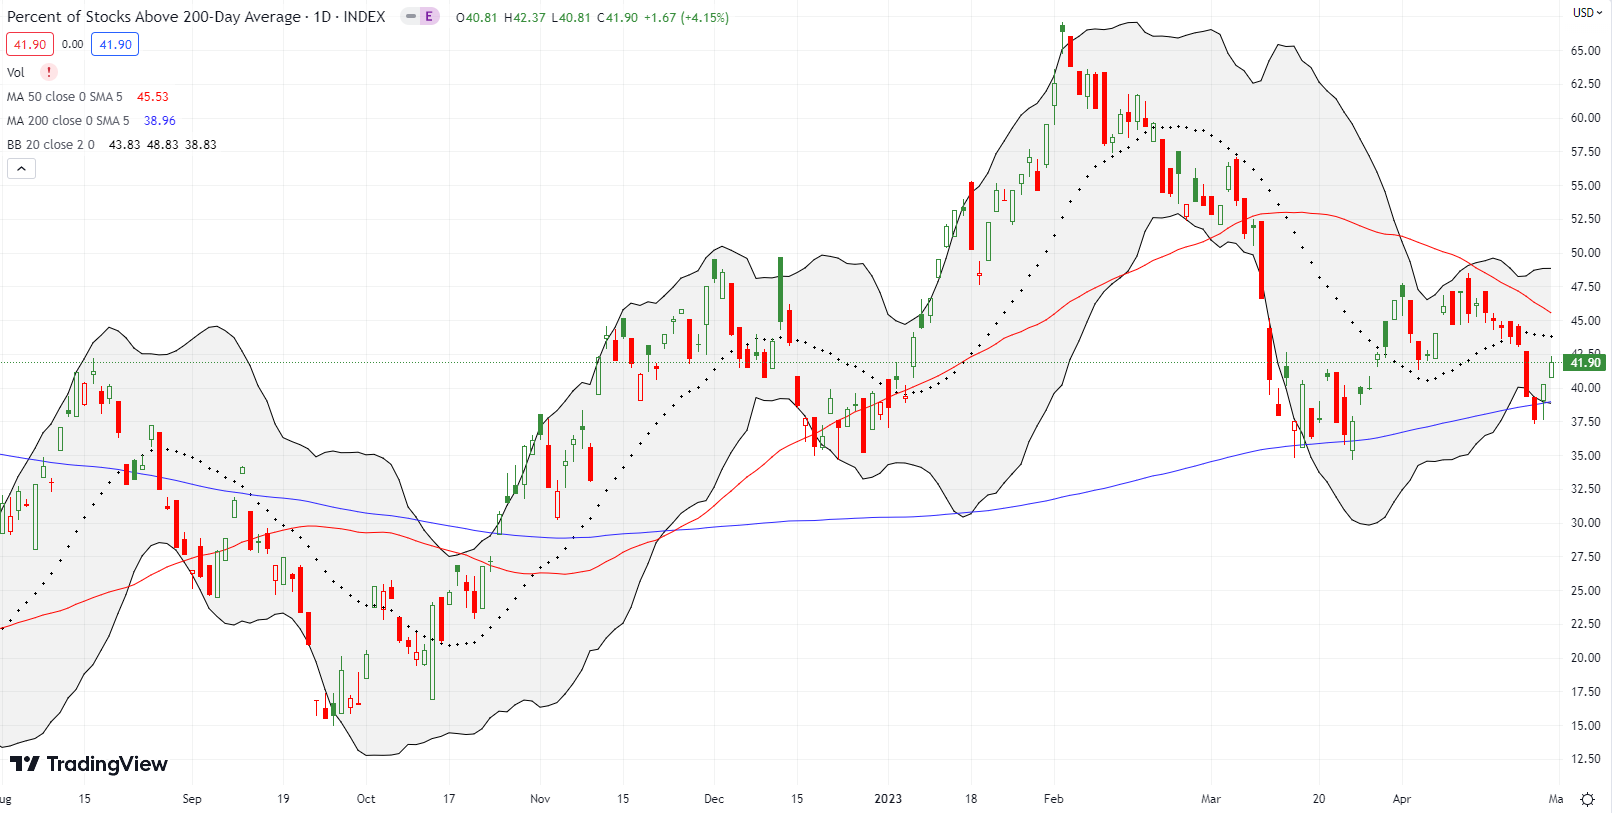
- AT200 (MMTH) = 41.9% of stocks are trading above their respective 200-day moving averages
- Short-term Trading Call: neutral
AT50 (MMFI), the percentage of stocks trading above their respective 50DMAs, ended the week at 40.1%. Along the way, my favorite technical indicator hit a low of 29.2%. Before I could even think about what to buy during a visit to oversold territory (below 20%), buyers rushed in and pushed AT50 sharply higher for two days. This sudden display of strength was impressive and demonstrated the potential power of “close enough” to oversold conditions. This part of the market breadth cycle is all about big cap tech. Per an article from Yahoo Finance, Apple (AAPL) and Microsoft (MSFT) lead the way with a record 14% share of weighting in the S&P 500: “Apple and Microsoft alone have added more than $1 trillion in combined market value in 2023, nearly half of the gains for the entire S&P 500.”
While market breadth ended the week flat on balance thanks to the late display of strength, a number of stocks fell behind. The chart review below examines some interesting setbacks and disasters as well as glimmers of fresh hope.
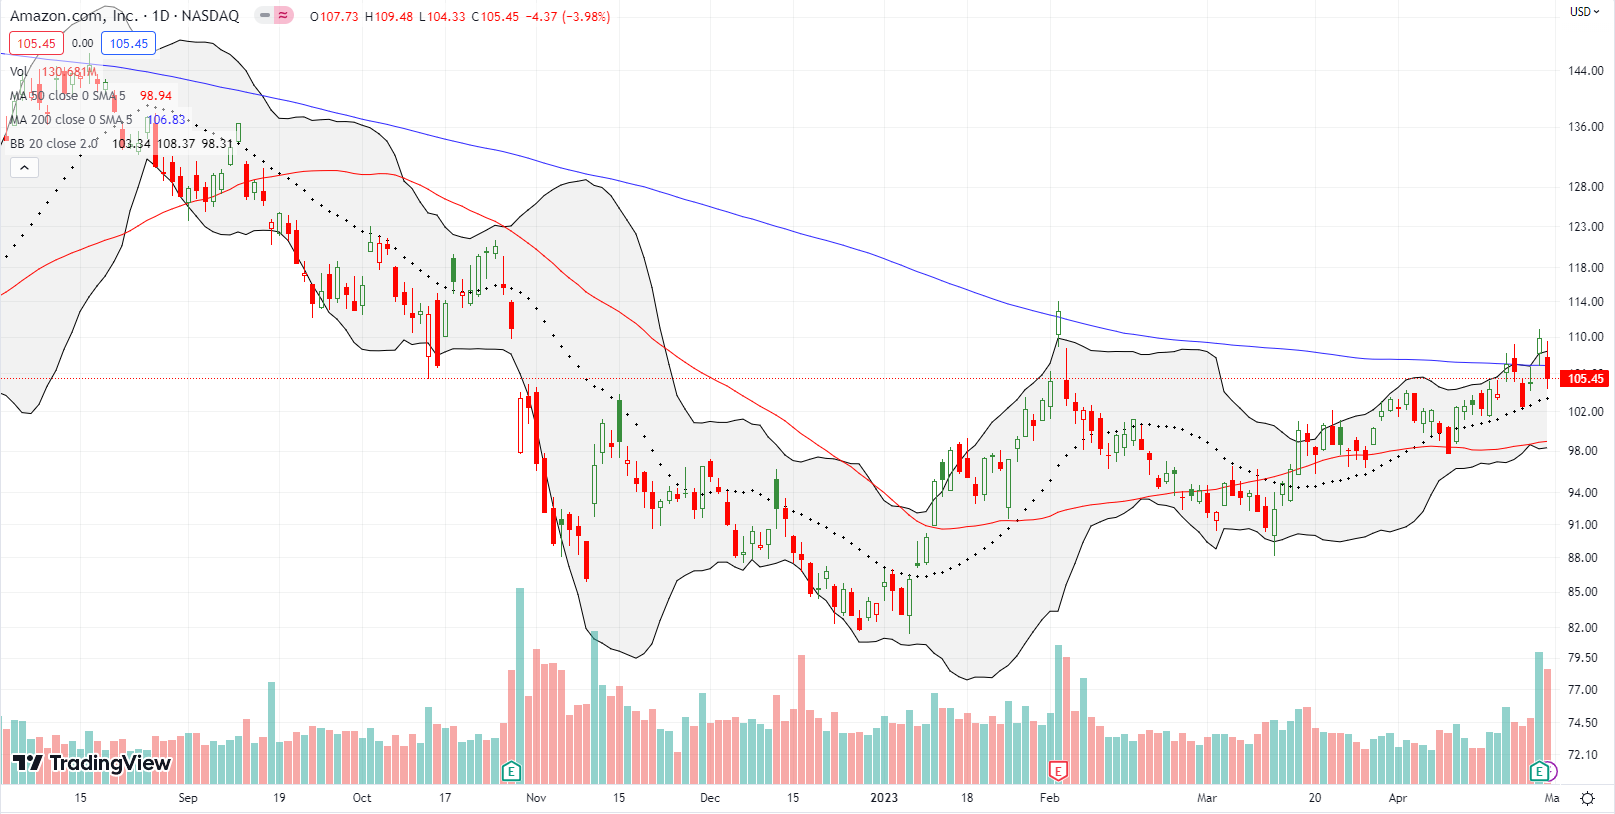
Amazon.com (AMZN) soared 8% in after hours trading in response to reported earnings. Guidance during the conference call flattened out most of those gains. AMZN closed the following day down 4.0%. The loss left behind a fakeout above 200DMA resistance (the bluish line). Yet, uptrending 20DMA support (the dashed line) is still working in AMZN’s favor. I want to see what happens on the next test of that support. A full reversal of the post-earnings loss would be very bullish for AMZN.
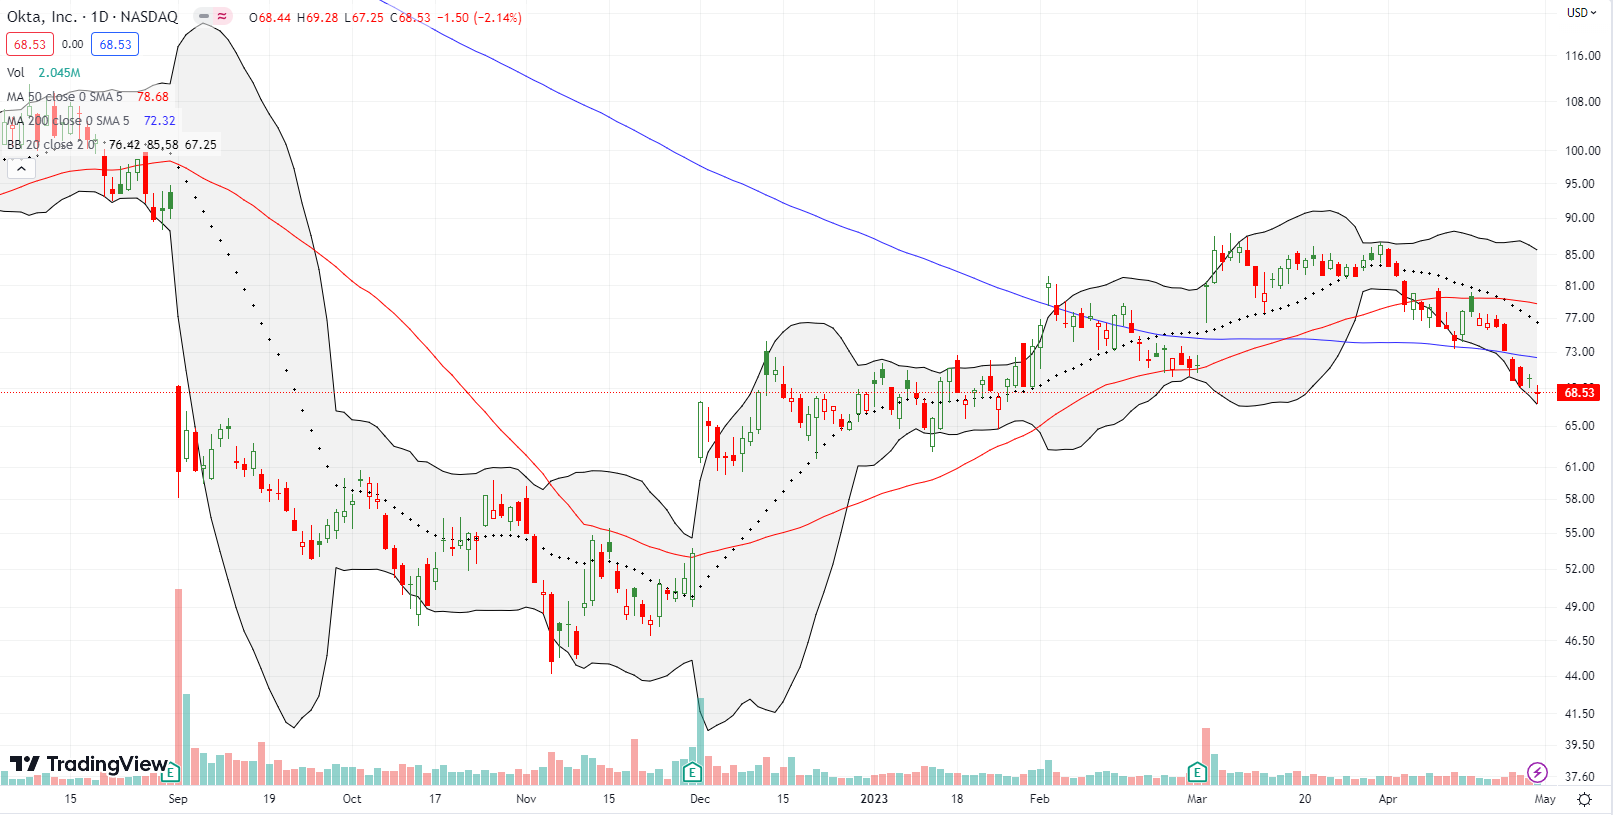
Cybersecurity software company Okta Inc (OKTA) seemed to continue its recovery with March’s 13.3% post-earnings surge. OKTA was even close to a full reversal of last September’s post-earnings disaster. Unfortunately, momentum immediately fizzled out. After a lot of meandering, sellers took control in April. Last week, OKTA finished reversing all its post-earnings gains. Sellers confirmed a 200DMA breakdown and look set to keep pressing on the current downtrend.
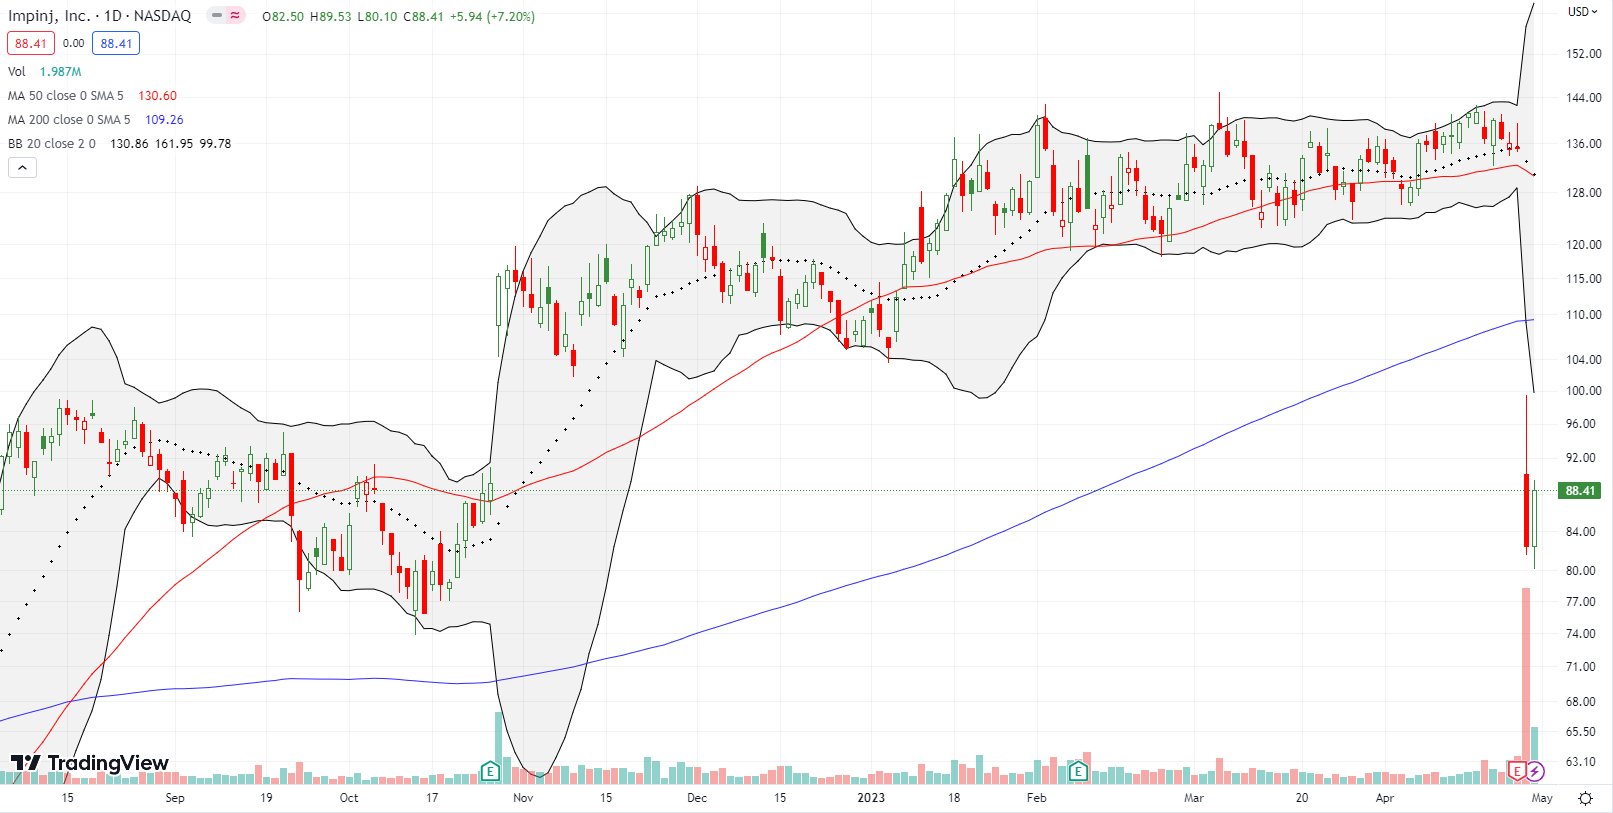
I noticed the grinding uptrend in Impinj Inc (PI) a week too early! I made a disastrous mistake in failing to notice an upcoming earnings event. That calamitous event delivered a 39.1% post-earnings blow-up. The decline took PI right past its October post-earnings gap up and close to the October lows. This kind of price action reminds me how clueless the market can be about the financial health and performance of an individual stock. If markets were truly efficient, a stock like PI should not and would not swing this wildly between nearby earnings events. Of course, maybe in cases like these, management is particularly “bad” at communicating and/or understanding the true prospects for the company.
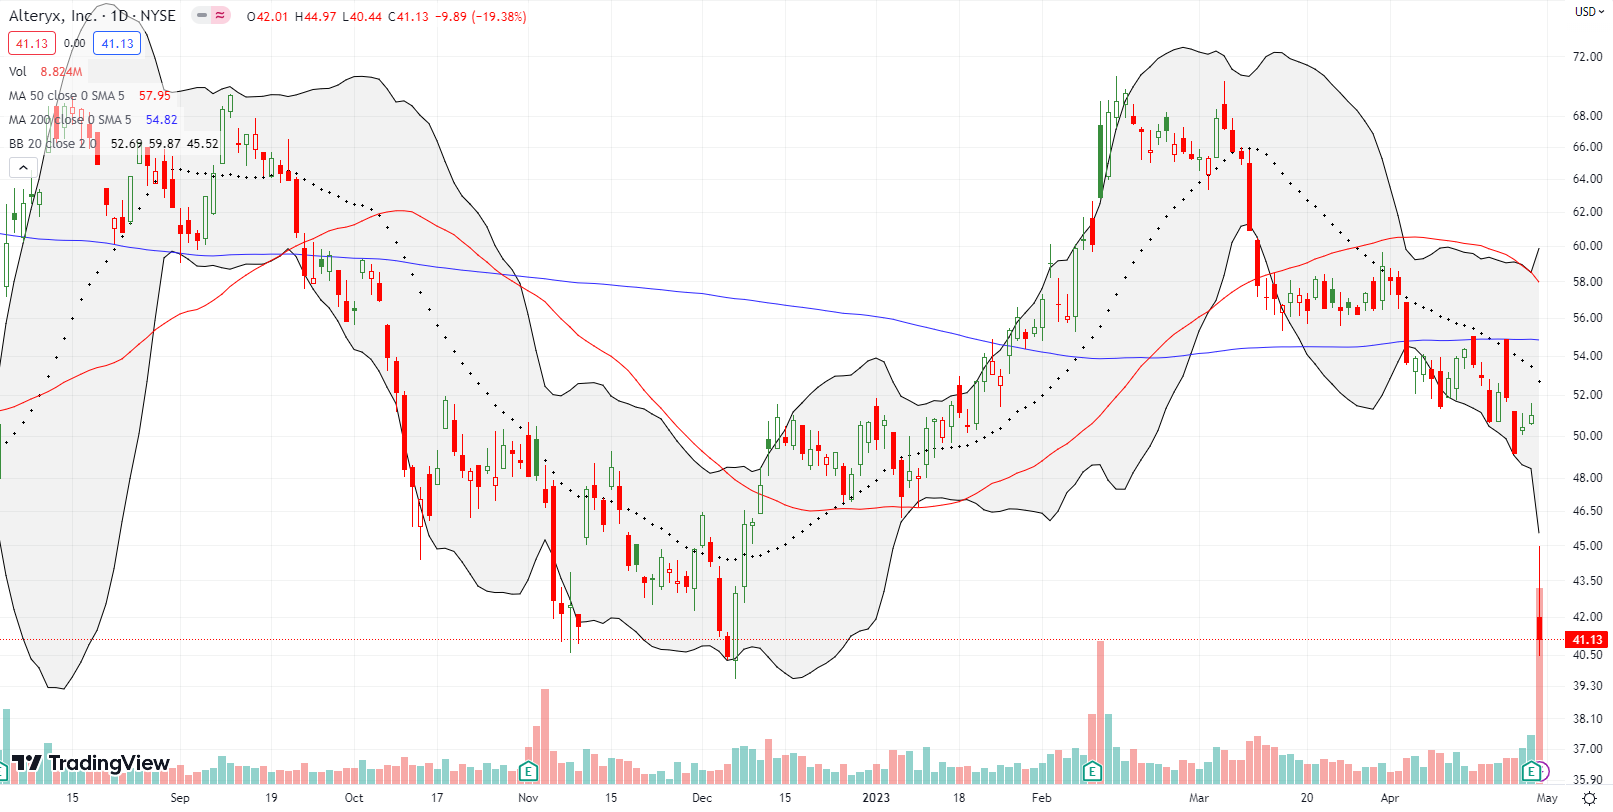
The inefficient market sometimes simply ignores reality for the sake of momentum and related animal spirits. After out-performing the market in December, data analytics platform company Alteryx Inc (AYX) soared with the market in January and into February earnings. AYX gapped up and faded but managed to hold a 4.7% post-earnings gain. Buyers did their best to regain control but finally gave up the ghost after the March high. That downward momentum was a precursor to a 19.4% post-earnings loss on Friday. AYX is now right back to its December low which at the time marked a near 4 1/2 year low. Since AYX peaked in June, 2020, the stock has swung up and down in wide ranges all the way down to current levels. The trend is reality and the relief rallies continue to serve as mirages.
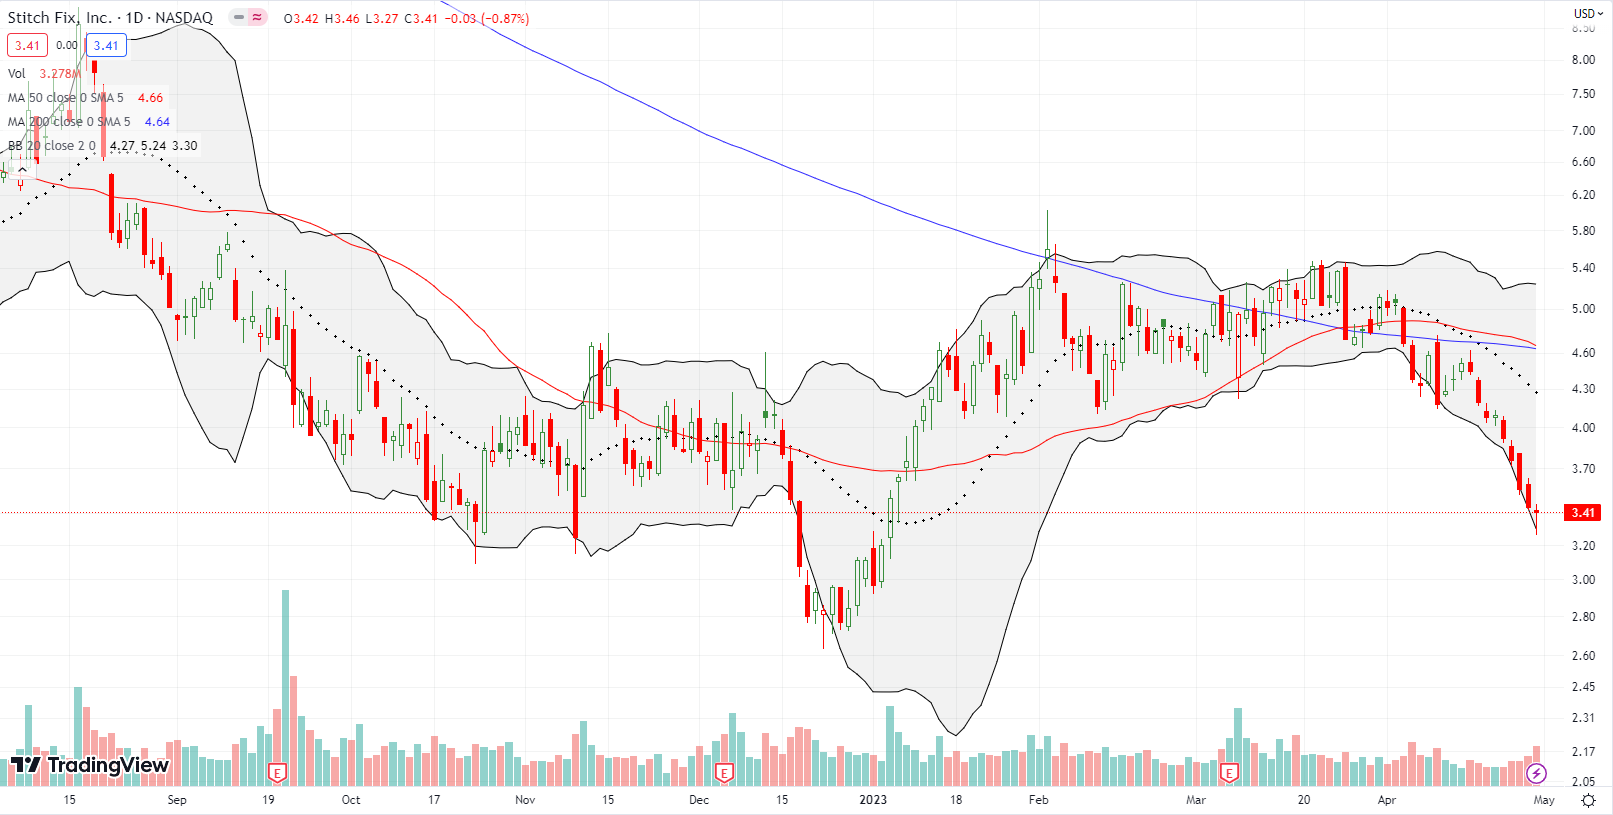
At the beginning of March, I held out Stitch Fix Inc (SFIX) as a potential tell of speculative fever in the stock market. The grinding action in March looked promising as SFIX meandered above all its major trend lines. Unfortunately, SFIX gave up the ghost in April. Now, I am not sure whether SFIX is a tell of anything, but I bailed out of my speculative position over a week ago and licked my wounds.
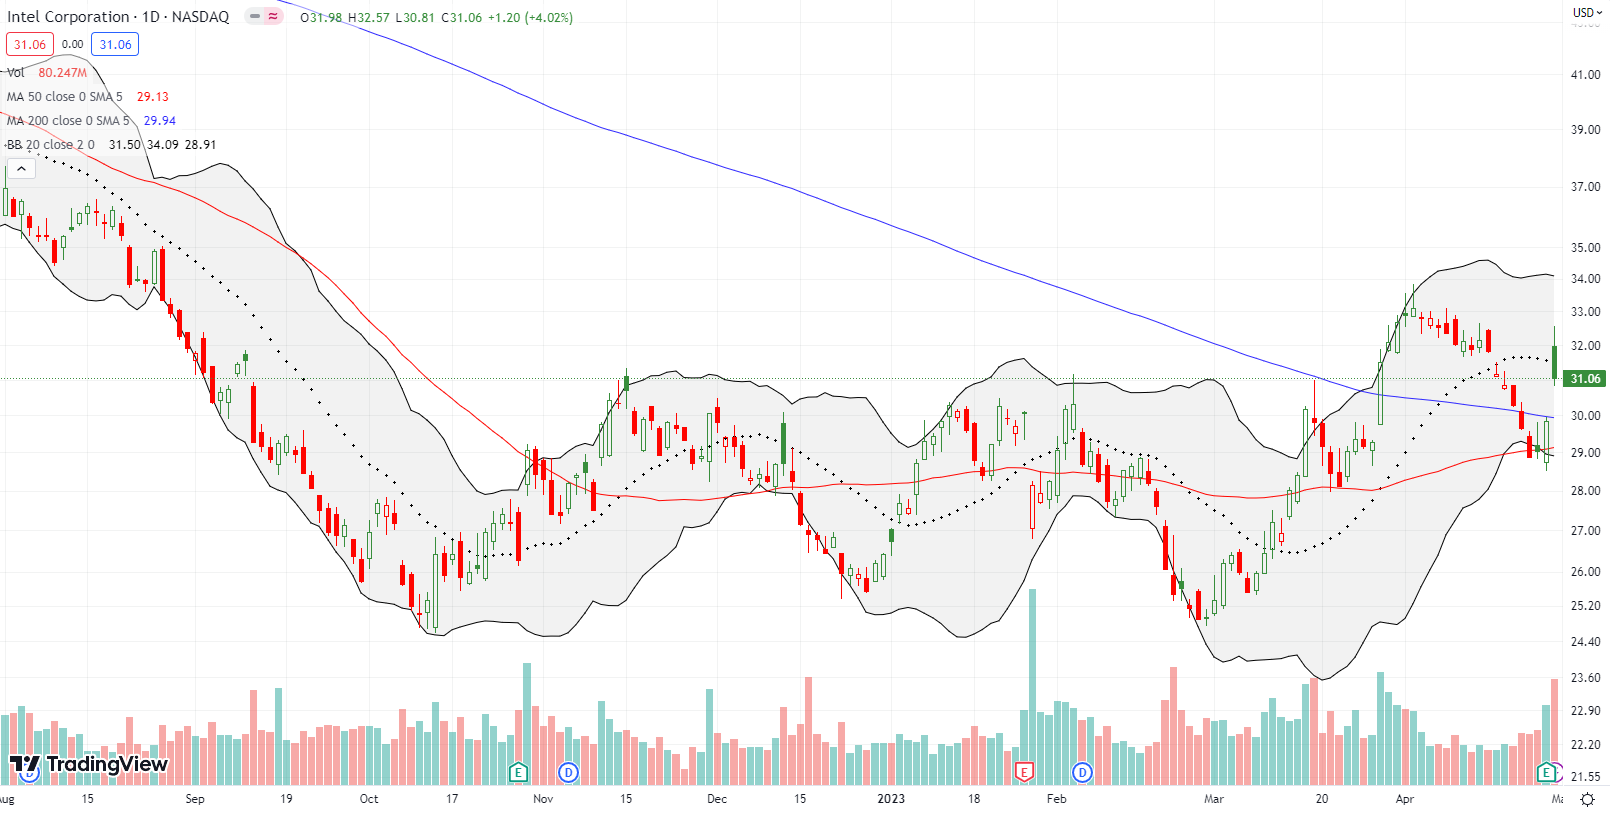
The wild trading in Intel Corporation (INTC) continues. On March 29th, INTC broke out with a 7.6% gain in response to a Data Center and AI webinar. I waited for a pullback to buy. The opportunity came three weeks later as INTC reversed the entire breakout. I bought a call option and then held my breath going into earnings. With expiration the same day, I took profits at the post-earnings open. INTC faded from there for a final 4.0% gain at the close. In the process, INTC confirmed 50DMA support. Accordingly, I still consider INTC a buy on the dips from here.
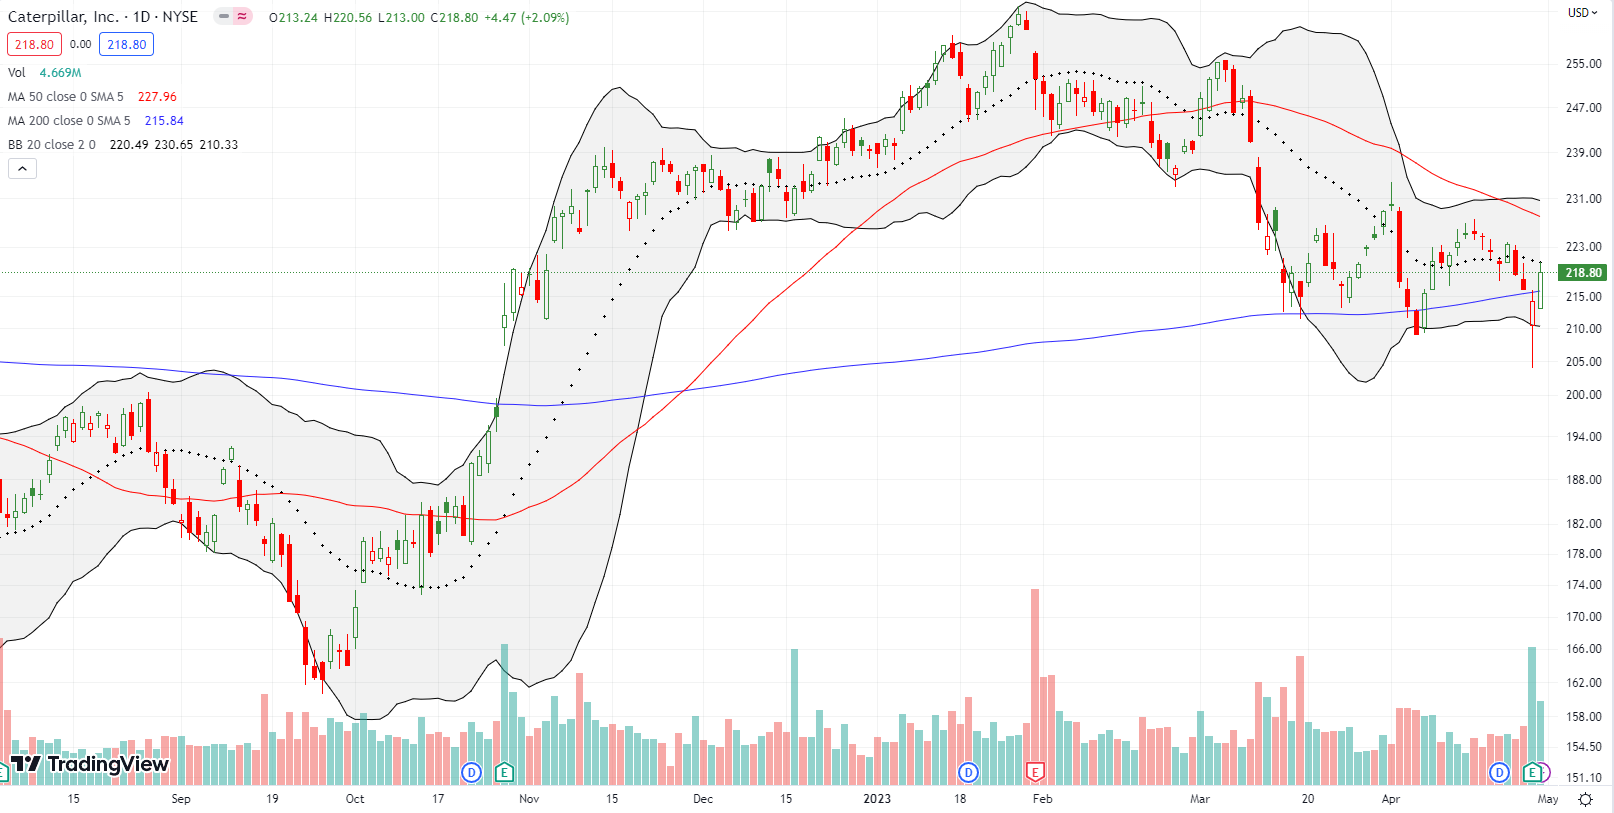
I have been active in Caterpillar Inc (CAT) over the last 2 months or so. CAT is close to a bearish 200DMA breakdown after 50DMA failures, so I have been going after the waning momentum with put options as fades on rallies. I held a position going into earnings and was fortunate to take profits before buyers ran the stock all the way back to 200DMA resistance. I hit the refresh button for a put spread to fade Friday’s continuation of the relief rally.
Be careful out there!
Footnotes
Subscribe for free to get email notifications of future posts!
“Above the 50” (AT50) uses the percentage of stocks trading above their respective 50-day moving averages (DMAs) to measure breadth in the stock market. Breadth defines the distribution of participation in a rally or sell-off. As a result, AT50 identifies extremes in market sentiment that are likely to reverse. Above the 50 is my alternative name for “MMFI” which is a symbol TradingView.com and other chart vendors use for this breadth indicator. Learn more about AT50 on my Market Breadth Resource Page. AT200, or MMTH, measures the percentage of stocks trading above their respective 200DMAs.
Active AT50 (MMFI) periods: Day #25 over 20%, Day #2 over 30%, Day #1 over 40%, Day #38 under 50%, Day 48 under 60%, Day #50 under 70%
Source for charts unless otherwise noted: TradingView.com
Full disclosure: long QQQ put spread; long CAT put spread, long PI
FOLLOW Dr. Duru’s commentary on financial markets via StockTwits, Twitter, and even Instagram!
*Charting notes: Stock prices are not adjusted for dividends. Candlestick charts use hollow bodies: open candles indicate a close higher than the open, filled candles indicate an open higher than the close.


