Stock Market Commentary:
The summer of loving stocks may have begun. In a list of debt ceiling winners and losers, Vox failed to list the stock market as one of the biggest winners. The lingering and residual angst accompanying the manufactured drama of the debt ceiling released its hold on the market’s bias to go higher. Not even one more strong jobs report could deter the buyers. A breakout for market breadth, a plunge in volatility, and even signals from the currency market all combined to provide key endorsements for the latest run-up in stocks. This run-up also further secured the end of the NASDAQ’s bear market.
Bears fixated on “fundamentals” are truly confounded by the convergence of technical bullish signals. I inundate myself with the bearish talk because I do not want to get “caught” being foolishly bullish, but the litany of disbelief gets tiring at times. The observations sometimes sound selective. For instance, some critics decry bubbles in AI-related stocks as creating lopsided drivers of market action while at the same time failing to acknowledge the potential for market breadth to play catch-up.
As a related example, all the weak price action in financials, retailers, materials, and commodities are supposed to provide proof that something is wrong. However, the weakness in financials is a clear carryover from the issues regional banks faced in March. Falling commodity stocks could be precursors of the death of inflation which would provide relief for consumers and retailers. If the market continues to surge, I anticipate escalating protests from the bears.
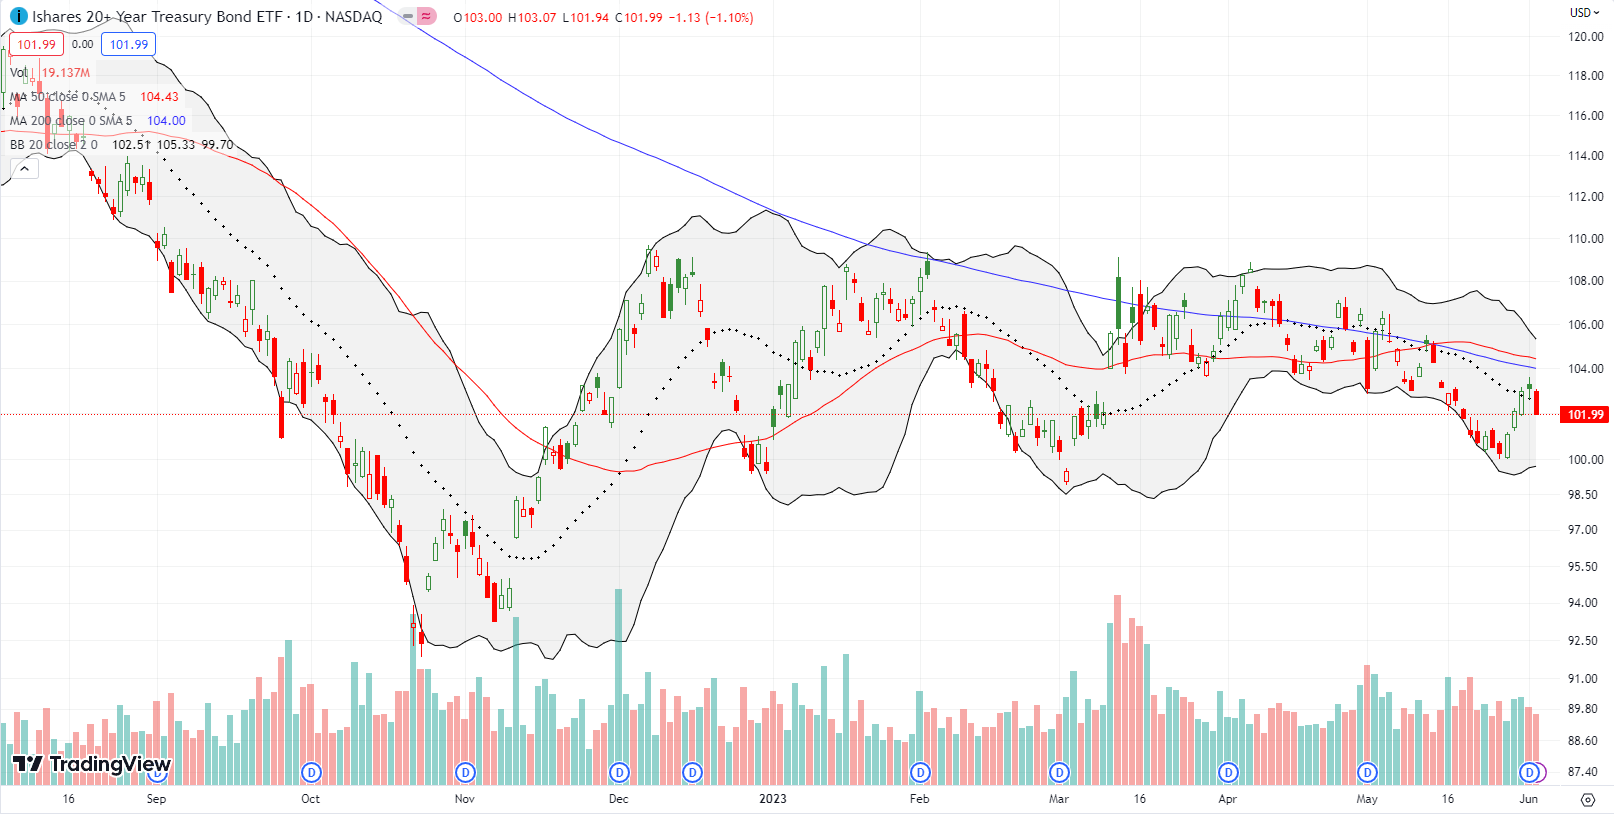
One potentially interesting fallout from the debt ceiling resolution is the government’s need to play catch-up with its cash needs. The treasury will reportedly need to rush out about a trillion dollars in new debt in the next 3-6 months. That scramble makes me think interest rates will have a bias higher. Accordingly, I bought a September $100/95 put spread in iShares 20+ Year Treasury Bond ETF (TLT). Since the November breakout, the $100 level has provided approximate support for TLT three times. So I strongly suspect a fourth test has a high likelihood of failing.
The Stock Market Indices
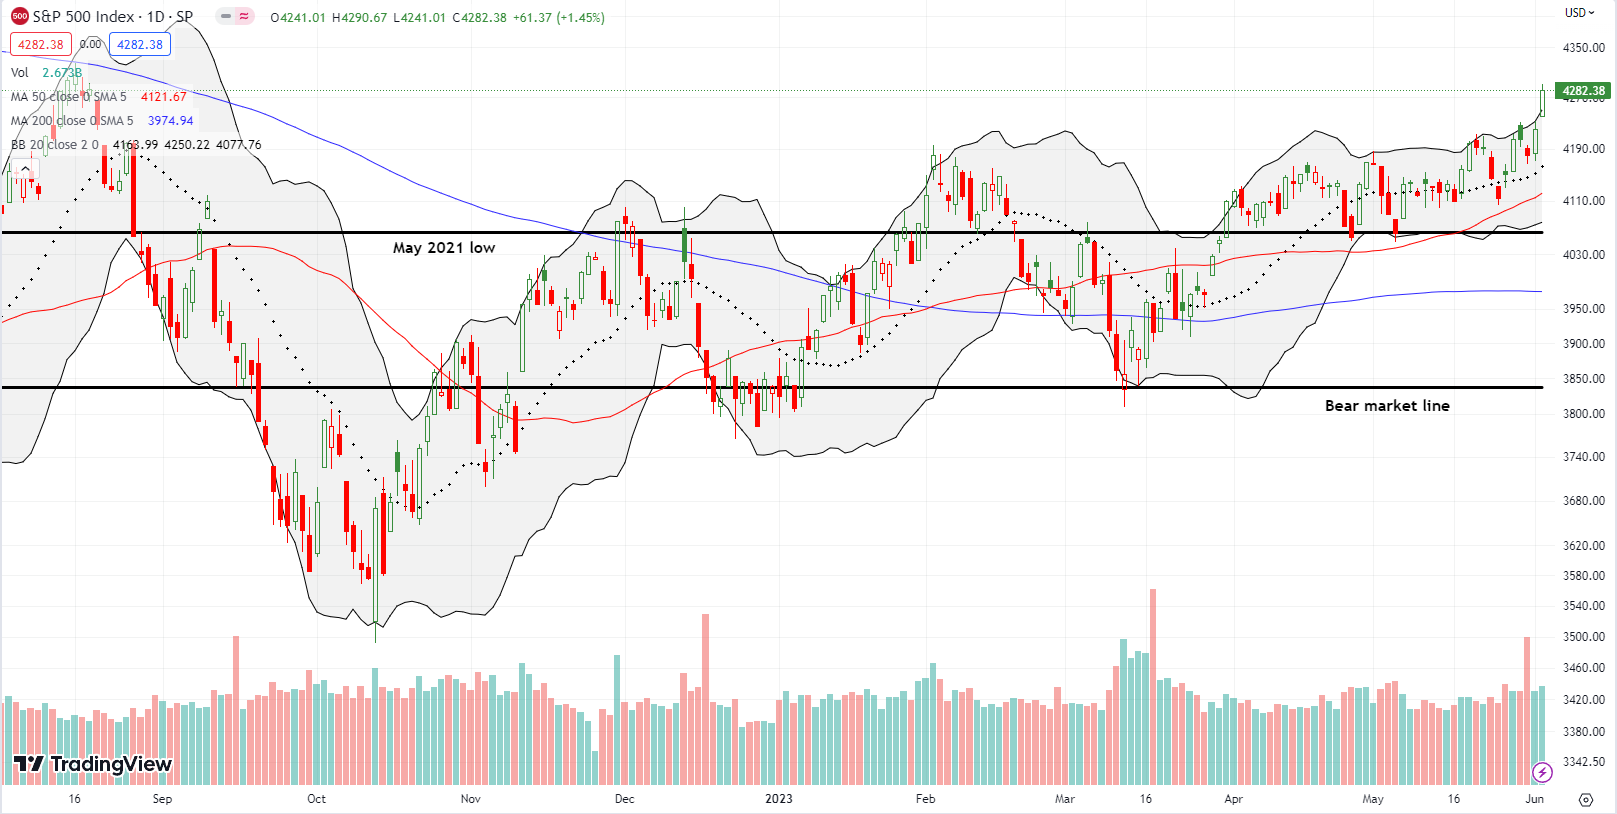
The S&P 500 (SPY) finally put Powell’s Jackson Hole slam in the rear view mirror. The index took its endorsements and won a clear breakout from May’s period of consolidation. At an 8-month high the S&P 500 looks up to the challenge of conquering its August, 2022 high. Such a move will confirm a bearish to bullish reversal that has been in the making since the October lows. The choppiness of the path to this point has made the transformation first hard to see, then hard to believe.
Yet here is the recovery and breakout: fully supported by the May, 2021 low, a bear market increasingly hard to see in the rear view mirror, an upward trending 20-day moving average (DMA) (the dashed line) and an upward trending 50DMA (the red line). Because the price action is getting parabolic with the stretch well-above the upper Bollinger Band (BB), I am expecting a cooling period if not a (mild) pullback in the coming week.
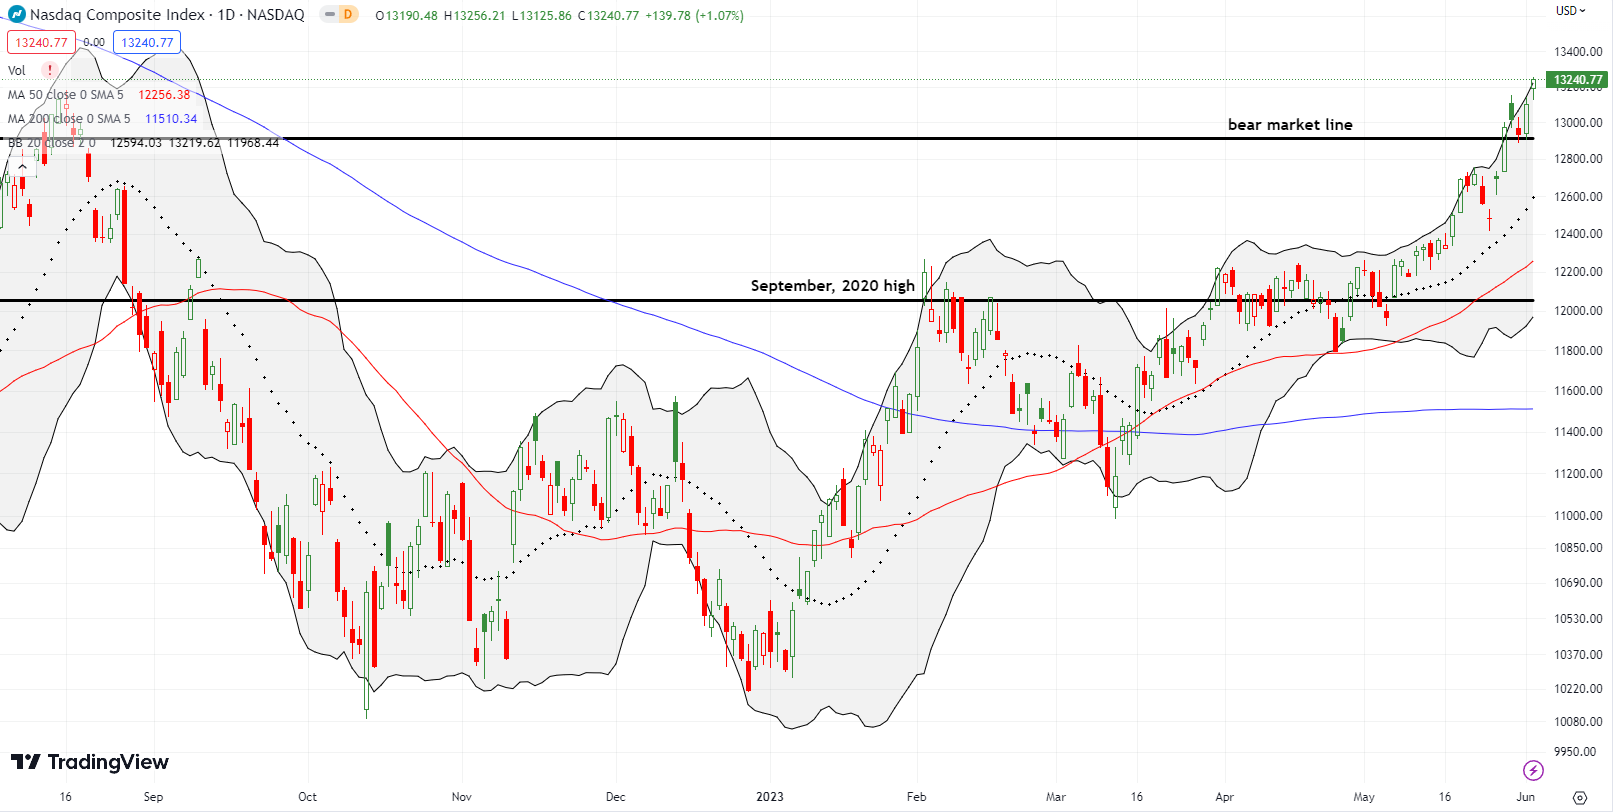
The NASDAQ (COMPQ) got early endorsements a week ago when it first cracked its bear market line. Last week started with a marginal confirmation of the end of the bear market. The next day the tech-laden index pulled back perfectly to the bear market line as support. Buyers resumed the breakout from there. The NASDAQ closed at a 14-month high which means it is clear to keep running from here. The next two “natural” resistance levels reside in a period of consolidation in April, 2022 around 13,674 and then stiffer resistance at the March, 2022 high (14,639) where the first rebound off the bear market line came to a screeching halt.
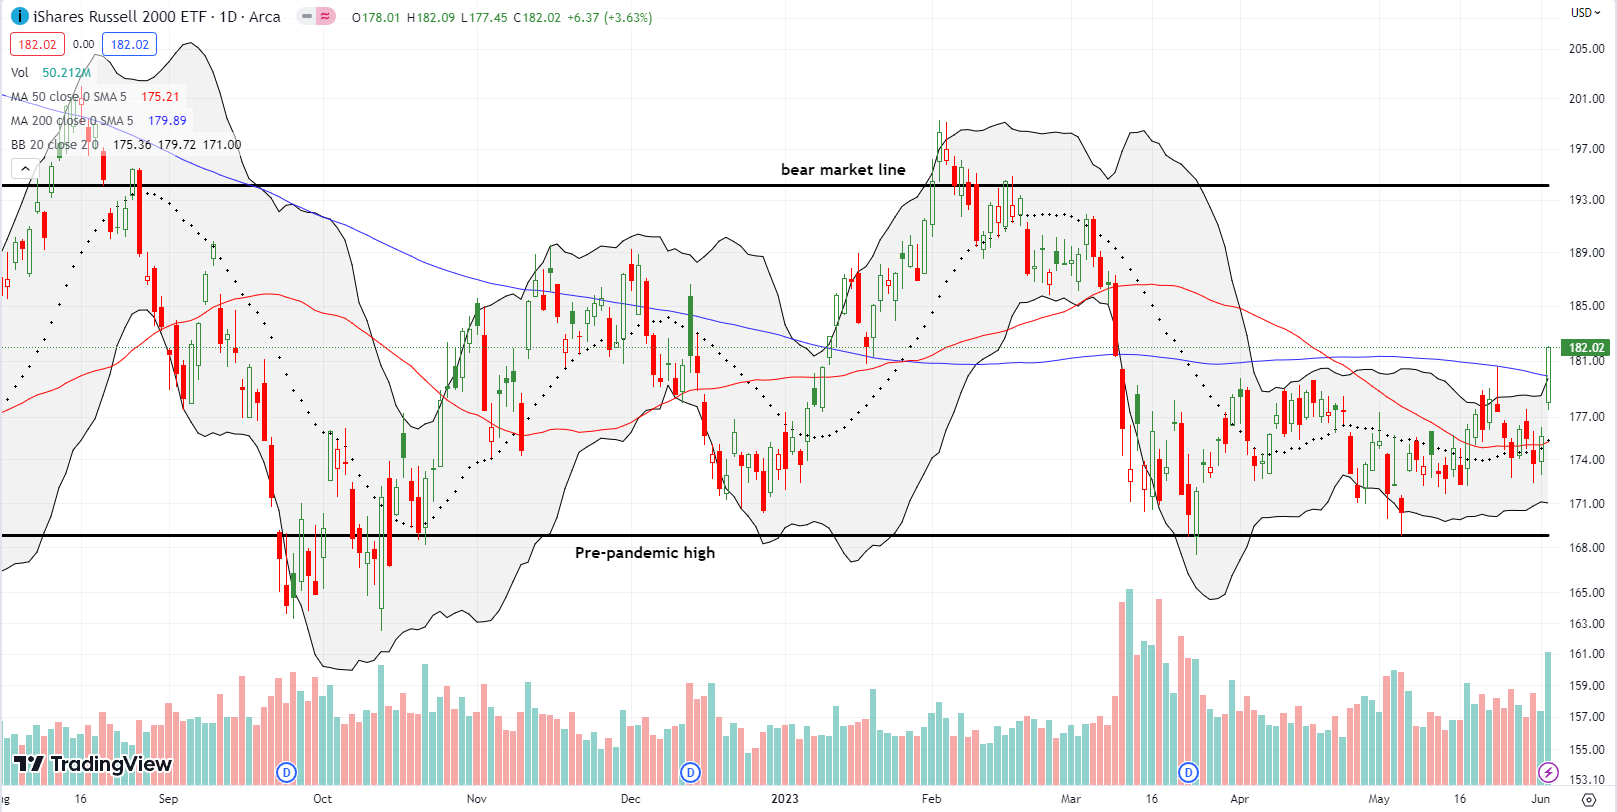
The iShares Russell 2000 ETF (IWM) still lags overall, but the ETF of small caps got endorsements to break free of the the trading range in place since the collapse of Silicon Valley Bank (SVB). I bought a call spread earlier in the week to play a test of overhead 200DMA resistance (the bluish line) in the next two weeks. So I promptly took profits on the test of resistance. Buyers kept pushing from there, and IWM closed the week at a 3-month high. On a higher close, IWM should be all clear to run back to its bear market line.
Stock Market Volatility
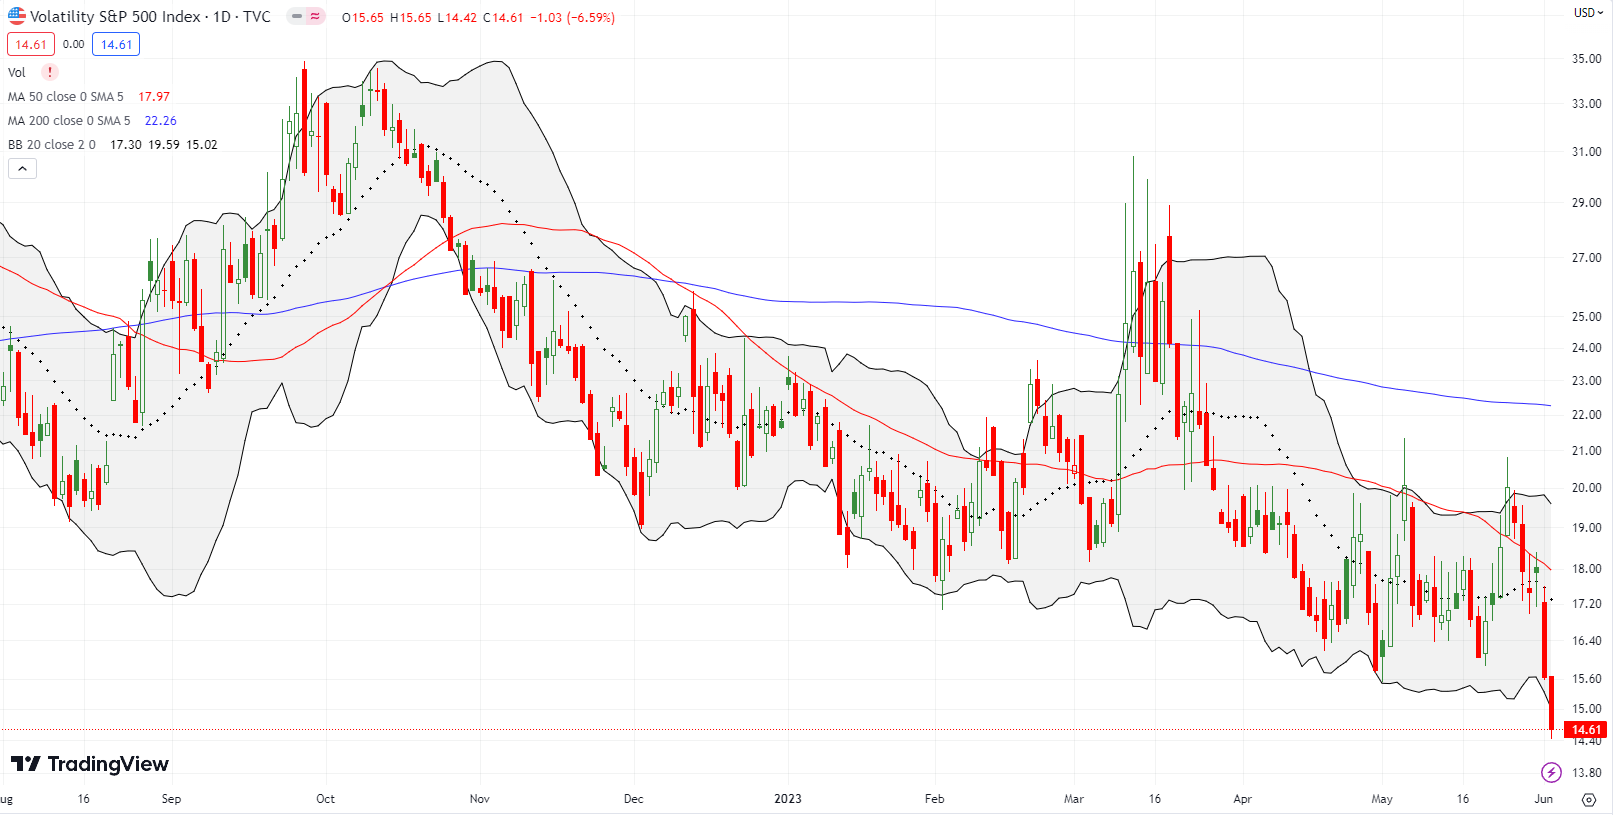
The volatility index (VIX) resonated with bullish endorsements. The end of the manufactured drama of the debt ceiling released pent-up volatility selling. The faders were relentless. On Thursday, the VIX fell 12.8% and fell another 6.6% the next day. I consider a close below 15 to be a bullish development. However, the VIX has a tendency to pivot around 15.35 when it gets this low (I wish I knew why). Thus, the VIX’s descent could easily stall around current levels.
I took small profits on my put spread in iPath Series B S&P 500 VIX Short-Term Futures ETN (VXX) ahead of the implosion. While I remained skeptical of the drama surrounding the debt ceiling, I decided to get “cute” and wait to fade on one more VIX spike. However, that spike never materialized.
The Short-Term Trading Call With Endorsements
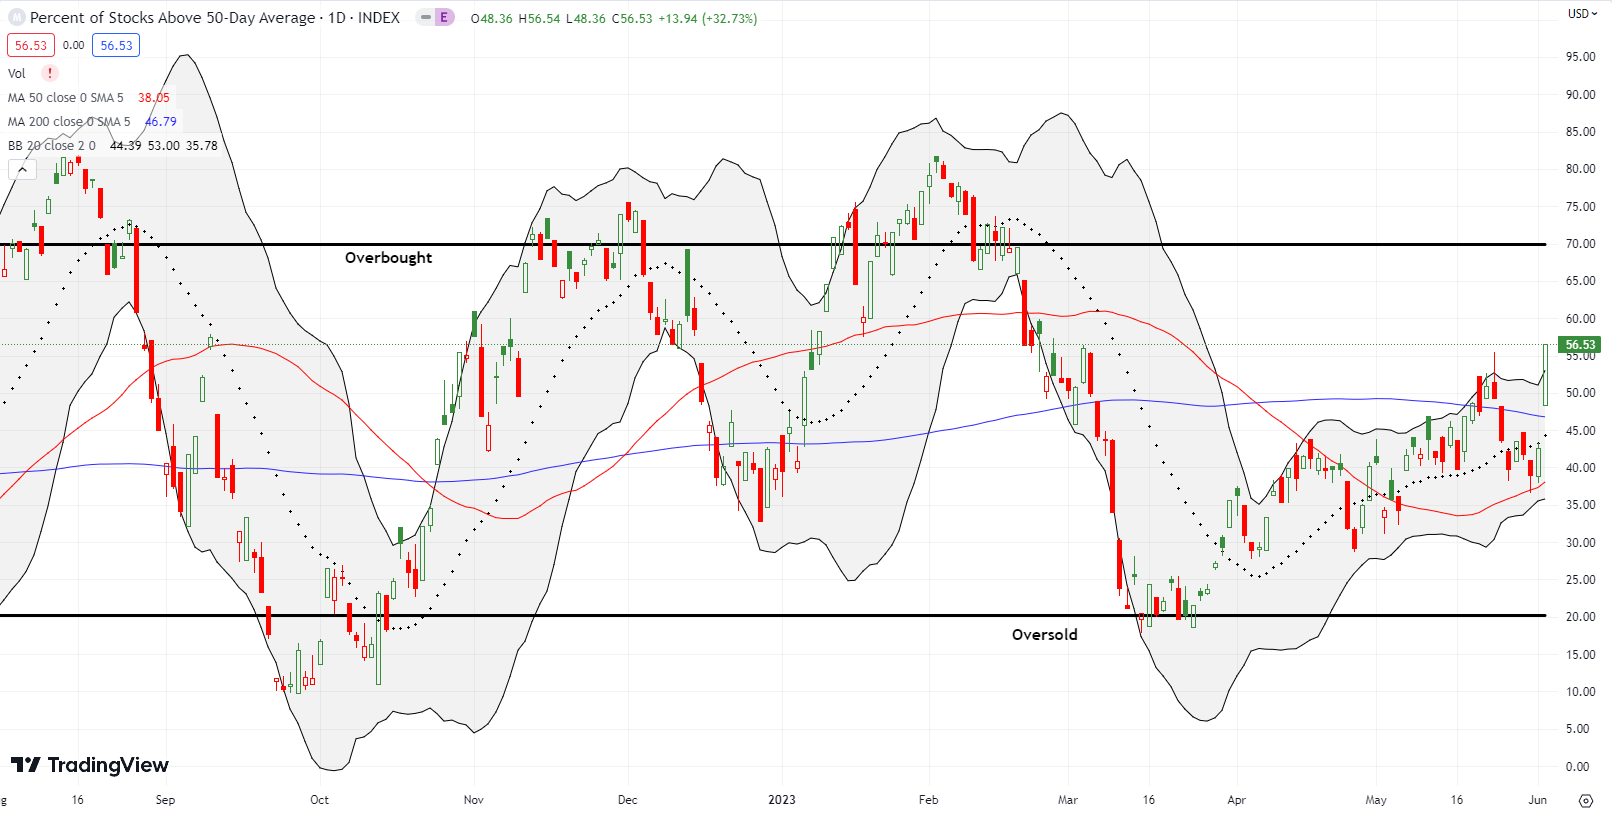
- AT50 (MMFI) = 56.5% of stocks are trading above their respective 50-day moving averages
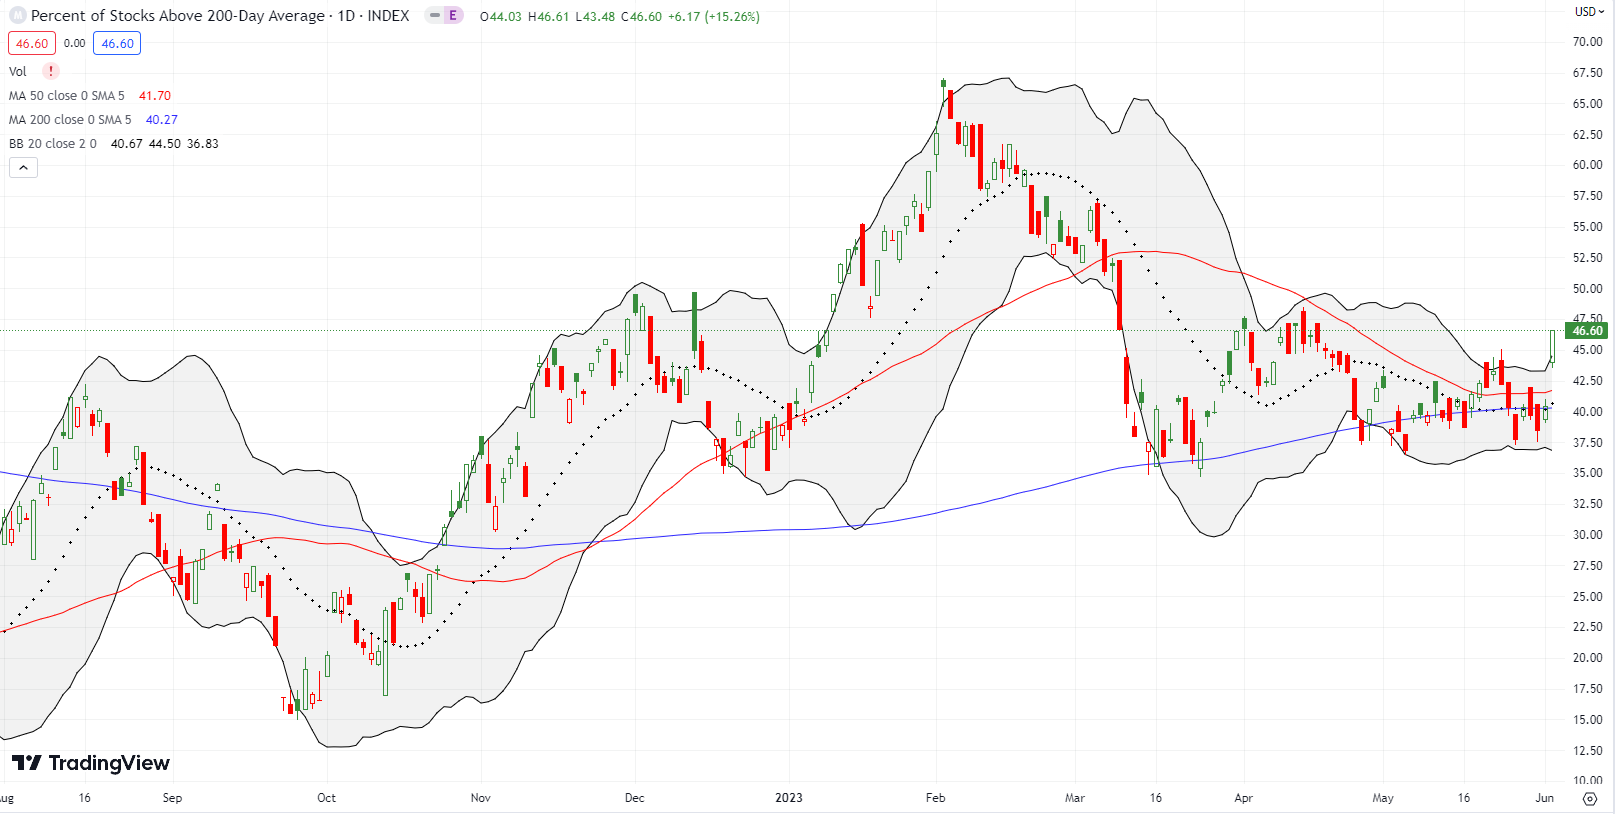
- AT200 (MMTH) = 46.6% of stocks are trading above their respective 200-day moving averages
- Short-term Trading Call: cautiously bullish
AT50 (MMFI), the percentage of stocks trading above their respective 50DMAs, broke out to a 3 1/2 month high. My favorite technical indicator issued the strongest endorsements for this rally. Bears have incessantly complained about the poor market breadth to throw skepticism on the breakout of the indices. A week ago, I even conceded the point as potential bearish divergence. However, a divergence can be fixed. In this case, the divergence realigned in one swift move. Needless to say, I left my short-term trading call at cautiously bullish. AT50’s breakout validates my move to “stick my head out” and upgrade from neutral.
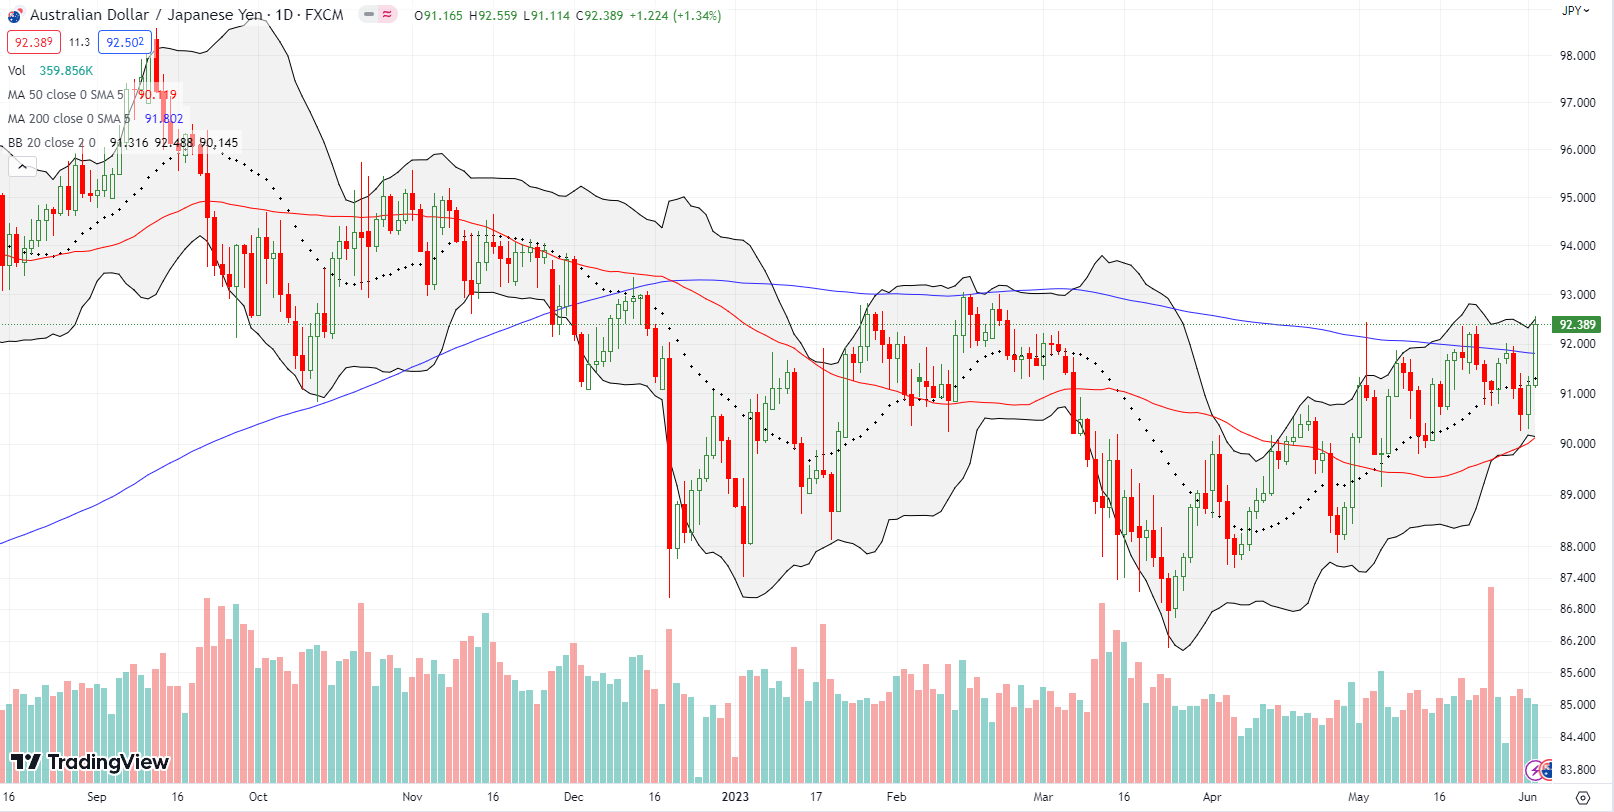
Another set of endorsements came from the currency market. The Australian dollar versus the Japanese yen (AUD/JPY) broke out above its 200DMA and printed a near 4-month high. This surge looks more convincing than the May 22nd breakout which turned out to be a precursor to Friday’s move. Still, buyers must confirm the breakout with a higher close. I will be back to going long AUD/JPY at that point. I earlier played the churn with profits on run-ups toward 200DMA. (Read “Why the Australian Dollar and Japanese Yen Matter for Stock Traders” for a refresher on why I monitor AUD/JPY for signals on market sentiment).
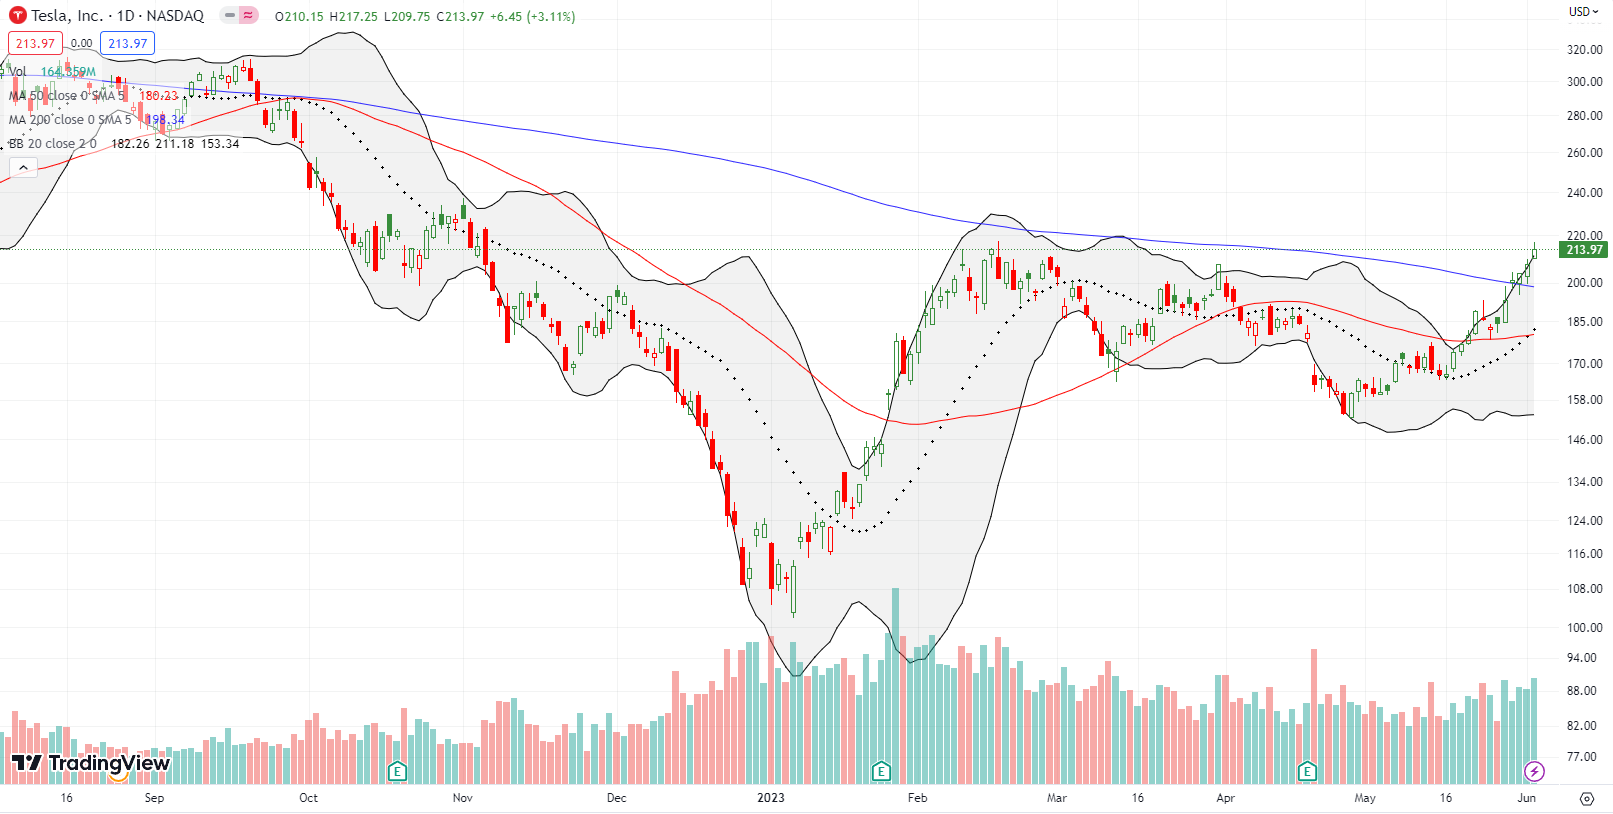
When Tesla, Inc (TSLA) is in a bullish mood, I know endorsements must be strong. TSLA confirmed a 200DMA breakout and, along the way, it also effectively brought an end to a downtrend defined by its 200DMA. I flipped a calendar call spread on the breakout, and I am now in buy the dip mode on TSLA.
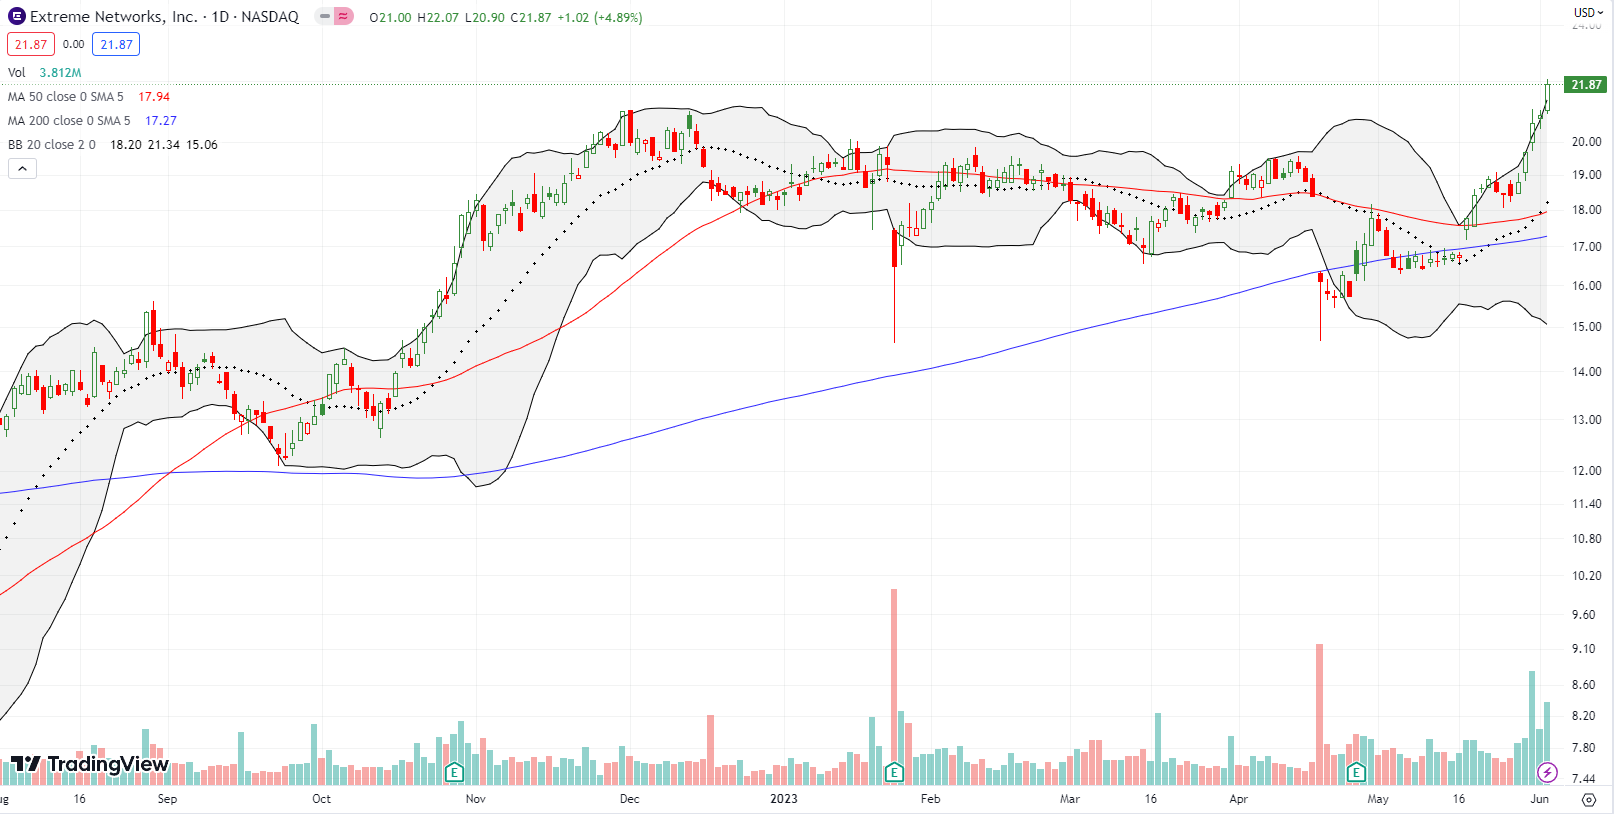
Remember Extreme Networks, Inc (EXTR)? This communications equipment provider flamed out around $114/share in the dot com bust. EXTR made an all-time low during the financial crisis just above $1/share. The pandemic-driven crash took EXTR to $1.44 on an intraday basis. The stock has recovered in stretches since then. The latest recovery stretch may have started with last week’s breakout from a slight, 5-month downtrend. Leading into the breakout, the 200DMA provided approximate support even after an analyst downgrade from overweight to hold caused EXTR to gap down and close just below its 200DMA on April 19th. Earnings a few days later apparently provided some reassurances.
I jumped into the stock after it scored highly on SwingTradeBot’s expansion breakout scan. The stock continues to surge, but its growth is already exhibiting parabolic trends. I am holding on to the edge of my seat for whatever is coming next…
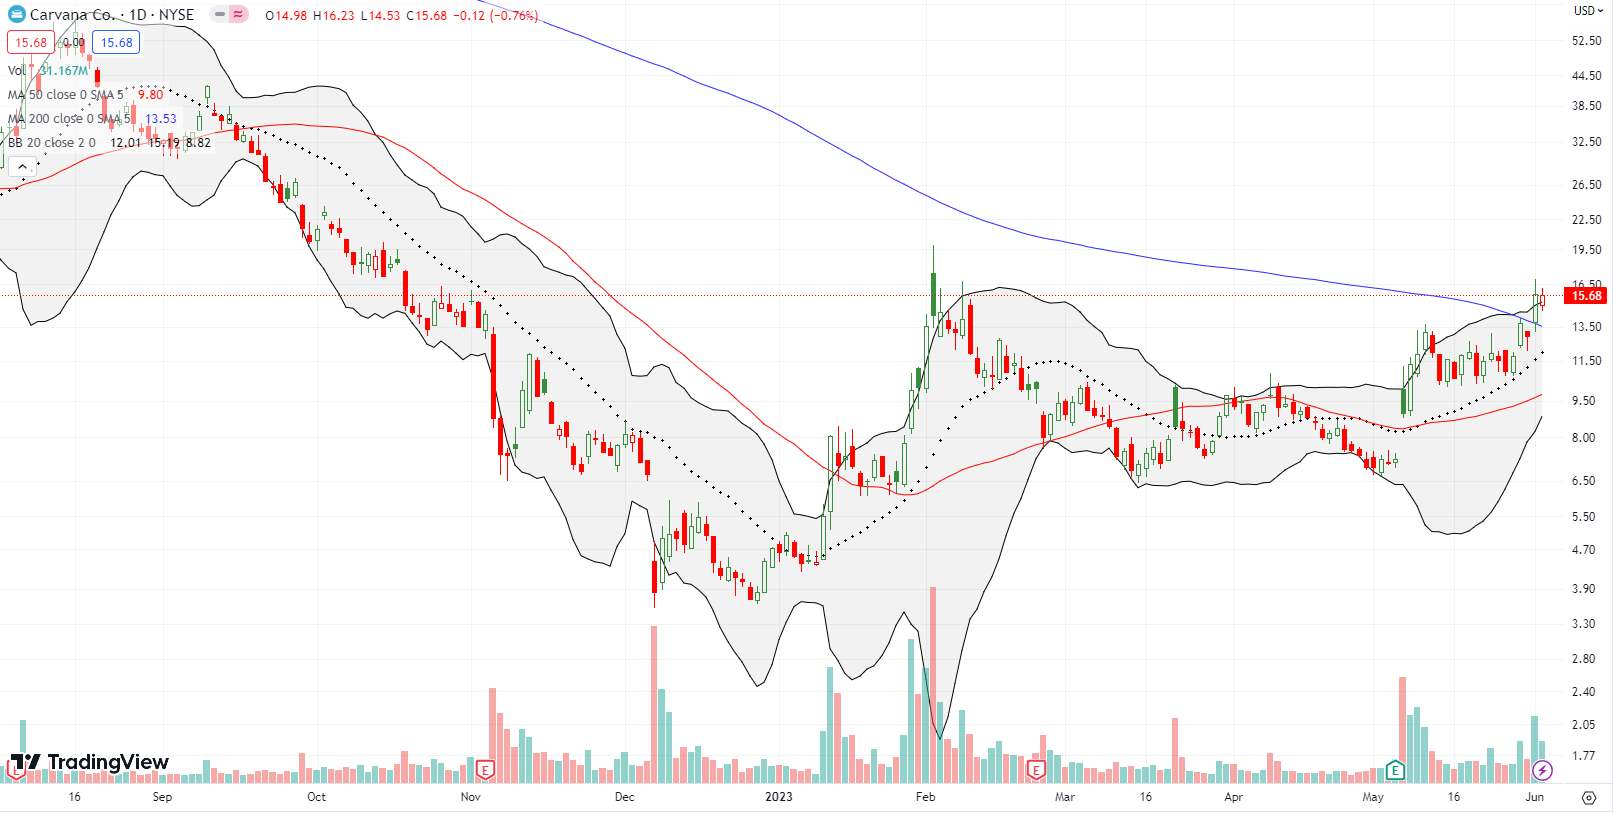
The endorsements are flowing so freely that even a company with a near-death experience like Carvana Co (CVNA) is enjoying a fresh breakout. While CVNA has not yet closed above its intraday high of the year, Thursday’s 200DMA breakout looks promising. A close higher from here will carve out a bearish to bullish reversal for CVNA. The stock still has a 45% short interest, so I suspect there are few motivated sellers around to slow down a fresh run-up.
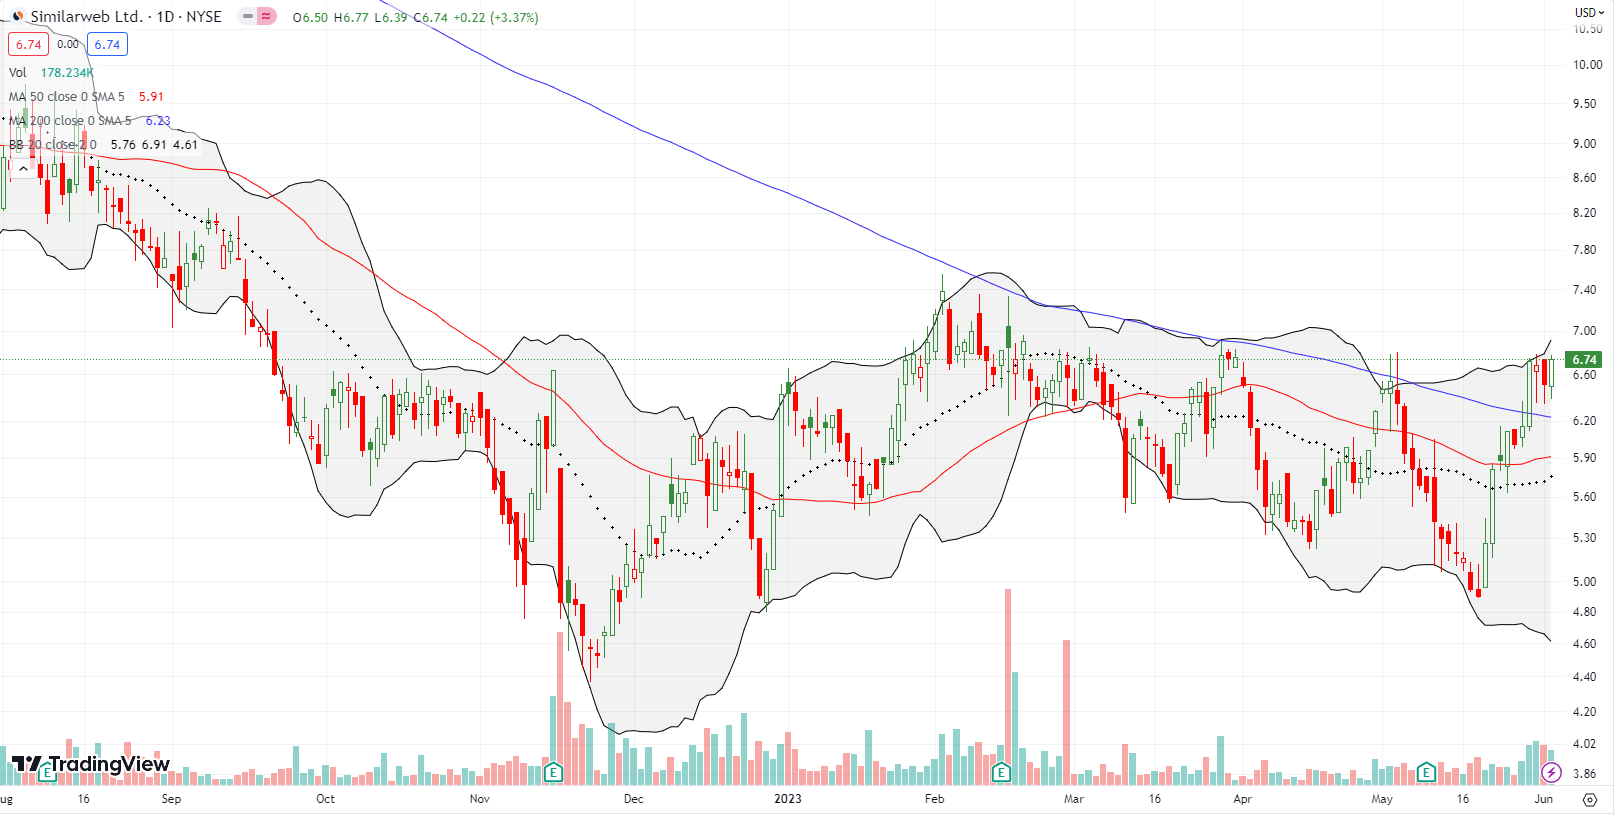
I used and loved the marketing intelligence software from SimilarWeb Ltd (SWMB). After I realized that they are a publicly traded company, I kept an eye out for an entry point. SMWB started selling off soon after its May, 2021 debut and hit its last all-time low in November, 2022. A subsequent rally hit stiff resistance at the downward trending 200DMA. That downtrend finally ended last week with a higher high and a 200DMA breakout; an entry point finally appeared for me to buy. While the technicals look promising for the first time, SMWB still needs to clear the high of the year set in February to look strong.
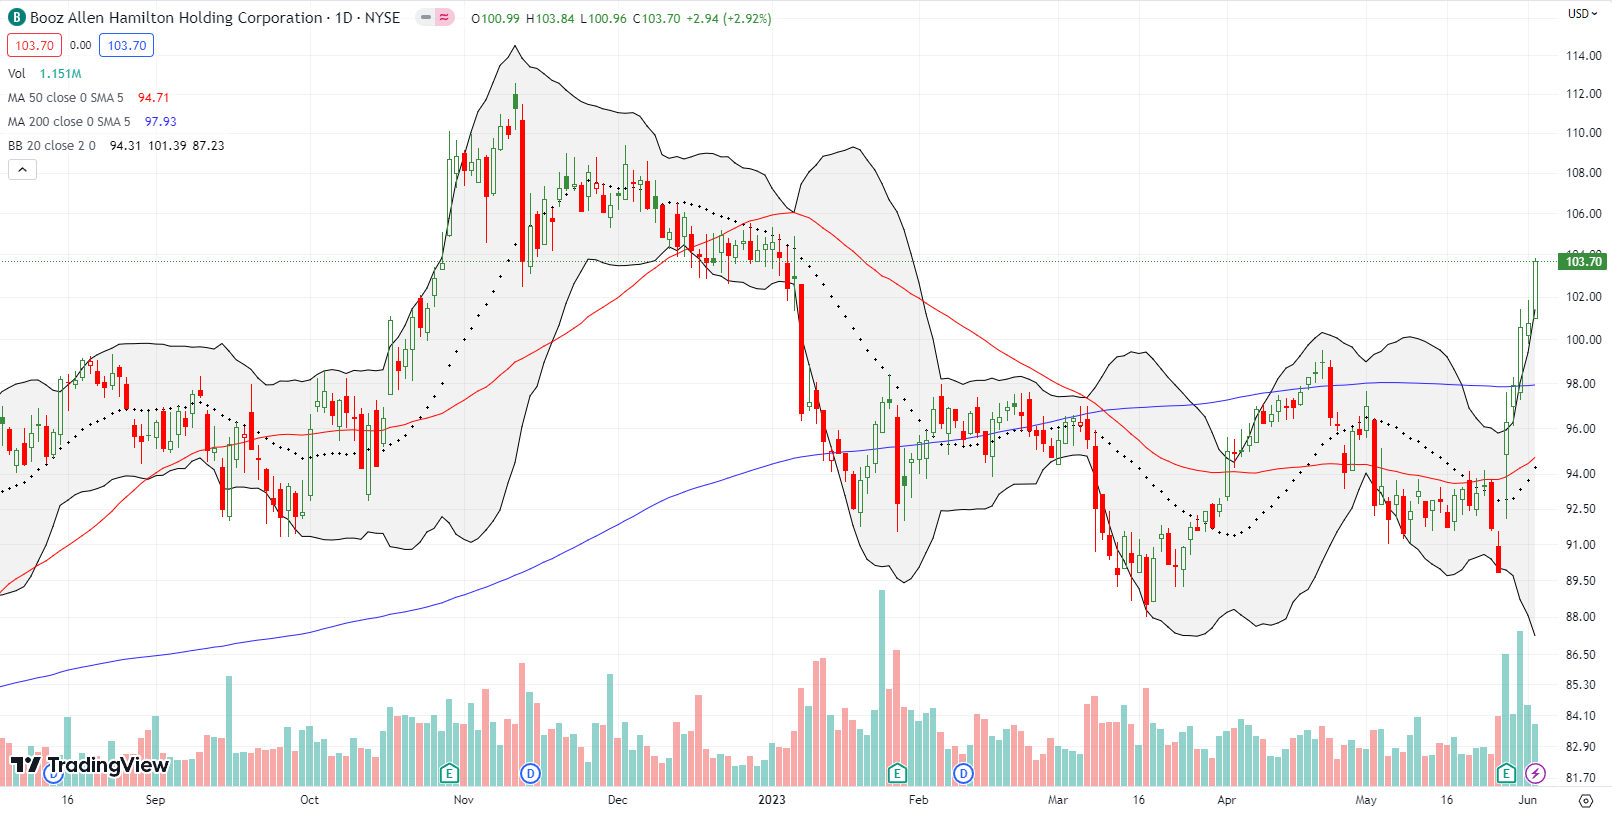
Booz Allen Hamilton Holding Corporation (BAH) is another stock that I liked from SwingTradeBot’s expansion breakout scan. I took my eye off the ball after Thursday’s tepid showing failed to trigger a buy. I could only watch as BAH surged away from me on Friday. Clearly traders and investors liked what they heard in the last earnings report. Now, I hope to join them on the next dip. BAH is very extended now with so many closes well above the upper Bollinger Band.
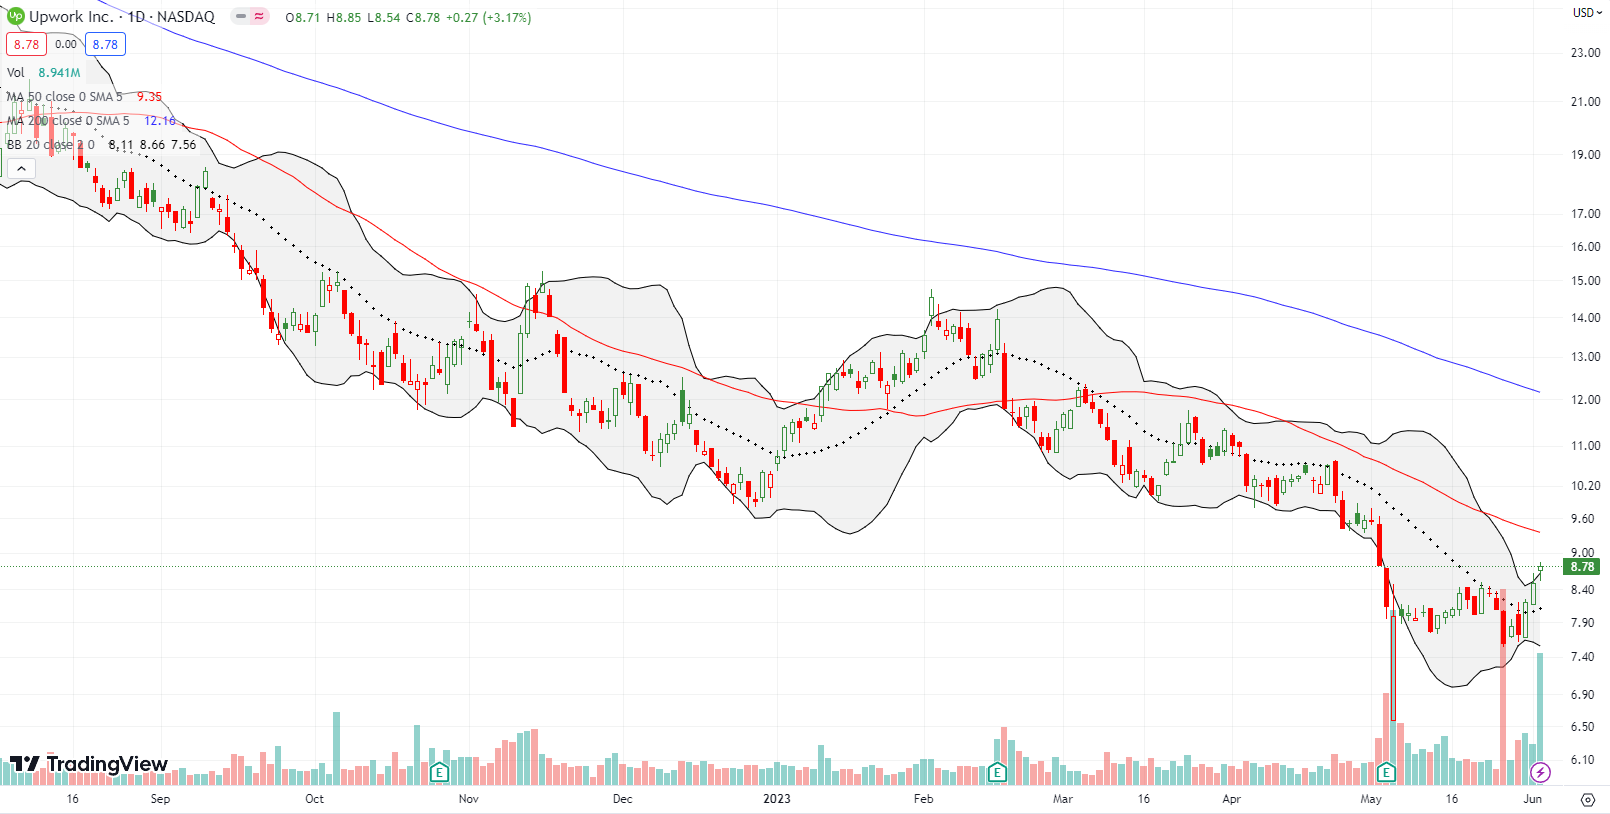
I have watched Upwork Inc (UPWK) closely ever since the stock mounted a spirited comeback from a huge post-earnings gap down. Last week the stock made a new post-earnings high, and I jumped in. The trade is a bit risky given the downtrends from the 50DMA and 200DMA are well-intact. Still, the kind of seller’s exhaustion that seemed to happen after earnings typically creates major bottoms. So I am willing to take more risk here and even accumulate more stock down to 20DMA support. I am also emboldened by the endorsements for bullishness in the stock market.
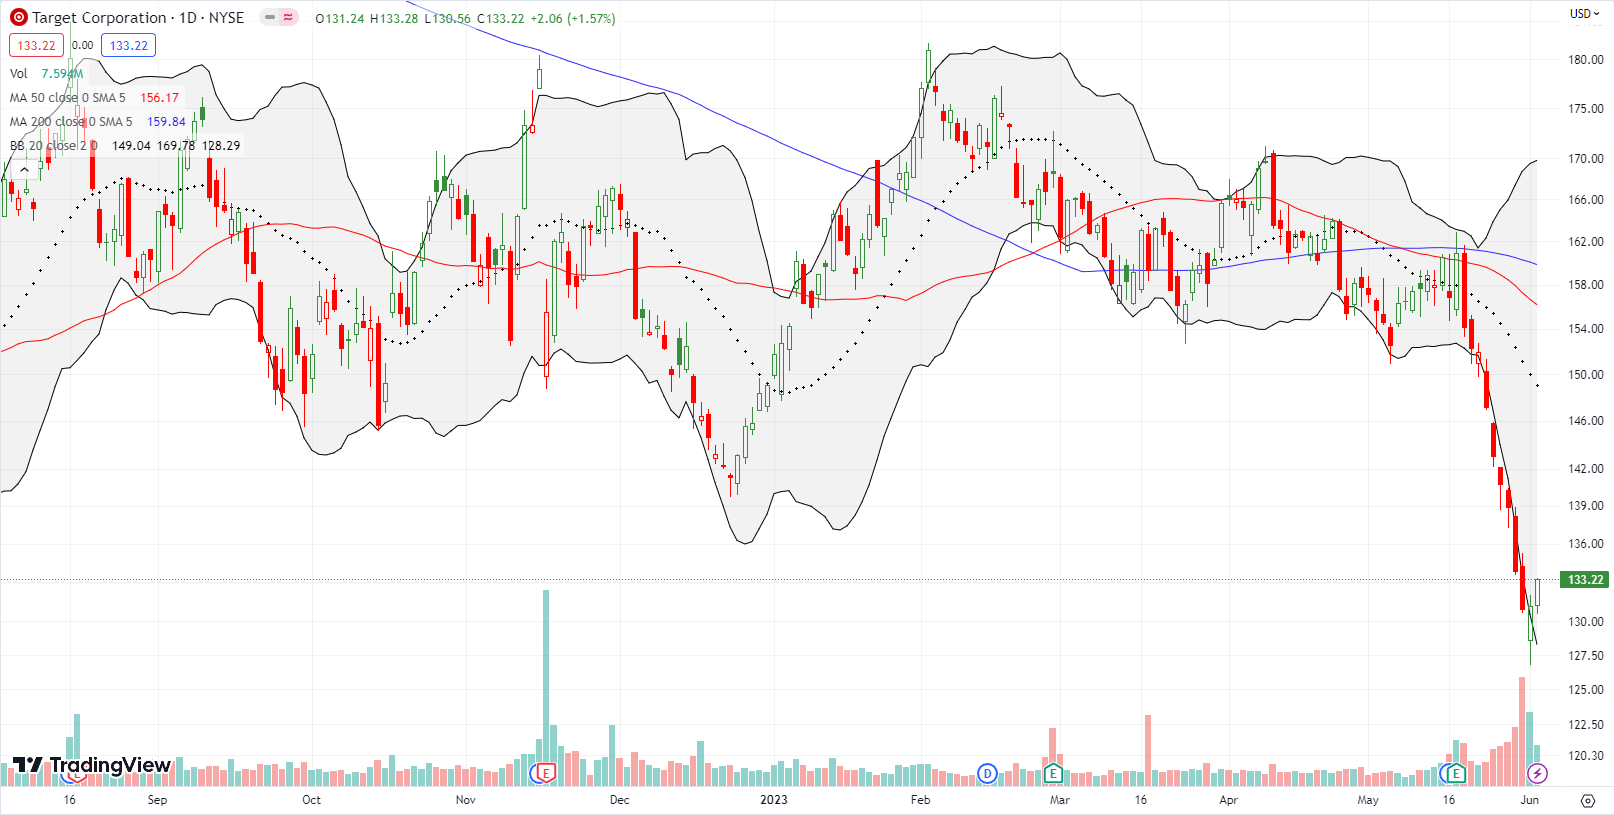
Target Corporation (TGT) sold off 4.2% after reporting earnings and has not been the same since. Until the last 2 days of buying, TGT sold off for 9 days straight, hitting a 22-month low. Typically, I would get interested in buying a well-established brand at the end of such an extreme. However, this breakdown looks like a continuation of a secular decline that began when TGT imploded a year ago with a 24.9% post-earnings loss. With TGT reducing earnings guidance, I see no positive catalyst until the company reports a string of good news.
Be careful out there!
Footnotes
Subscribe for free to get email notifications of future posts!
“Above the 50” (AT50) uses the percentage of stocks trading above their respective 50-day moving averages (DMAs) to measure breadth in the stock market. Breadth defines the distribution of participation in a rally or sell-off. As a result, AT50 identifies extremes in market sentiment that are likely to reverse. Above the 50 is my alternative name for “MMFI” which is a symbol TradingView.com and other chart vendors use for this breadth indicator. Learn more about AT50 on my Market Breadth Resource Page. AT200, or MMTH, measures the percentage of stocks trading above their respective 200DMAs.
Active AT50 (MMFI) periods: Day #44 over 20%, Day #18 over 30%, Day #15 over 40%, Day #1 over 50% (overperiod ending 4 days under 50%), Day #67 under 60%, Day #69 under 70%
Source for charts unless otherwise noted: TradingView.com
Full disclosure: long SMWB, long EXTR, long UPWK
FOLLOW Dr. Duru’s commentary on financial markets via StockTwits, Twitter, and even Instagram!
*Charting notes: Stock prices are not adjusted for dividends. Candlestick charts use hollow bodies: open candles indicate a close higher than the open, filled candles indicate an open higher than the close.


1 thought on “Key Endorsements for the 2023 Run-Up In Stocks – The Market Breadth”