

Housing Market Intro and Summary
The seasonal trade on home builders ended in the middle of one of those critical junctures for these stocks and the housing market in general. Mortgage rates are done coming down for now and could break to new highs as the Federal Reserve continues hiking short-term rates to battle inflation. The strong labor market that has helped buttress housing demand is also the very thing enabling the Fed to keep hiking interest rates. Waning consumer sentiment threatens to take some steam out of the enthusiasm for buying homes. Yet, new home sales continue to trend upward and, in turn, they are boosting the confidence of home builders. Publicly traded builders are still able to report strong earnings results and deliver strong guidance. The chronically tight inventory of existing homes adds the boost of more market share for home builders. Finally, housing permits continue to rebound, but housing starts in the south are waning. This overall mix creates a picture of a housing market that wants to stay defiant right into the teeth of whatever economic recession is supposed to come soon to end the current economic cycle.
Housing Stocks
The uptrend in iShares US Home Construction ETF (ITB) continued in May. Along the way to prices last seen in January, 2022, ITB conquered two parabolic run-ups. However, an abrupt and sharp drawdown almost two weeks ago may have signaled the end of the momentum. Housing bears can even make a decent case for shorting ITB going into the summer, especially with the end of the seasonal strength for home builders.
Currently, ITB is teetering on support from its 50-day moving average (DMA) (the red line below). This price action will test the defiant uptrend in the stocks of home builders that has delivered out-performance to the S&P 500 despite a recession in housing.
")
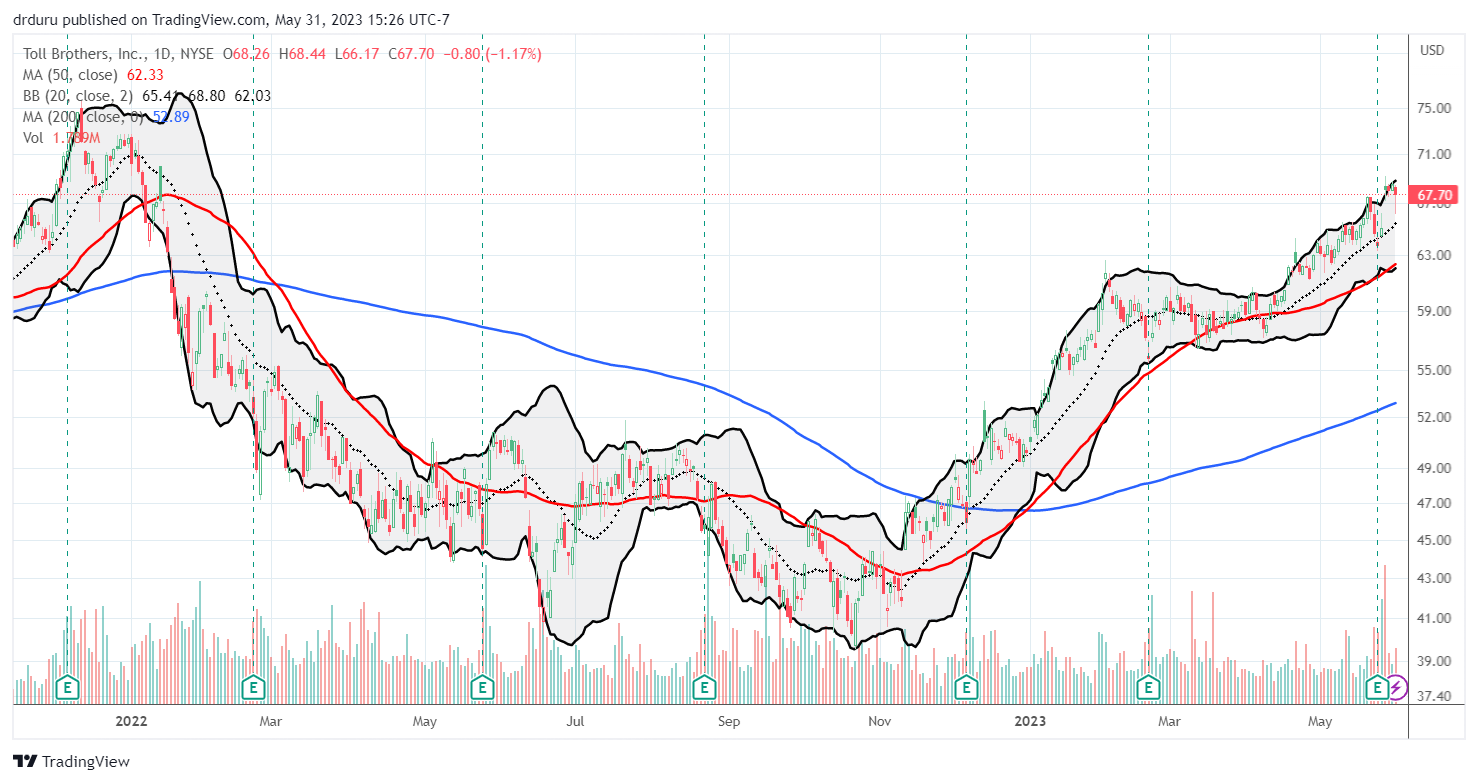
Luxury home builder Toll Brothers (TOL) doubled down on its defiant price action by reporting strong earnings and raising guidance last week. TOL responded with a gap up to a fresh 16-month high. TOL’s defiant uptrend remains well intact for now.
Housing Data
New Residential Construction (Single-Family Housing Starts) – April, 2023
Housing starts increased 1.6% month-over-month to 846,000. Starts decreased 28.1% year-over-year. March’s starts were revised downward to 833,000. The 800K level continues to hang tough as support for starts. However, there is also scant little momentum moving away from that base. The 800K level still looks like a “normalized” level when looking all the way back to 2016.
![US. Bureau of the Census, Privately Owned Housing Starts: 1-Unit Structures [HOUST1F], first retrieved from FRED, Federal Reserve Bank of St. Louis, May 30, 2023](https://drduru.com/onetwentytwo/wp-content/uploads/2023/05/20230530_Housing-Starts.png "Housing starts")
An on-going uptrend in permits continues to suggest that housing starts are not coming back down for the next several months or more. In February, these permits ended a year-long downtrend. Permits in April generated a third consecutively monthly increase with a 3.3% gain.
![Source: U.S. Census Bureau and U.S. Department of Housing and Urban Development, New Privately-Owned Housing Units Authorized in Permit-Issuing Places: Single-Family Units [PERMIT1], retrieved from FRED, Federal Reserve Bank of St. Louis, May 30, 2023.](https://drduru.com/onetwentytwo/wp-content/uploads/2023/05/20230530_single-family-units-authorized-in-permit-issuing-places.png)
For the second straight month, housing starts declined year-over-year in every region except in the Northeast. The Northeast also stood out with an unusual surge in starts in December. The Northeast region’s starts came plunging right back to earth in January and February and have now jumped year-over-year two months in a row. While the region’s starts are very volatile, I was looking for an uptrend to emerge. Instead, it looks like the increases are just a function of particularly depressed starts a year ago.
The West came roaring back for April with a 59.5% month-over-month surge. Starts in the West jumped 60% off the recent lows. While I expected housing starts to improve based on the April builder sentiment data, I definitely did not anticipate a surge making up for lost time! Single-family starts in the South are actually waning and are now a source of concern. Just a month ago, I took heart in total starts as a sign of an overall bottom in builder activity. I now have starts in the South “on watch.” Housing starts in the Northeast, Midwest, South, and West each changed +15.1%, -42.6%, -27.6%, and -29.2% respectively year-over-year.
Existing Home Sales – April, 2023
The sequential decline for existing home sales continued in April.
The seasonally adjusted annualized sales in April of 4.28M decreased 3.4% month-over-month from the 4.43M in existing sales for March (revised slightly downward). Year-over-year sales decreased 23.2%. Existing home sales could still be in the process of stabilizing, but the recent lows need to hold.

(For historical data from 1999 to 2014, click here. For historical data from 2014 to 2018, click here) Source for chart: National Association of Realtors, Existing Home Sales© [EXHOSLUSM495S], retrieved from FRED, Federal Reserve Bank of St. Louis, May 30, 2022.

Inventory finally crossed over the 1 million mark again. April’s absolute inventory level of 1.04M homes increased 7.2% over March and increased 1.0% year-over-year. According to the NAR, “unsold inventory sits at a 2.9-month supply at the current sales pace, up from 2.6 months in March and 2.2 months in April 2022.” Despite the spring selling season helping to motivate inventory, the demand dynamics still suggest a tight market for the existing inventory. In the last two reports, the NAR noted the reemergence of multiple offers on homes. The NAR further explained that for April, “even in markets with lower prices, primarily the expensive West region, multiple-offer situations have returned in the spring buying season.”
Once again a sequential drop in sales did not accompany relief in demand pressures. For example, homes stayed on the market for an even shorter time. It took an average 22 days days to sell a home in April, down from 29 days in March. The average was 34 days in February and 33 days in January. The 73% of homes that sold within a month is up from the 65% in March. The trends in these two metrics indicate a firming baseline of demand that should continue to contribute to a stabilization in the market.
The decline in sales accompanied a third straight month of a sequential increase in price. This increase is a surprise given the increase in inventory, but the price pressure is consistent with the other tight demand dynamics. The median price of an existing home increased 3.6% month-over-month to $388,800 while decreasing 1.7% year-over-year. The year-over-year decline in February ended a record streak of 131 straight months of year-over-year increases. The new downward streak will not live long if sequential price gains continue. The NAR noted that half of the country is experiencing price gains, so the price dynamics are far from uniform across the country.
The share of sales to first-time home buyers increased to 29% from 28% in March and April of last year. So despite the affordability pressures, first-timers continue to step into this market. The NAR’s 2017 Profile of Home Buyers and Sellers reported an average of 34% for 2017, 33% for 2018, 33% for 2019, 31% for 2020, 34% for 2021, and 26% for 2022. The first-time buyer share for 2022 is the lowest on record for the NAR.
All regions declined significantly in sales year-over-year and sequentially with the West continuing to suffer the worst declines. The regional year-over-year changes were: Northeast -23.9%, Midwest -21.5%, South -20.2%, West -31.3%.
Once again the regions were mixed in the pace of year-over-year price changes. The West was the first region to flip negative in January, and it has worsened ever since. This month, the South joined the West in price declines. The regional year-over-year price changes were as follows: Northeast +2.8%, Midwest +1.8%, South -0.6%, West -8.0%.
Single-family existing home sales decreased 3.5% from March and declined on a yearly basis by 22.4%. The median price of $380,000 was down 1.4% year-over-year for single-family existing home sales.
California Existing Home Sales – April, 2023
California existing home sales have underperformed so much this year, that the California Association of Realtors significantly slashed its forecast for 2023. In October, the C.A.R. projected sales to hit 333,450. In the latest sales report, C.A.R. reset that forecast down 16% to 279,900 sales. The C.A.R. nudged up its expectations for the median price by 2.4%. Both adjustments are influenced by tighter inventories which have capped sales and created incrementally more competition for existing inventory. However, demand has also been a little slower than expected given the Fed hiked rates much faster and farther than anticipated back in October.
The Unsold Inventory Index (UII) is up 20% year-over-year while active listings are down 30% year-over-year (the largest drop since the pandemic-driven plunge in May, 2020). A retreat of both buyers and sellers helps explain the crisscross of effects. The fresh competitiveness in the market can be seen from the 20 day average time to sell a home, up 1 day from March but down from 33 days in January. Moreover, the statewide sales-price-to-list-price ratio finally returned to 100.0% with CAR also reporting that the percentage of homes selling above list jumped from 20% in January to 40% in April.
California existing single-family home sales declined for a second month in a row. This weakness in the middle of the spring selling season likely helped to force C.A.R.’s sales forecast down. Sales declined 4.7% from March and a whopping 36.1% year-over-year. C.A.R. noted base effects which drove a spike in sales a year ago as buyers rushed to get ahead of Fed rate hikes. Still, California existing home sales have now languished under the 300,000 mark for 7 straight months.
While sales drooped, prices edged higher. April’s median home price increased 3.0% from March to go over $800,000 for the first time since October (C.A.R. referred to this milestone three times!). The median price is still down 7.8% year-over-year with the tough comparable. The month-over-month price on a square footage basis increased from $388 to $395 and fell from $433 a year ago.
New Residential Sales (Single-Family) – April, 2023
The playbook for maintaining sales created a strong spring selling season for home builders. New single-family home sales increased 4.1% to 683,000 from March’s 656,000 sales (revised downward from 683,000). New single-family home sales soared 11.8% year-over-year as the comparables get easier given the decline into last year’s trough. The on-going uptrend from the July, 2022 bottom is a true testament to the sales pivots builders collectively accomplished even with the Federal Reserve leaning against them.
![US. Bureau of the Census, New One Family Houses Sold: United States [HSN1F], first retrieved from FRED, Federal Reserve Bank of St. Louis, May 30, 2023.](https://drduru.com/onetwentytwo/wp-content/uploads/2023/05/20230530_New-Home-Sales.png "new home sales")
The median price decreased 7.7% month-over-month to $420,800, an 8.2% year-over-year decrease. This plunge almost equaled the same drop from the first full month of the pandemic. Ironically, this decline was the first year-over-year drop of the housing recession. Perhaps unsurprisingly, a tremendous mix shift was at least a partial driver of the big drop. A year ago, 33% of sales occurred at $399,000 or below. This past April that mix surged to 47%. I am guessing a jump in mortgage rates motivated eager buyers to drop to lower price points.
The inventory for new homes stayed steady at 7.6 months of sales. While the market remains above the 6.0 level characteristic of a balanced market, inventories have trended down for some time now.
In March, an unusual surge in the Northeast made it the only region to enjoy a year-over-year increase in sales. Given April’s 46.7% plunge back to the lowest levels since the pandemic, it now looks like a lot of demand was pulled forward into March (spring selling season discounts and incentives?). The Northeast, Midwest, South, and the West changed -46.7%, 20.6%, 23.4%, and -2.8% respectively.
Home Builder Confidence: The Housing Market Index – May, 2023
For the second month in a row, the the National Association of Home Builders (NAHB) ran with a headline emphasizing the lack of inventory as a prime driver of builder sentiment. Builder sentiment improved yet again this time with a surge for HMI to 50, a gain of 5 points. This buoyancy brings to an end the “depression” in sentiment that began in August, 2022. Notably, sentiment went negative just as new home sales bottomed. That negativity did weigh on starts for another 3 months.
A major shift in market share to new homes is likely helping to boost builder sentiment. Per the NAHB (emphasis mine): “New home construction is taking on an increased role in the marketplace because many home owners with loans well below current mortgage rates are electing to stay put, and this is keeping the supply of existing homes at a very low level. In March, 33% of homes listed for sale were new homes in various stages of construction. That share from 2000-2019 was a 12.7% average.”
/Wells Fargo Housing Market Index (HMI) and the University of Michigan Index of Consumer Sentiment")
Source for data: NAHB and the University of Michigan
The HMI bottomed 5 months after consumer sentiment. Now that it looks like consumer sentiment has topped out for now, I expect the HMI to top out in coming months as well. Until then, the rebound in HMI looks quite impressive.
The SF Detached Present and Next Six Months (Seasonally Adjusted) are leading the way higher. The Traffic of Prospective Buyers has not quite kept pace and remains mired in negative sentiment (below 50). Traffic is not likely to make it back to 50 if HMI tops out in coming months as I expect.
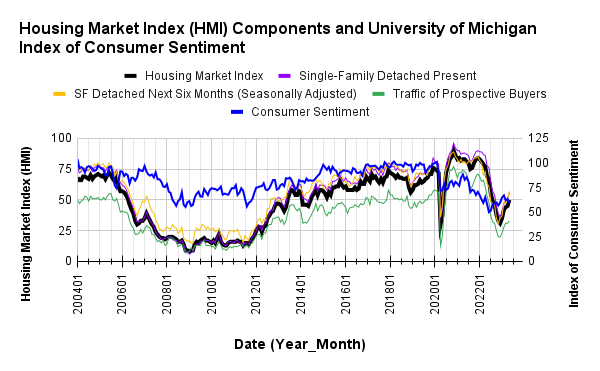
The improved sentiment also shows up in the steady reduction in incentives builders are dishing out. Per the NAHB: “the share of builders reducing home prices dropped to 27% in May, down from 30% in April, 31% in Feb. and March, and 36% last November…54% offered some type of incentive to bolster sales in May, down from 59% in April and 62% last December.”
Each of the four regions made gains in HMI for May. The West made the most impressive gains with a 20% jump from 40 to 48. The South gained 10% from 50 to 55 so perhaps starts in the South will get a fresh boost in the next month, especially with the solid move above the 50 level. The North increased from 44 to 45. The Midwest increased from 40 to 42.
Home closing thoughts
Spotlight on Mortgage Rates
The 30-year fixed rate mortgage looked like it had stabilized last month. However, the last down cycle on rates did not quite match the prior low. As a result, the current meandering higher looks like it could lead to new highs on mortgage rates. This prospect is particularly likely given the likelihood for the Fed to hike rates at least one more time before it is ready to pause. While buyers seem to be getting accustomed to the “new normal” of higher rates, they remain highly sensitive to changes in rates. I fully expect a jump to or past the 7% level to cause a fresh freeze on sales.
The Mortgage Bankers Association (MBA) reported decreases in mortgage applications 4 out of 5 weeks in May including a current 3-week losing streak. The commentary in the latest MBA report suggests that sales will soon show a slowdown along with 7%+ mortgage rates.
“Mortgage rates for conforming, balance 30-year loans were being quoted above 7 percent by some lenders last week, and the weekly average at 6.9 percent reached the highest level since last November…Application volumes for both purchase and refinance loans decreased last week due to these higher rates. While refinance demand is almost entirely driven by the level of rates, purchase volume continues to be constrained by the lack of homes on the market.”
![Source: Freddie Mac, 30-Year Fixed Rate Mortgage Average in the United States [MORTGAGE30US], retrieved from FRED, Federal Reserve Bank of St. Louis, March 31, 2023](https://drduru.com/onetwentytwo/wp-content/uploads/2023/03/20230331_30-Year-Fixed-Rate-Mortgage-Average-US.png)
Still Defiant at 7%+ Mortgage Rates?
Redfin’s (RDFN) last report on the housing market gives some early warnings on what the housing market faces with 7%+ mortgage rates. At the time of the report, daily mortgage rates hit 7.12%. The 6.57% weekly average led to a record-high mortgage payment of $2,614 (presumably at the national median price point). This affordability squeeze is suppressing demand: “Pending home sales dropped 17.4% nationwide from a year earlier during the four weeks ending May 21, the second-biggest dip since January (the biggest was a 17.5% decline in early April).” This surge in rates is also putting potential sellers on pause with a 24% year-over-year plunge in active listings.
On the other hand, Redfin also reported that luxury home buyers appear “unfazed.” This observation aligns with the strong performance from Toll Brothers.
I expect housing metrics overall to worsen rapidly with rates sustained over 7%.
Be careful out there!
Full disclosure: long ITB, short RDFN