Stock Market Commentary:
In the previous week, the stock market put on a display of strength ahead of the Federal Reserve’s May decision on monetary policy. That bravado was temporarily undermined by the final blow to First Republic Bank (FRC). After a one-day pause, presumably to contemplate the implications of the lack of a coherent policy on saving the regional banking system, sellers took the S&P 500 down 1.2%. The index lost 0.7% after the Fed decision to hike rates yet again. The S&P 500 lost another 0.7% the following day. Yet, Apple Inc (AAPL) saved the week with a 4.7% post-earnings surge. Apple drags the market with a domineering $2.75T market cap. In this case, Apple dragged the market higher despite another jobs report that was strong enough to keep the Fed on-message with its hawkishness.
The jobs report for April was so strong, that the unemployment rate for Black workers even dropped to an all-time low. So many pundits and economists have pooh-poohed the jobs reports over the past year and more as a lagging indicator of economic health. Dismissing the relevance of the jobs report was helpful when explaining why the Fed did not need to hike rates to fight inflation (Cathy Wood). Now the jobs report must be dismissed while explaining how the Fed is running the economy into the ground (almost everyone). This persistent job creation month-after-month must be particularly troubling for this crowd.
On the other side of the gallery is a Wall Street anxiously awaiting the recession that can convince the Fed to step down from its hawkishness. Whenever a recession finally arrives, the entire group will surely say “I told you so” even as this whole episode clearly demonstrates that conventional descriptions of the economy simply do not work in this moment. No wonder the stock market is all mixed-up.
The Stock Market Indices
The S&P 500 (SPY) looked ready for a test of support at its 50-day moving average (DMA) (the red line). I was also ready to take profits on my SPY put spread at that point. Buyers had other ideas. AAPL helped gap the S&P 500 higher and into a close above the 20DMA (the dotted line). The resulting 1.9% gain drop kicked my put spread right back into the red. I held on Thursday expecting that the S&P 500 would surely continue lower to 50DMA support and perhaps beyond. Time is now ticking on this position. Meanwhile the index looks like it might develop a new trading range between the 2023 high and the vicinity of the 50DMA.
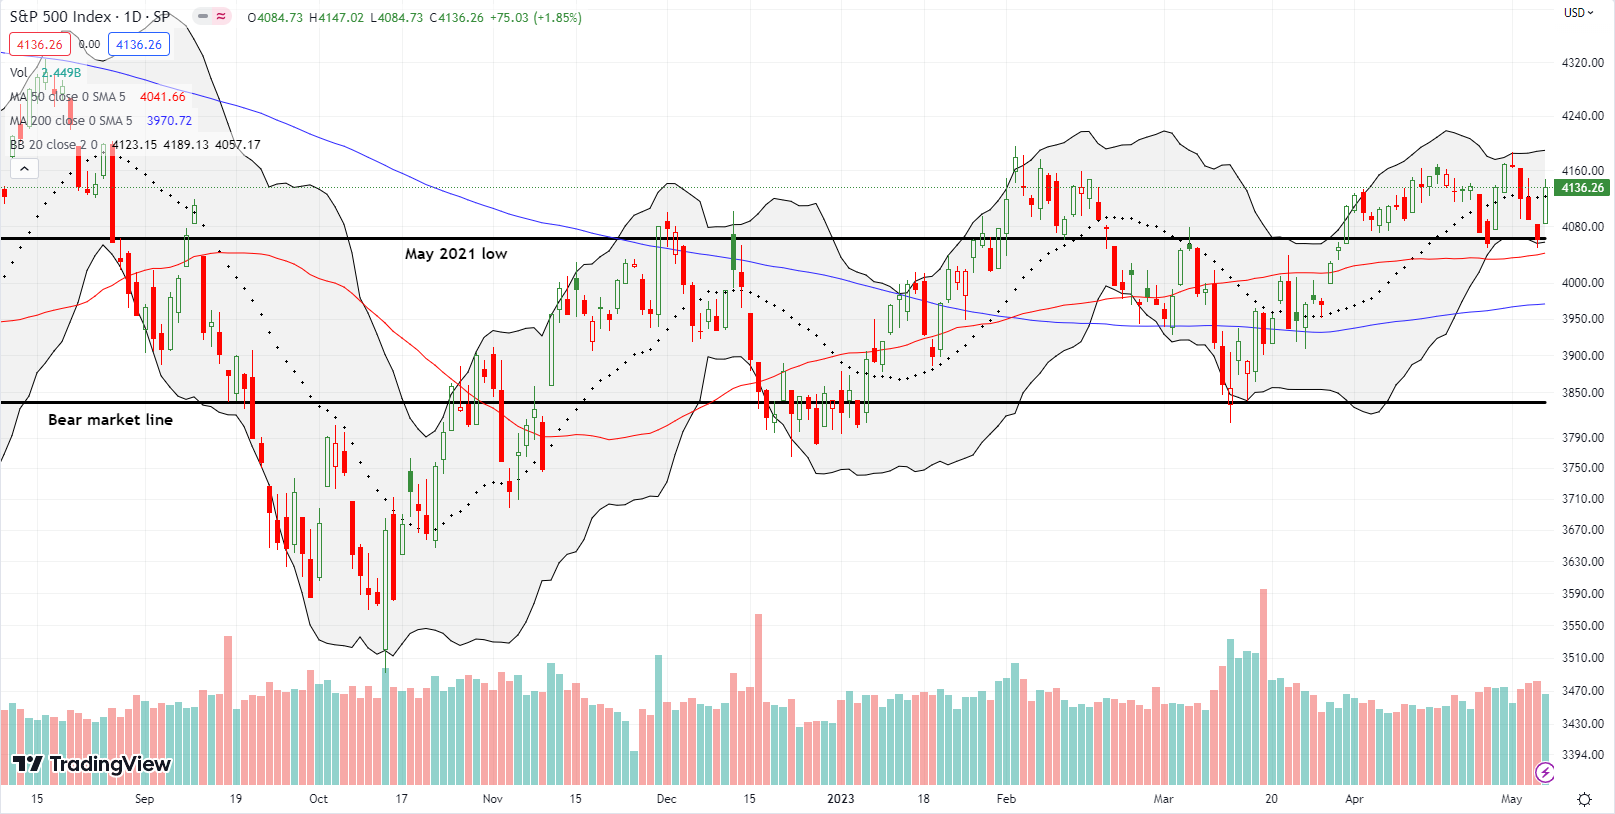
The compelling technical pattern shown below helped to convince me to hold on to my SPY put spread. I call it the buzzsaw. Note how uptrends come to a sudden and abrupt end. The downtrends end after a bit of work. Along the way, trading is choppy and cuts up anyone that overstays their welcome.
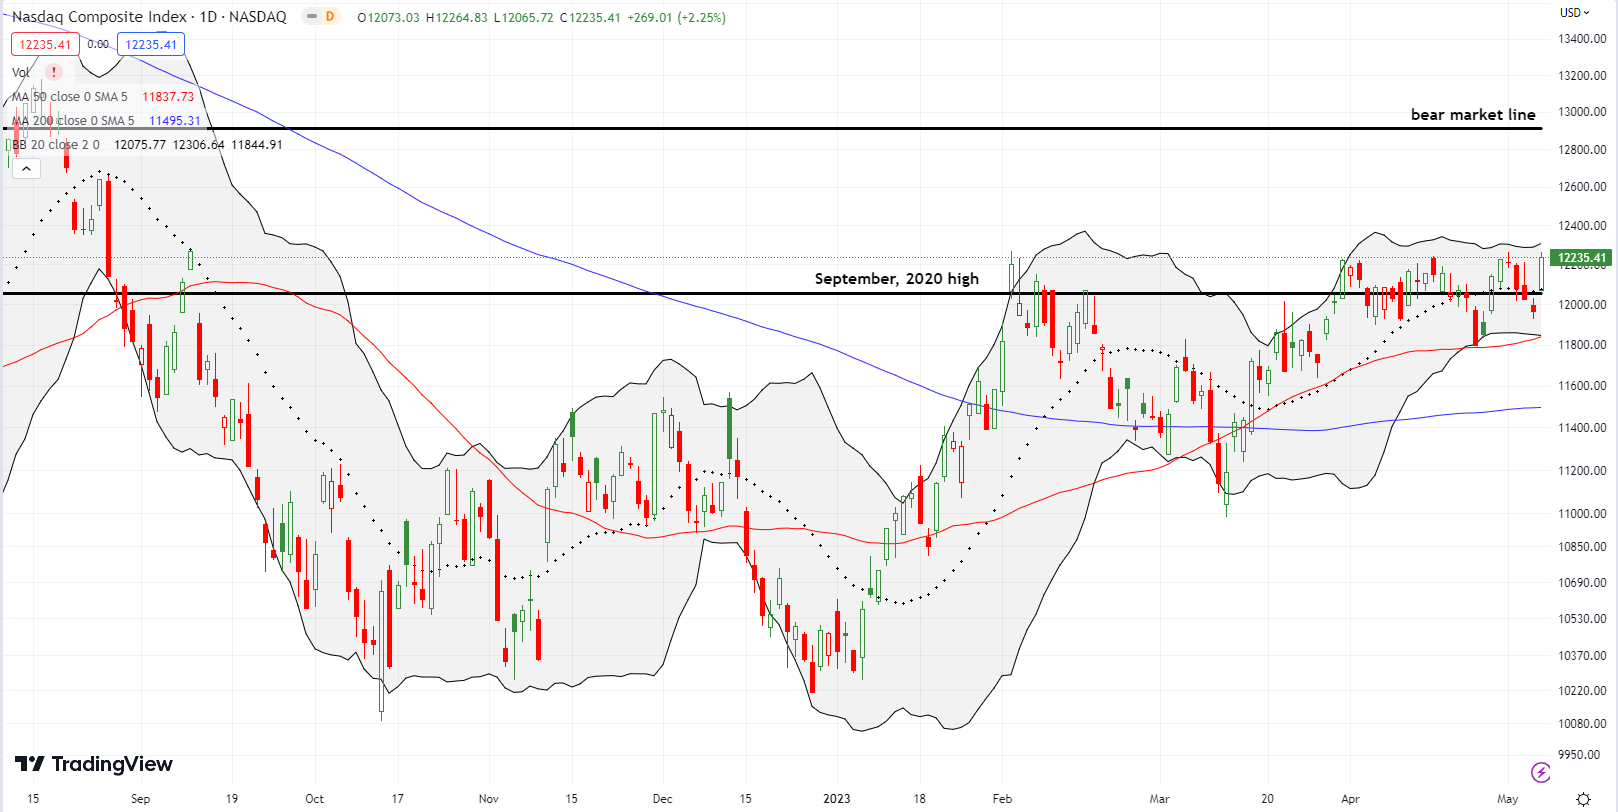
The NASDAQ (COMPQ) stopped far short of 50DMA support for this cycle. Instead, the September, 2020 high became more important. A day after gapping below that support, the tech laden index soared 2.3% and closed at a marginal 8-month high. The NASDAQ has failed since late March to make further progress from these levels. Thus, follow-through buying from here will be a bullish signal.
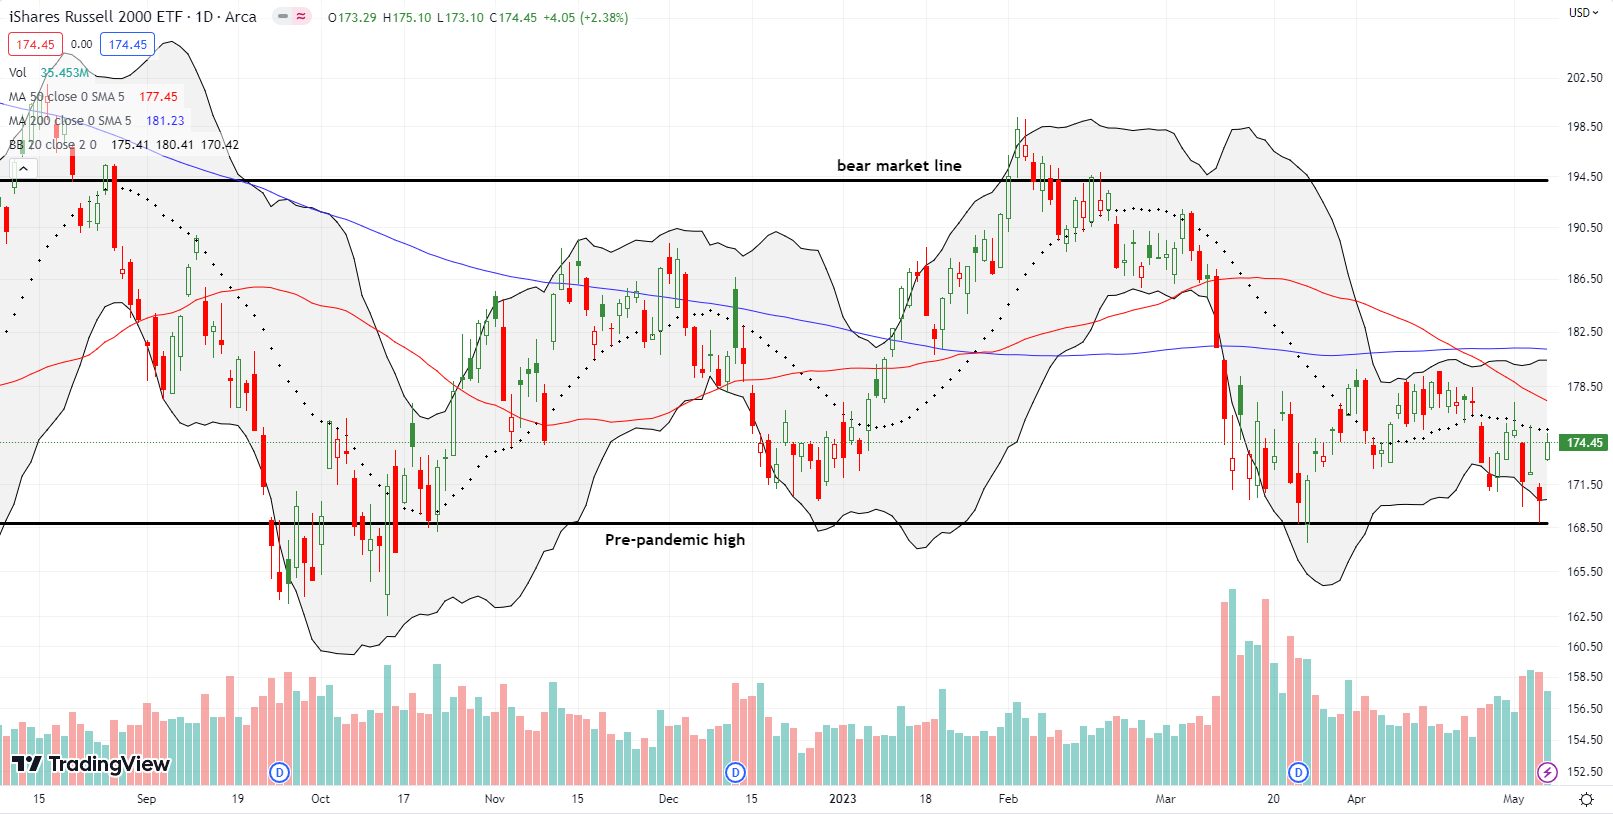
The iShares Russell 2000 ETF (IWM) tested support at the pre-pandemic high on the first post-Fed day. I jumped on a call spread at that point. The position paid off the very next day with IWM gapping higher. IWM tested 20DMA resistance before settling for a 2.4% gain. I immediately took profits; I was not expecting an instant payoff.
Stock Market Volatility
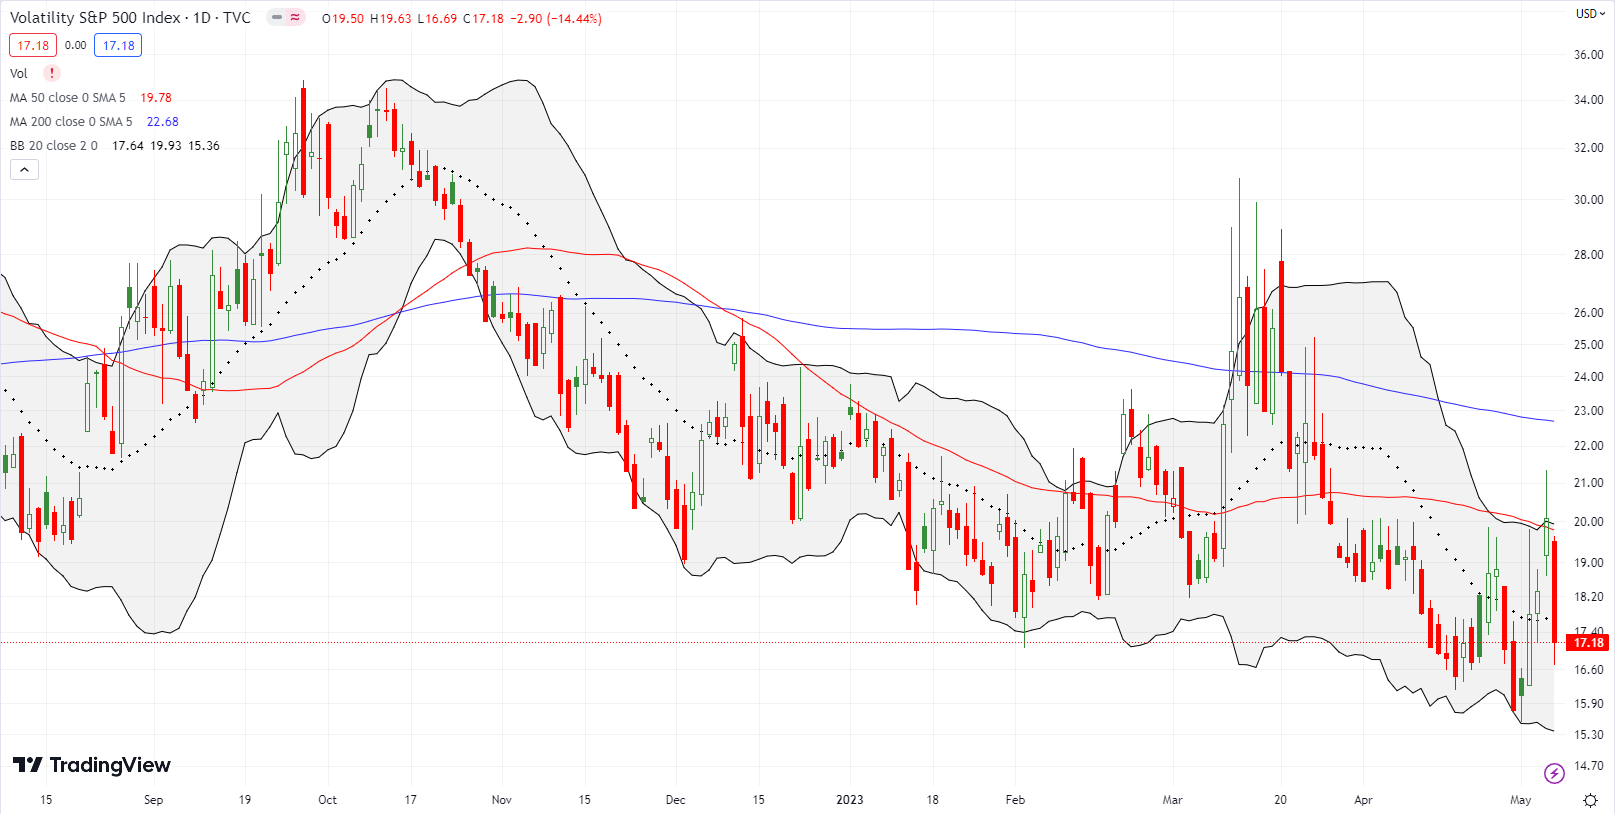
The volatility index (VIX) ended the week with a net gain, but faders were predictable in the response to the Fed meeting. On the first post-Fed day, the VIX soared as high as 21.3 before faders pushed it back to the critical 20 level. The next day, the VIX plunged 14.4%. I finally decided to join the faders, especially given fading the VIX is a partial hedge on going long (put) options. Accordingly, I promptly bought a iPath Series B S&P 500 VIX Short-Term Futures ETN (VXX) put option on Thursday (added to an existing position). I should have shorted VXX outright, but I only realized I could do so late on Friday.
The Short-Term Trading Call With Apple Drags
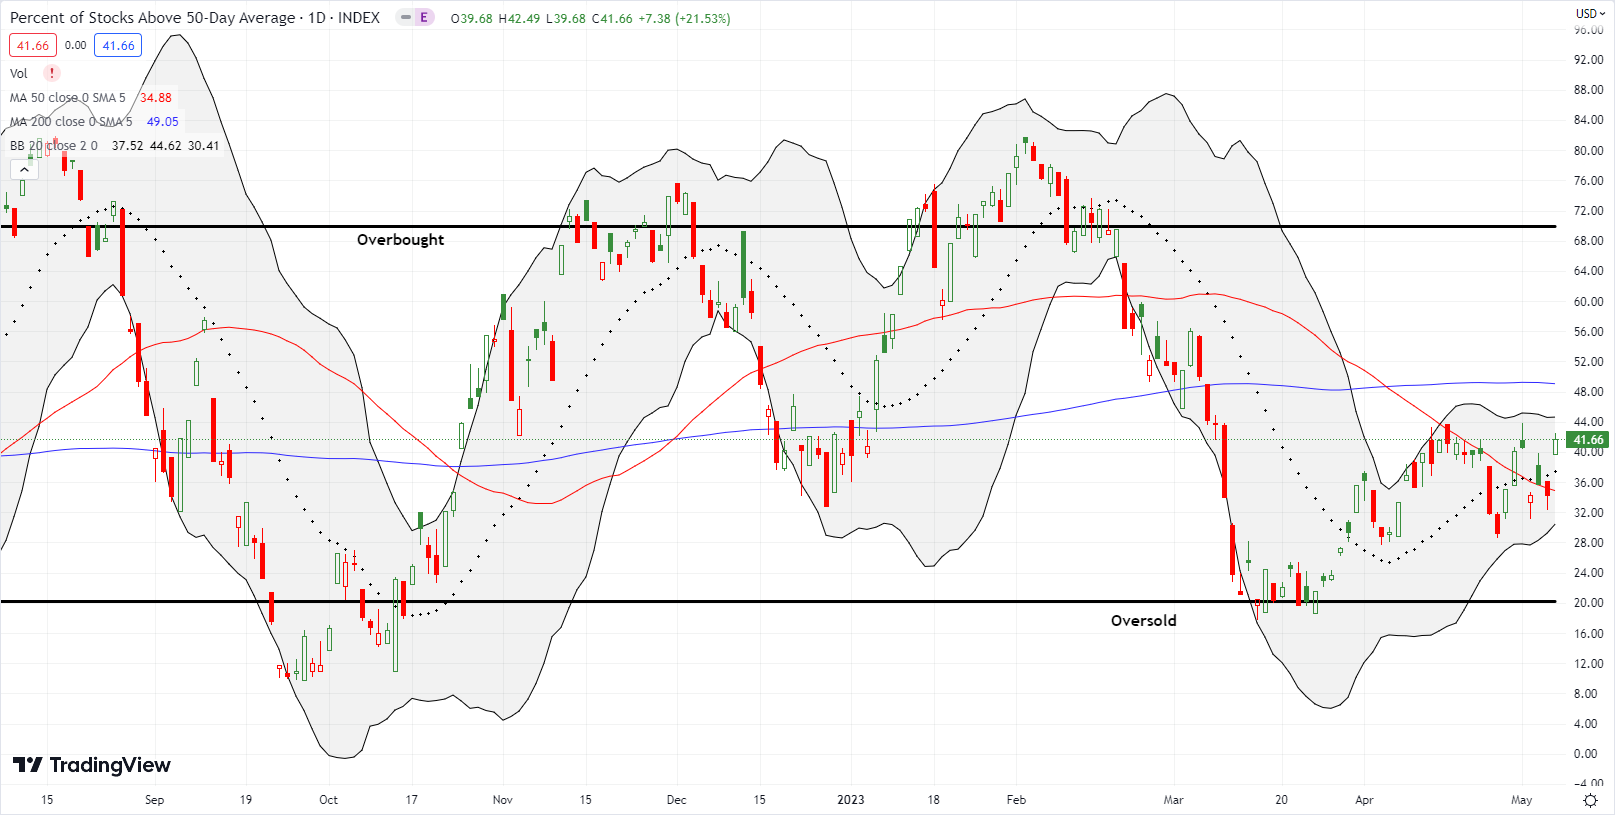
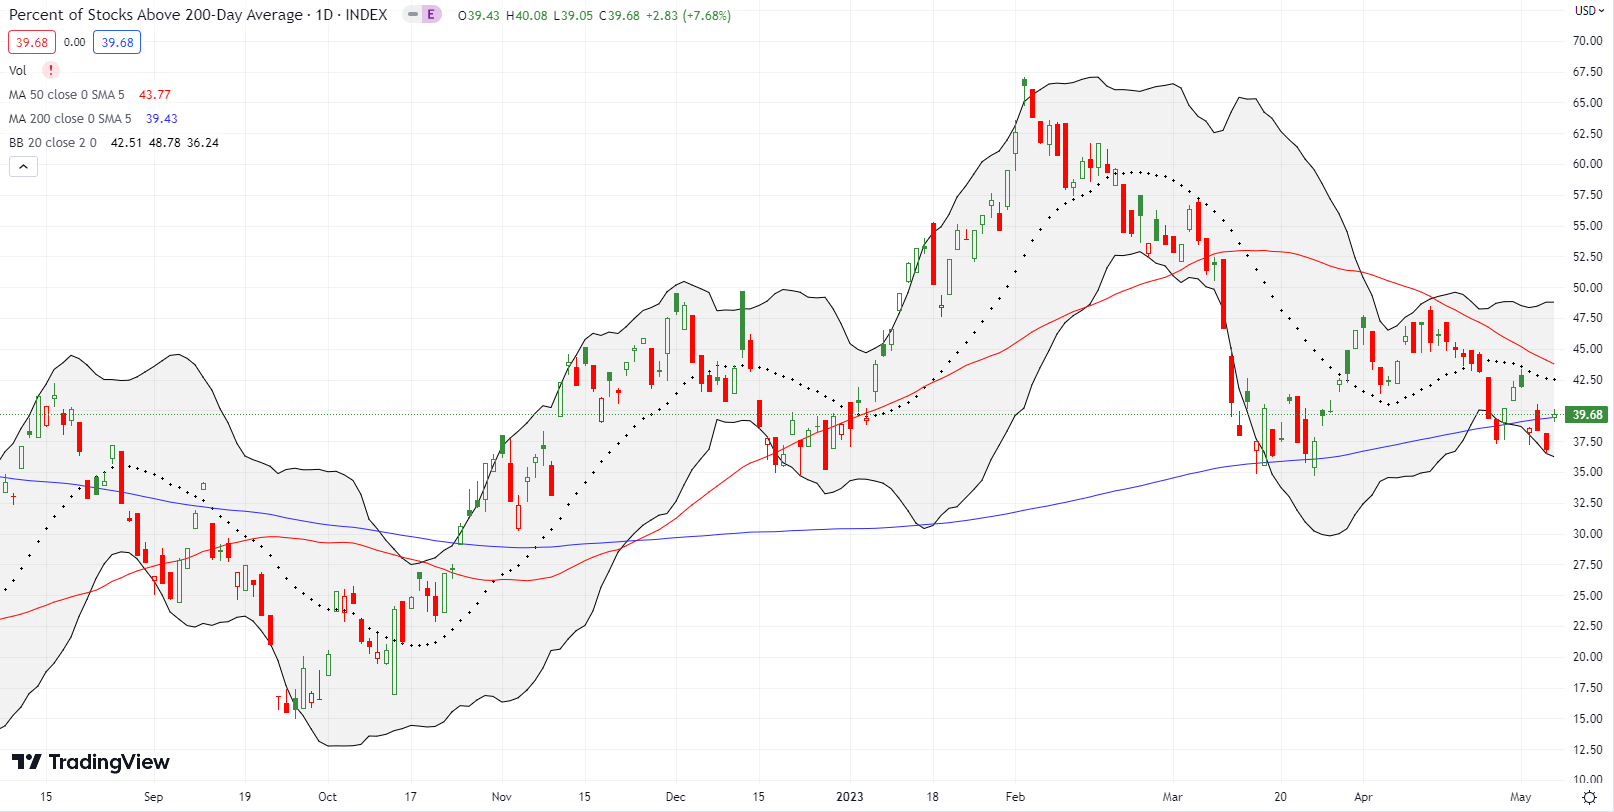
- AT50 (MMFI) = 41.7% of stocks are trading above their respective 50-day moving averages
- AT200 (MMTH) = 39.7% of stocks are trading above their respective 200-day moving averages
- Short-term Trading Call: neutral
AT50 (MMFI), the percentage of stocks trading above their respective 50DMAs, closed the week at 41.7%. My favorite technical indicator has chopped around in a range for the past two weeks but this time managed to close at a marginal 2-month high. Perhaps more importantly this time, AT200 (MMTH), the percentage of stocks trading above their respective 200DMAs, remains trapped in a looming downtrend. In other words, the short-term market breadth remains resilient, but the longer-term market breadth is slowly but surely eroding. This short-term vs long-term divergence is a warning. Yet, there is no way to know how or when this growing gulf will result in a notable sell-off. In the meantime, I expect a continuation of a mixed-up market….at least to the extent Apple drags fail to work.
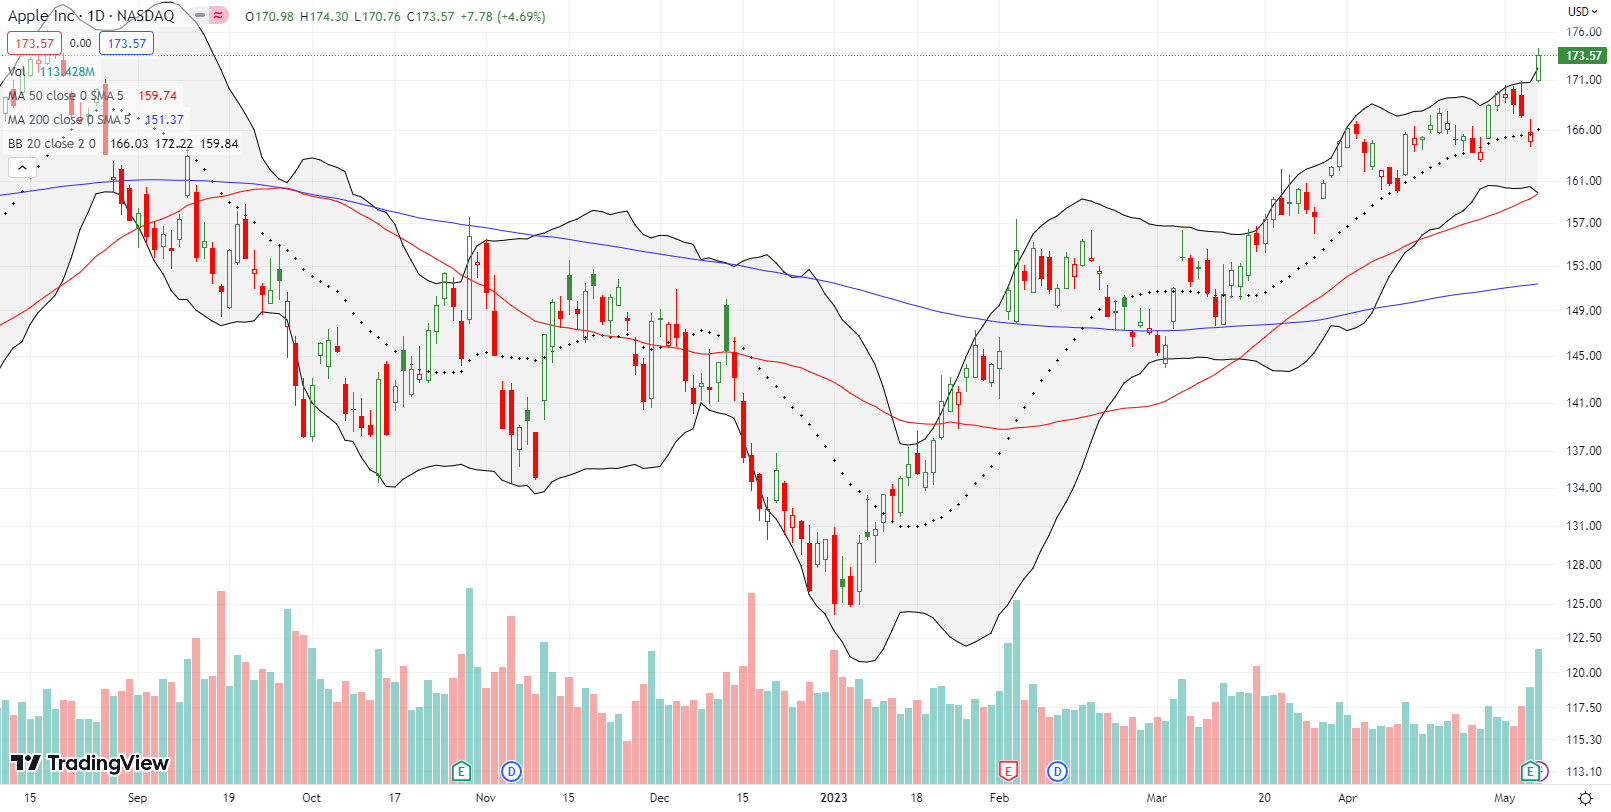
Apple Inc (AAPL) was the stock story of the day. Despite relatively weak financial performance, buyers apparently got excited about Apple’s goodie basket of increased dividends and buybacks. (I wish some of that cash would instead go toward lower prices for iPhones!). AAPL perfectly launched off 20DMA support and closed above its upper Bollinger Band (BB). This sign of strength generated a 4.7% gain and a 9-month high. Something tells me AAPL will soon drift back toward its 20DMA uptrend, but I will not bet on it!
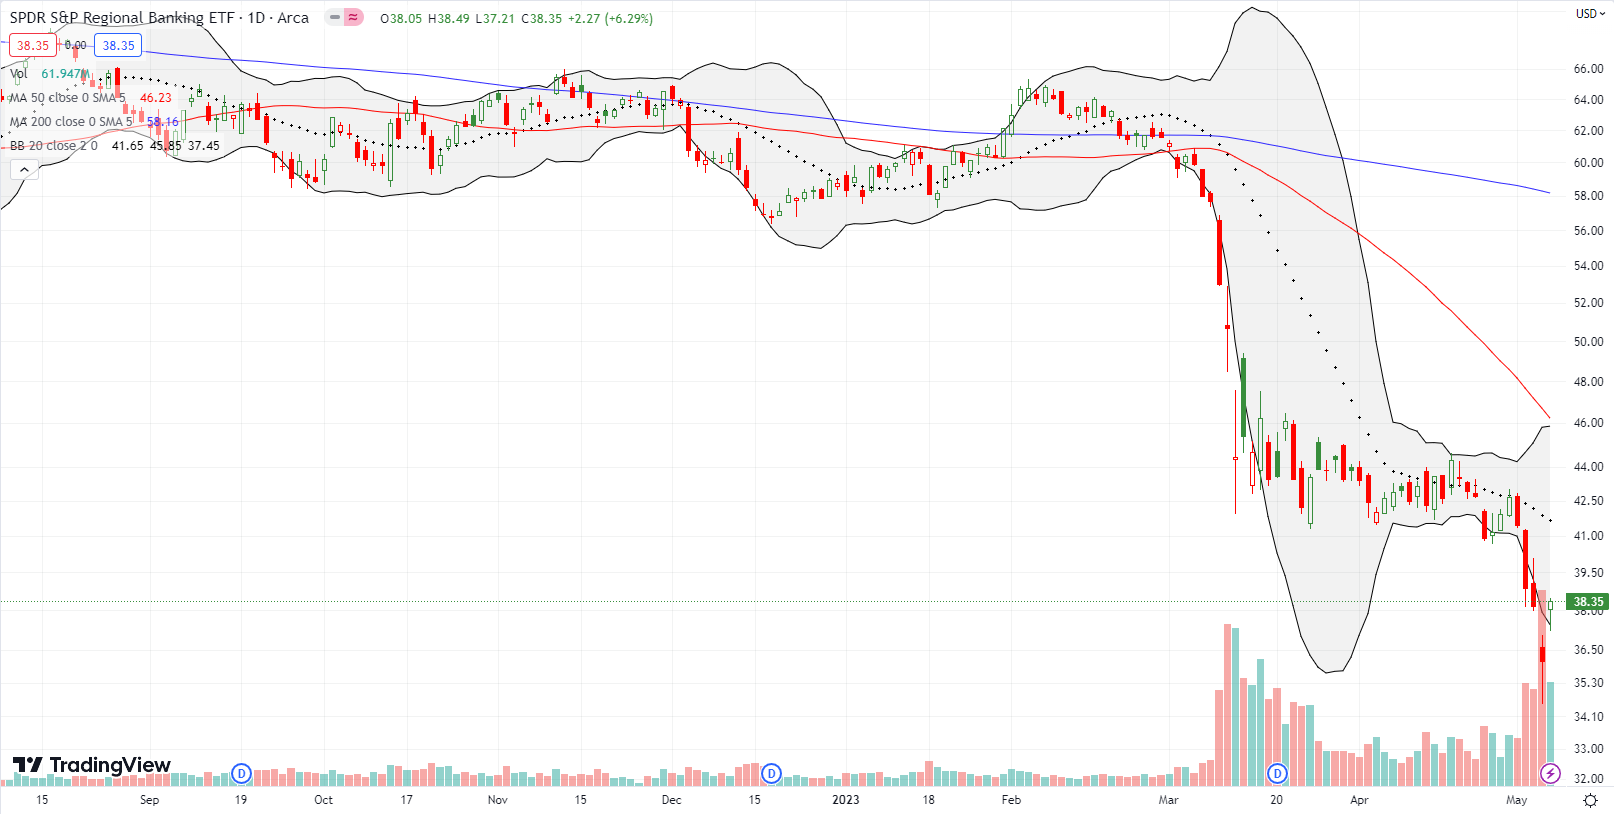
While tech investors are enjoying safety in numbers, investors in regional banks continue to suffer mightily. The SPDR S&P Regional Banking ETF lost 10.1% for the week in the wake of the resolution and sale of First Republic Bank (FRC) to JP Morgan Chase (JPM). Yet, sellers took no solace or encouragement from CEO Jamie Dimon’s declaration that “this part of the crisis is over.” Sellers took down their next targets on Tuesday. For good measure, they doubled down on the pressure the day after Fed Chair Powell reiterated Dimon’s hopeful claim: “I think that the resolution and sale of First Republic kind of draws a line under that period of — is an important step toward drawing a line under that period of severe stress.”
KRE’s 5.5% plunge generated the largest trading volume since the regional banking crisis began. I interpreted that extreme event as a buying signal. While I did not dare buy any beaten up banks, I did buy KRE calls. I sold immediately into the gap up the next day. KRE finished Friday with a 6.3% gain. Banks like PacWest Bancorp (PACW) practically closed the previous day’s gap down with an eye-popping 81.7% gain!
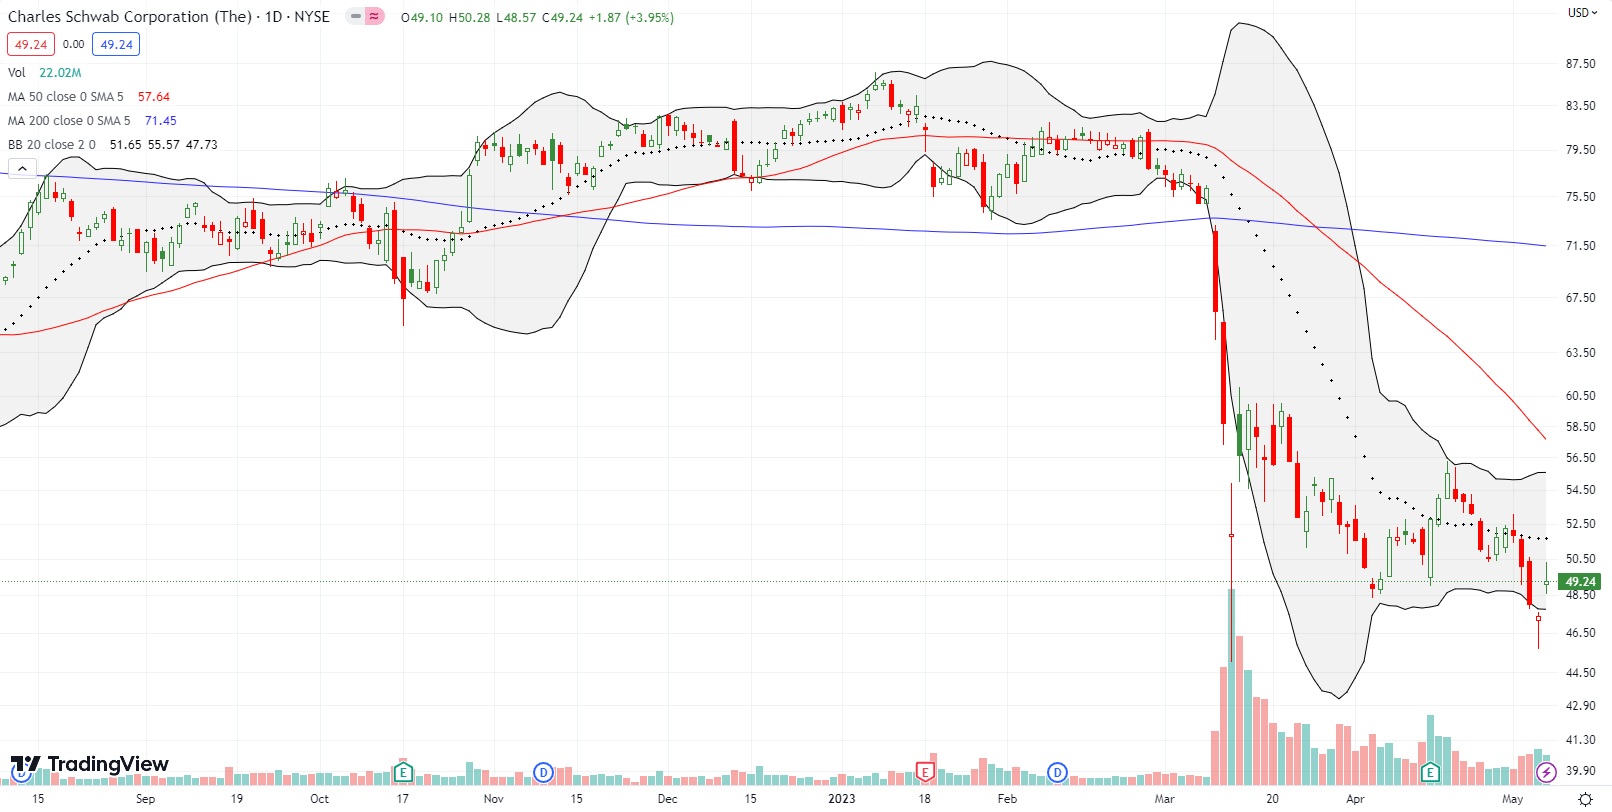
The extreme trading in KRE made me look at other victims of the rolling panic in financials. Charles Schwab Corporation (SCHW) was trading well below its lower Bollinger Band, yet closed the day where it opened: a classic bottoming hammer pattern. That pattern was confirmed with Friday’s 4.0% gain. I jumped into a May call option as a play on some follow-through buying from here. Given the on-going panic, I assume the potential upside is limited, perhaps to last month’s high.
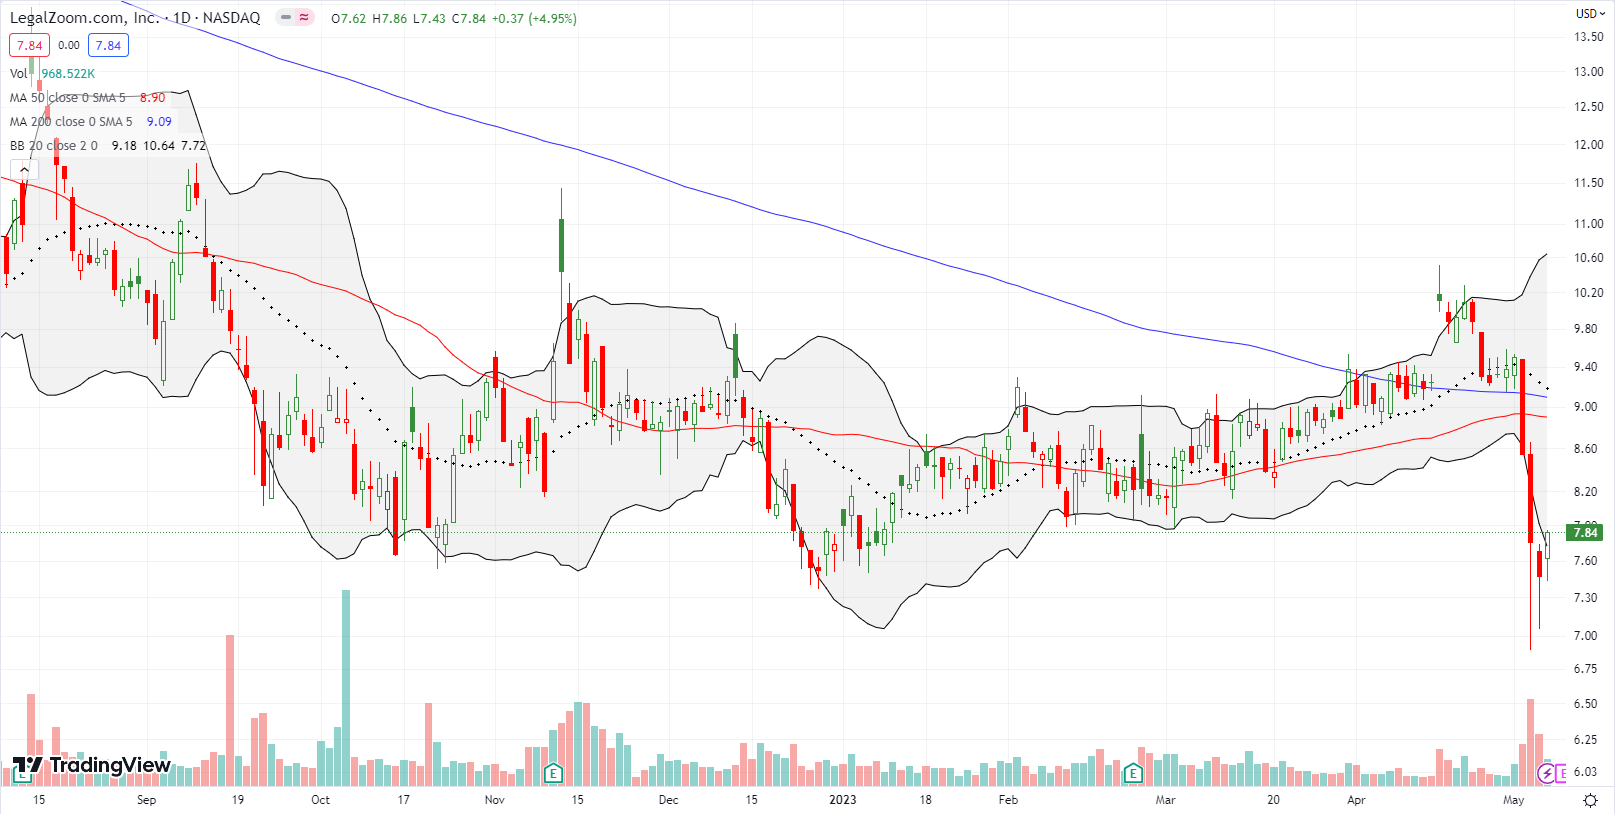
Speaking of panic, sellers went wilding on LegalZoom.com Inc (LZ). Just two weeks ago, I gushed over the impressive technical pattern and even recently wrote a more complete bullish thesis on Seeking Alpha. While I have yet to see news explaining the collapse, I assume investors are panicking about the potential negative impact of ChatGPT on LegalZoom.com’s business in the wake of the ChatGPT hit Chegg (CHGG) took post-earnings (more on that another time). If so, I think the concerns are misplaced and overblown. Accordingly, I bought call options and more shares. So far, so good as LZ is printing a bottoming process characteristic of a seller’s exhaustion. Two straight days of long tails were followed by a solid up day, all on high trading volume.
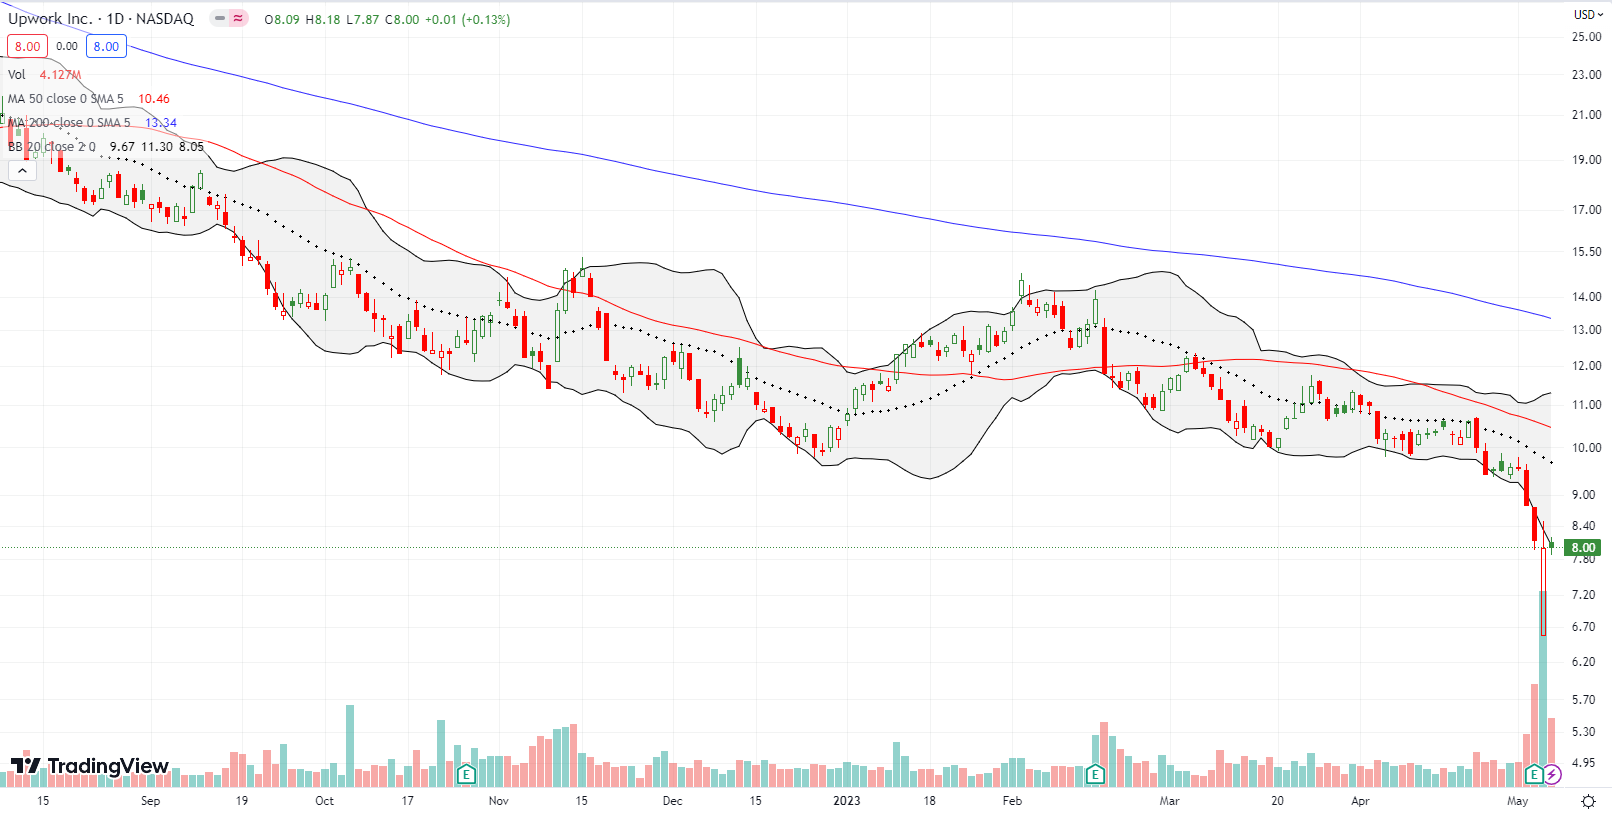
Upwork, Inc (UPWK) joined the ranks of mixed-up market reactions to fundamental news. UPWK opened post-earnings down by 19.1%. After the dust settled, UPWK managed to close the day FLAT. At one point, UPWK was even up for the day. Trading volume was extreme; thus, it is very possible motivated sellers have finally washed themselves of UPWK. Given I am a fan of the company, I have monitored UPWK for the next buying opportunity. A close above the post-earnings intraday high would give me the go-ahead sign.
Be careful out there!
Footnotes
Subscribe for free to get email notifications of future posts!
“Above the 50” (AT50) uses the percentage of stocks trading above their respective 50-day moving averages (DMAs) to measure breadth in the stock market. Breadth defines the distribution of participation in a rally or sell-off. As a result, AT50 identifies extremes in market sentiment that are likely to reverse. Above the 50 is my alternative name for “MMFI” which is a symbol TradingView.com and other chart vendors use for this breadth indicator. Learn more about AT50 on my Market Breadth Resource Page. AT200, or MMTH, measures the percentage of stocks trading above their respective 200DMAs.
Active AT50 (MMFI) periods: Day #30 over 20%, Day #4 over 30%, Day #1 over 40%, Day #43 under 50%, Day 53 under 60%, Day #55 under 70%
Source for charts unless otherwise noted: TradingView.com
Full disclosure: long QQQ put spread; long SPY put spread, long VXX call spread, put spread, and puts, long CHGG, long LZ shares and calls, long SCHW call
FOLLOW Dr. Duru’s commentary on financial markets via StockTwits, Twitter, and even Instagram!
*Charting notes: Stock prices are not adjusted for dividends. Candlestick charts use hollow bodies: open candles indicate a close higher than the open, filled candles indicate an open higher than the close.


