

Stock Market Commentary:
Jerome Powell, and the Federal Reserve, remained resolute with the anti-inflation rhetoric. The stock market hated it. Slowing growth, recession fears, and hopes for “peak inflation” are still not producing the result Wall Street wants: a Federal Reserve backing down from monetary tightening, also known as “the pivot.” The bears seized the opportunity in disappointment by pushing bulls down the Jackson Hole.
In his remarks at the annual confab, Powell did his best to make the Fed’s hawkishness abundantly clear: “Today, my remarks will be shorter, my focus narrower, and my message more direct…Restoring price stability will likely require maintaining a restrictive policy stance for some time. The historical record cautions strongly against prematurely loosening policy.” Powell went on to caution us that the work ahead will “bring some pain to households and businesses,” but such is the cost for longer-term price stability. For the “peak inflation” crowd, Powell warned that “high inflation has continued to spread through the economy.” There was nothing nice in Jackson Hole. The market’s accompanying plunge underlined the dour news.
The Stock Market Indices
With a 3.4% loss, the S&P 500 (SPY) plunged its way into a reversal of July’s bullish breakout above the May, 2021 low. The failed test of resistance at the 200-day moving average (DMA) (the blue line) is a distant memory. With the lower Bollinger Band (BB) opening downward, gravity is tugging hard on the S&P 500 and guiding it to an important test of uptrending 50DMA (the red line below) support. A breakdown below the 50DMA would push the index further down the hole toward a test of the bear market line. Recall that a bear market defines as a 20% loss from an all-time high.
")
The NASDAQ (COMPQ) is already in the hole with a bear market fully entrenched. The uptrending 50DMA is converging on important support from the September, 2020 high. A breakdown below here would push the tech-laden index even deeper in the hole and set up an eventual test of the June low.
")
The iShares Russell 2000 ETF (IWM) sank deeper into the hole of a bear market with a 3.3% loss. The plunge ended a 1-day fakeout above the bear market line. Now the ETF of small caps looks set to test uptrending 50DMA support. Per my short-term trading call, I faded IWM after it rallied off Monday’s drop with a September $190/$180 put spread. (I am still open to flipping into a buy at the 50DMA).
")
Stock Market Volatility
The volatility index (VIX) left no doubt that its downtrend ended last week. A 17.3% surge broke out the VIX to a 5-week high. If not for the extreme one day move, I would expect a swift drive toward the June highs. Instead, the temptation for the VIX faders may be large enough to knock the VIX down before it can continue higher.
")
The Short-Term Trading Call for a Push Down the Jackson Hole
- AT50 (MMFI) = 60.9% of stocks are trading above their respective 50-day moving averages (ended 1-day overbought period)
- AT200 (MMTH) = 32.5% of stocks are trading above their respective 200-day moving averages
- Short-term Trading Call: bearish
AT50 (MMFI), the percentage of stocks trading above their respective 50DMAs, dropped almost 13 percentage points from a 1-day overbought period. That return to overbought conditions was a big fakeout. The market’s rebound into Powell’s speech at Jackson Hole was a bizarre sight and seemed to imply buyers knew “something.” By the time Powell dropped the hammer, buyers had spent up the fuel needed to brace against the push of the bears.
Friday’s selling was so extreme that a Monday rebound will not surprise me. However, my short-term trading call remains firmly bearish. I remain inclined to fade rallies. I was hoping for a rally continuation on Friday for fresh fade opportunities. Instead, I rushed into Sept $95 put options on Industrial Select Sector SPDR Fund (XLI) given its fresh 200DMA breakdown. Given the premium I paid, I paired that position with a $230/$240 call spread on VanEck Semiconductor ETF (SMH) given its test of 50DMA support. I set up this pairs trade for quickly taking profits on SMH in case of a sharp relief rally rebound. The XLI puts should increase in value rapidly if the sell-off continues next week.
Overall, I remain net bearish in my short-term positioning. My next round of profit-taking to the downside will come on tests of support. I will also refresh bearish trades on confirmed breakdowns below these support levels.
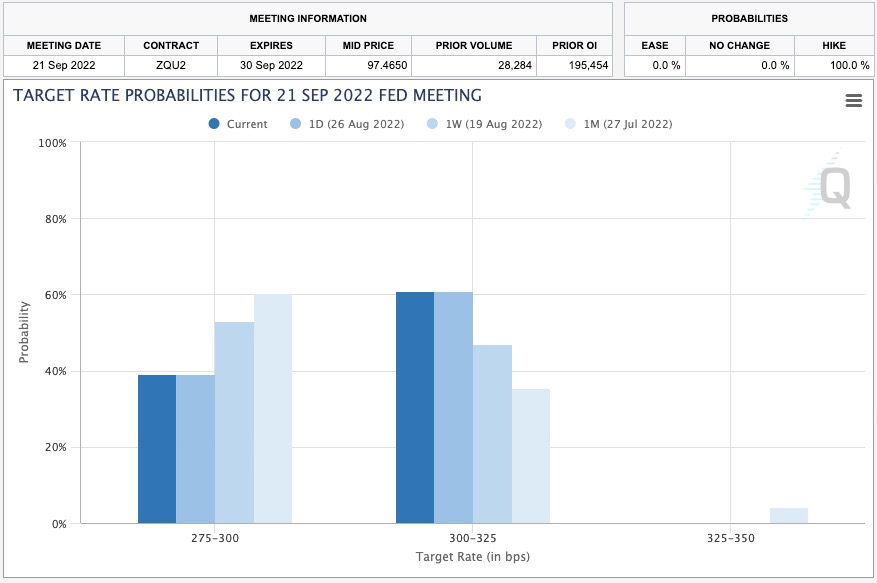
The bearish push down Jackson Hole sharply adjusted rate expectations for 2023. The CME FedWatch now shows a 61% chance for a 75 basis points hike in September and no expectations for a rate cut next year. A week prior the market assigned a 53% chance for a 50 bps rate hike. The market is taking Powell seriously again for now.
With Powell projecting economic pain in the short-term, ain’t nothin’ goin’ on but the rent (shout out to Gwen Guthrie)…
")
")
Be careful out there!
Footnotes
“Above the 50” (AT50) uses the percentage of stocks trading above their respective 50-day moving averages (DMAs) to measure breadth in the stock market. Breadth defines the distribution of participation in a rally or sell-off. As a result, AT50 identifies extremes in market sentiment that are likely to reverse. Above the 50 is my alternative name for “MMFI” which is a symbol TradingView.com and other chart vendors use for this breadth indicator. Learn more about AT50 on my Market Breadth Resource Page. AT200, or MMTH, measures the percentage of stocks trading above their respective 200DMAs.
Active AT50 (MMFI) periods: Day #39 over 20%, Day #33 over 30%, Day #26 over 40%, Day #26 over 50%, Day #20 over 60%, Day #1 under 70% (ending 1 day overbought)
Source for charts unless otherwise noted: TradingView.com
Full disclosure: long QQQ put spread, long IWM put spread, long XLI puts, long SMH call spread
FOLLOW Dr. Duru’s commentary on financial markets via StockTwits, Twitter, and even Instagram!
*Charting notes: Stock prices are not adjusted for dividends. Candlestick charts use hollow bodies: open candles indicate a close higher than the open, filled candles indicate an open higher than the close.
2 thoughts on “Bears Push Bulls Down the Jackson Hole – The Market Breadth”