
Housing Market Intro and Summary
The fresh hope from a peak in mortgage rates has expanded into an ever stronger spring selling season for the housing market. Despite double digit year-over-year declines keeping existing home sales and housing starts in recessions, new home sales have almost reversed all their losses since the Fed started hiking interest rates in March, 2022. Recent stabilization in the housing data, including pockets of notable strength in the South and the Northeast, all support this bullish reversal in sales. The housing market has apparently built up a resiliency in the given current macro-economic environment.
Of course, the market has yet to get tested in an economy-wide recession, but the current performance increases hopes for a mild recession if one arrives later this year. In the meantime, anecdotes of multiple offers on homes in certain markets, on-going scarce inventories of existing homes, and mild price declines all combine to buttress housing market sentiment and support market stability. The resulting strong earnings reports from home builders have sent some shares to or close to all-time highs.
Housing Stocks
The uptrend in iShares US Home Construction ETF (ITB) accelerated in April. The run-up reached a parabolic pace after two straight closes above the upper Bollinger Band (BB) (the curvy black line in the chart below) was followed by a gap up and 1.7% gain. Parabolic moves are dangerous and often signal the end of an uptrend. However, the uptrend in ITB is so strong that buying resumed after a brief 2-day pullback. The selling did not even bring ITB back to its 20-day moving average (DMA) uptrend (the dotted line below). I thought the parabolic move might bring an end to the seasonal trade on homebuilders. Instead, ITB’s close at a fresh 15-month high indicates the trade remains alive and well!
")
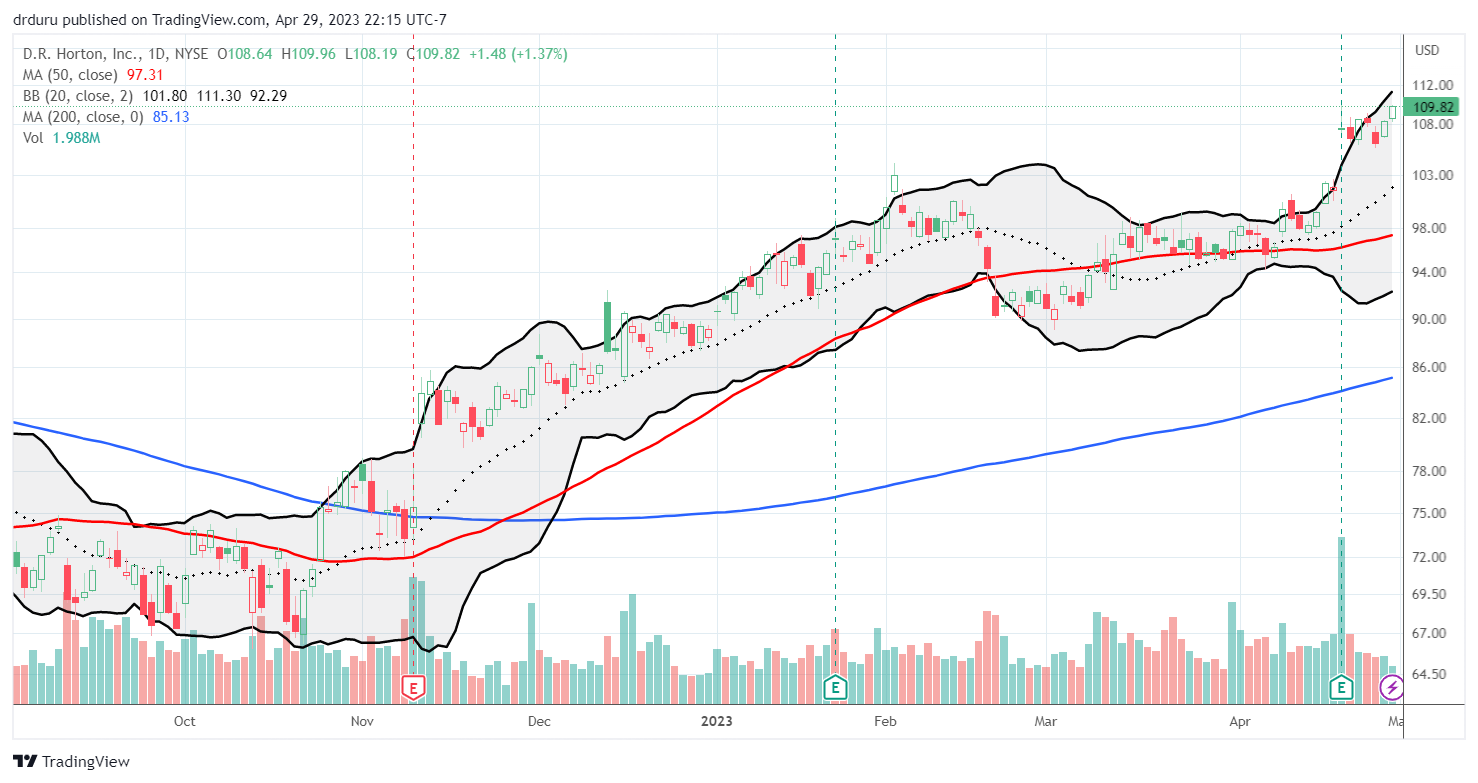
D.R. Horton (DHI) helped drive the parabolic move in ITB with a 5.6% post-earnings gain. The buying is so strong in DHI that the stock closed at two more all-time highs after the big move. DHI looks well-positioned to continue to rally absent sudden shocks in the market. The all-time high underlines and confirms the bullish reversal in new home sales.
Housing Data
New Residential Construction (Single-Family Housing Starts) – March, 2023
Housing starts increased 4.1% month-over-month to 861,000. Starts decreased 29.7% year-over-year. February’s starts were revised downward to 838,000. The 800K level continues to hang tough as support for starts. Builders are seemingly defying the odds of for an economic slowdown. However, the 800K level also is looking more and more like a “normalized” level when looking all the way back to 2016.
![US. Bureau of the Census, Privately Owned Housing Starts: 1-Unit Structures [HOUST1F], first retrieved from FRED, Federal Reserve Bank of St. Louis, April 18, 2023](https://drduru.com/onetwentytwo/wp-content/uploads/2023/04/20230418_housing-starts.png "Housing starts")
Builders are also defying the odds through permits for building single-family homes. In February, these permits ended a year-long downtrend. March permits increased for a second month in a row with a 4.1% gain. Thus, the odds favor further increases in starts in the coming months.
![Source: U.S. Census Bureau and U.S. Department of Housing and Urban Development, New Privately-Owned Housing Units Authorized in Permit-Issuing Places: Single-Family Units [PERMIT1], retrieved from FRED, Federal Reserve Bank of St. Louis, April 18, 2023.](https://drduru.com/onetwentytwo/wp-content/uploads/2023/04/20230418_single-family-units-authorized-in-permit-issuing-places.png)
Housing starts declined year-over-year in every region except the Northeast. The Northeast stood out with an unusual surge in starts in December. The Northeast region’s starts came plunging right back to earth in January and February and have now jumped yet again. While the regions starts are very volatile, I am looking out for an uptrend to emerge. The West is on the other end of the spectrum with starts showing fresh signs of weakness. Starts in the West fell to their second lowest level since the start of the COVID-19 pandemic. Starts in the South more than offset weakness in the West. The South region jumped 4.8% to an 8-month high, a move that makes a bottom in starts look all the more likely. Housing starts in the Northeast, Midwest, South, and West each changed +10.9%, -31.7%, -19.3%, and -53.4% respectively year-over-year.
Existing Home Sales – March, 2023
The sequential decline for existing home sales resumed in March.
Pending existing home sales increased sequentially a second time in February, but the gains did not translate into higher sales for March. The seasonally adjusted annualized sales in March of 4.44M decreased 2.4% month-over-month from the 4.55M in existing sales for February (revised slightly downward). Year-over-year sales decreased 22.0%. Existing home sales could still be in the process of stabilizing.

(For historical data from 1999 to 2014, click here. For historical data from 2014 to 2018, click here) Source for chart: National Association of Realtors, Existing Home Sales© [EXHOSLUSM495S], retrieved from FRED, Federal Reserve Bank of St. Louis, April 26, 2022.

March’s absolute inventory level of 980K homes increased 1.0% over February (revised) and increased 5.4% year-over-year. According to the NAR, “Unsold inventory sits at a 2.6-month supply at the current sales pace, unchanged from February but up from 2.0 months in March 2022.” Supply remains tight despite the March increases. The NAR noted in the last report that “multiple offers are returning on a good number of properties.” This time around, the NAR was more specific: “multiple offers on starter homes are quite common.”
Despite the sequential drop in sales, homes stayed on the market for a shorter time. It took an average 29 days to sell a home in March, down from 34 days in February and 33 days in January. The 65% of homes that sold within a month is up from the 57% in February. The trends in these two metrics suggest there is a firming baseline of demand that could continue to contribute to a stabilization in the market.
The decline in sales accompanied a second straight month of a sequential increase in price. The median price of an existing home increased 3.3% month-over-month to $375,700 but decreased 0.9% year-over-year. The year-over-year decline in February ended a record streak of 131 straight months of year-over-year increases, so March’s year-over-year decline may be starting a new streak.
The share of sales to first-time home buyers increased to 28% from 27% in February. The share was also higher a year ago at 30%. The NAR’s 2017 Profile of Home Buyers and Sellers reported an average of 34% for 2017, 33% for 2018, 33% for 2019, 31% for 2020, 34% for 2021, and 26% for 2022. The first-time buyer share for 2022 is the lowest on record for the NAR.
All regions declined significantly in sales year-over-year with the West continuing to suffer the worst declines. The Northeast was the only region to avoid a sequential decline in sales as the region experienced a strong month overall in home sales (see new home sales below). The regional year-over-year changes were: Northeast -21.2%, Midwest -17.6%, South -20.4%, West -30.5%.
The regions were mixed in the pace of year-over-year price changes. The West was the first region to flip negative in January, worsened in February, and worsened yet further in March. In fact, the West was the only region to suffer a year-over-year decline in prices. The regional year-over-year price changes were as follows: Northeast +1.0%, Midwest +1.7%, South +0.3%, West -7.5%.
Single-family existing home sales decreased 2.7% from February and declined on a yearly basis by 21.1%. Sales for existing single-family homes far outpaced condos and coops in February, but the scales flipped in March. The median price of $380,000 was down 1.4% year-over-year for single-family existing home sales.
California Existing Home Sales – March, 2023
California existing single-family home sales ended a three month streak of sequential gains with a 1.0% month-over-month decline in sales to 281,050 units. Sales were down 34.2% year-over-year for a 21st straight month of year-over-year declines. However, market internals continue to firm on the demand side. Per the California Association of Realtors (C.A.R.): “the competitiveness in the housing market continues to heat up, as homes are selling faster, and the sales-to-list-price ratio is improving, all the while when the number of homes available for sale continues to tighten…All signs point to a market with solid demand, which should help bolster sales through the homebuying season.”
The statewide sales-price-to-list-price ratio crept closer to the 100% level with a gain from 97.7% in February to 99.1% in March. The median time to sell a home in California surged from 28 days in December to 33 days in January. It fell back down to 28 days in February and plunged to 19 days in March. The duration was just 8 days a year ago!
March’s median home price printed $791,490, a gain of 7.6% from February and a decline of 7.0% year-over-year. The month-over-month price on a square footage basis increased from $373 to $388 and fell from $418 a year ago. Recall from the previous report that the C.A.R. observed “a shift toward more home sales in the lower-price segments is expected to continue to further soften home prices.” This movement must be operating on the yearly and not the monthly level.
The Unsold Inventory Index (UII) decreased from 3.2 in February to 2.6 in March. The C.A.R. described this plunge to levels last seen in May, 2022 as a seasonal effect. The UII sequentially declined despite a 27.9% increase in active listings. Active listings are still down 30% year-over-year, the largest since the pandemic-driven plunge in May, 2020.
New Residential Sales (Single-Family) – March, 2023
The playbook for maintaining sales is creating a strong spring selling season for home builders. New single-family home sales jumped 9.6% to 683,000 from February’s 623,000 sales (revised downward from 640,000). New single-family home sales are just 3.4% below levels seen a year prior, right as the Federal Reserve started its rate hikes. This rebound in sales has surprised economists and pundits. However, the tea leaves for this bullish reversal in new home sales were sprinkled all over the earnings reports of individual home builders.
![US. Bureau of the Census, New One Family Houses Sold: United States [HSN1F], first retrieved from FRED, Federal Reserve Bank of St. Louis, April 29, 2023.](https://drduru.com/onetwentytwo/wp-content/uploads/2023/04/20230428_New-Home-Sales.png "new home sales")
The median price jumped for the second month in a row in March. The median price increased 3.8% month-over-month to $449,800, a 3.2% year-over-year increase. So far, the recession in the housing market has only produced one very marginal year-over-year price decline. At least the overheated price increases from excessive liquidity in the economy are likely over.
![U.S. Census Bureau and U.S. Department of Housing and Urban Development, Median Sales Price for New Houses Sold in the United States [MSPNHSUS], retrieved from FRED, Federal Reserve Bank of St. Louis, April 29, 2023](https://drduru.com/onetwentytwo/wp-content/uploads/2023/04/20230429_Median-Sales-Price-for-New-Houses.png "Median Sales Price for New Houses")
The inventory for new homes dropped again, this time from 8.2 to 7.6 months of sales. The market is over-supplied given inventory sits above the 6.0 level that is the benchmark for a balanced market. However, the recent declines underscore strengthening demand during the spring selling season.
An unusual surge in the Northeast made it the only region to enjoy a year-over-year increase in sales. For the third time since the Great Financial Crisis (GFC), Northeast sales surged to levels last seen in the months prior to that recession. March’s surge took sales close to a 16-month high, well past a bullish reversal in sales. A realtor friend in Maryland reported that sales have been picking up, including multiple offers on homes (which supports the report from the NAR). The Northeast, Midwest, South, and the West changed +27.5%, -11.3%, -3.3%, and -9.0% respectively. On a month-over-month basis, the South was a rare laggard as the only region that failed to gain.
![U.S. Census Bureau and U.S. Department of Housing and Urban Development, New One Family Houses Sold in Northeast Census Region [HSN1FNE], retrieved from FRED, Federal Reserve Bank of St. Louis; https://fred.stlouisfed.org/series/HSN1FNE, April 29, 2023.](https://drduru.com/onetwentytwo/wp-content/uploads/2023/04/20230428_New-Home-Sales-Northeast.png)
Home Builder Confidence: The Housing Market Index – April, 2023
Builder sentiment improved again in April. February’s HMI of 42 was a significant increase from January’s 35. April’s 45 HMI was a one point increase from March. This slowing in the pace of improvement is consistent with my earlier expectations based on a pullback in consumer sentiment.
The National Association of Home Builders (NAHB) pointed to limited inventory of existing homes as a driver of new home sales:
“…Currently, one-third of housing inventory is new construction, compared to historical norms of a little more than 10%. More buyers looking at new homes, along with the use of sales incentives, have supported new home sales since the start of 2023.”
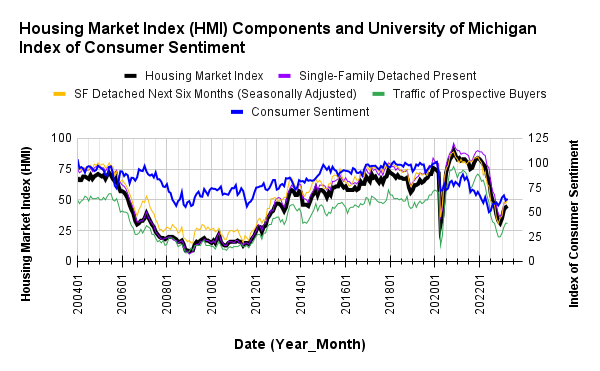
/Wells Fargo Housing Market Index (HMI) and the University of Michigan Index of Consumer Sentiment")
Source for data: NAHB and the University of Michigan
The SF Detached Present and Next Six Months (Seasonally Adjusted) made notable gains in April but the Traffic of Prospective Buyers stayed flat. Since the HMI gained just one point, I assume the traffic component has an outsized weighting on the index. The index of consumer index looks like it is flattening out for now.
The four regions experienced mixed month-over-month performances. The Northeast and the South stayed flat with March’s levels. The Midwest increased from 36 to 39. The West, surprisingly, made a large leap from 36 to 41, a level of sentiment last seen in August. Perhaps the large decline in starts in the West are coming to an end soon.
Home closing thoughts
The Direct Sales Market for Existing Homes
Marketplace looked behind the signs advertising “we buy houses” to tell a revealing story about one deal in Baltimore. An aging couple sold their home to move to a more comfortable apartment. A real estate wholesaler bought it for $70,000. They flipped the house to an investor who in turn sold the home for $175,000 with few apparent renovations. The couple expressed no regrets as the sale to a wholesaler was worth the convenience. While these deals sound predatory, one commentator noted that real estate agents often do not work in low-price neighborhoods because of the smaller payout in commissions.
Spotlight on Mortgage Rates
The 30-year fixed rate mortgage looks like it is stabilizing ahead of an expected end to the Fed’s rate hike cycle. The 6% to 7% range will likely yield rates in the lower 6s for the foreseeable future. This clarity could slow down the housing market a bit as motivated buyers feel a reduced sense of urgency. On the other hand, builders will likely see lower cancellation rates and a reduced need to push incentives to turn over inventory. Moreover, a stabilization in rates helps buyers anticipate an eventual decline in rates that will allow them to lower ownership costs through refinancing. On balance, stable mortgage rates are a net positive.
The Mortgage Bankers Association (MBA) reported a mixed month of increases and decreases in mortgage applications.
![Source: Freddie Mac, 30-Year Fixed Rate Mortgage Average in the United States [MORTGAGE30US], retrieved from FRED, Federal Reserve Bank of St. Louis, March 31, 2023](https://drduru.com/onetwentytwo/wp-content/uploads/2023/03/20230331_30-Year-Fixed-Rate-Mortgage-Average-US.png)
Be careful out there!
Full disclosure: long ITB
Doc,
Question you may know, ratio house price/median income….how does U.S. compare to other countries?
I don’t know off the top of my head, but there is a source I have seen for measuring bubbles across international housing markets. Let me know whether this source helps: https://int.housing-observatory.com/
It is long overdue for an update though!