Stock Market Commentary:
Put all the headlines aside. Last week was all about the technicals. Picture-perfect support unfolded for the major indices and stopped bearish momentum dead in its tracks. Suddenly, the stock market went from the verge of confirming a short-term top from early February to looking ready to make a run at challenging those highs.
Still, taking a step back shows that overall, the market is dominated by seesaw action as no new trend has yet to emerge since the October lows. On the fundamental side, the seesaw action with interest rates seems to be a driving factor for holding the market trendless since iShares 20+ Year Treasury Bond ETF (TLT) broke down last September (TLT is inversely correlated to bond yields). Since then, rates have bounced up and down with TLT currently trading at levels last seen in early 2014 and getting as low as levels last seen in 2011. I am duly noting the stock market’s increasing comfort with higher interest rates.
The Stock Market Indices
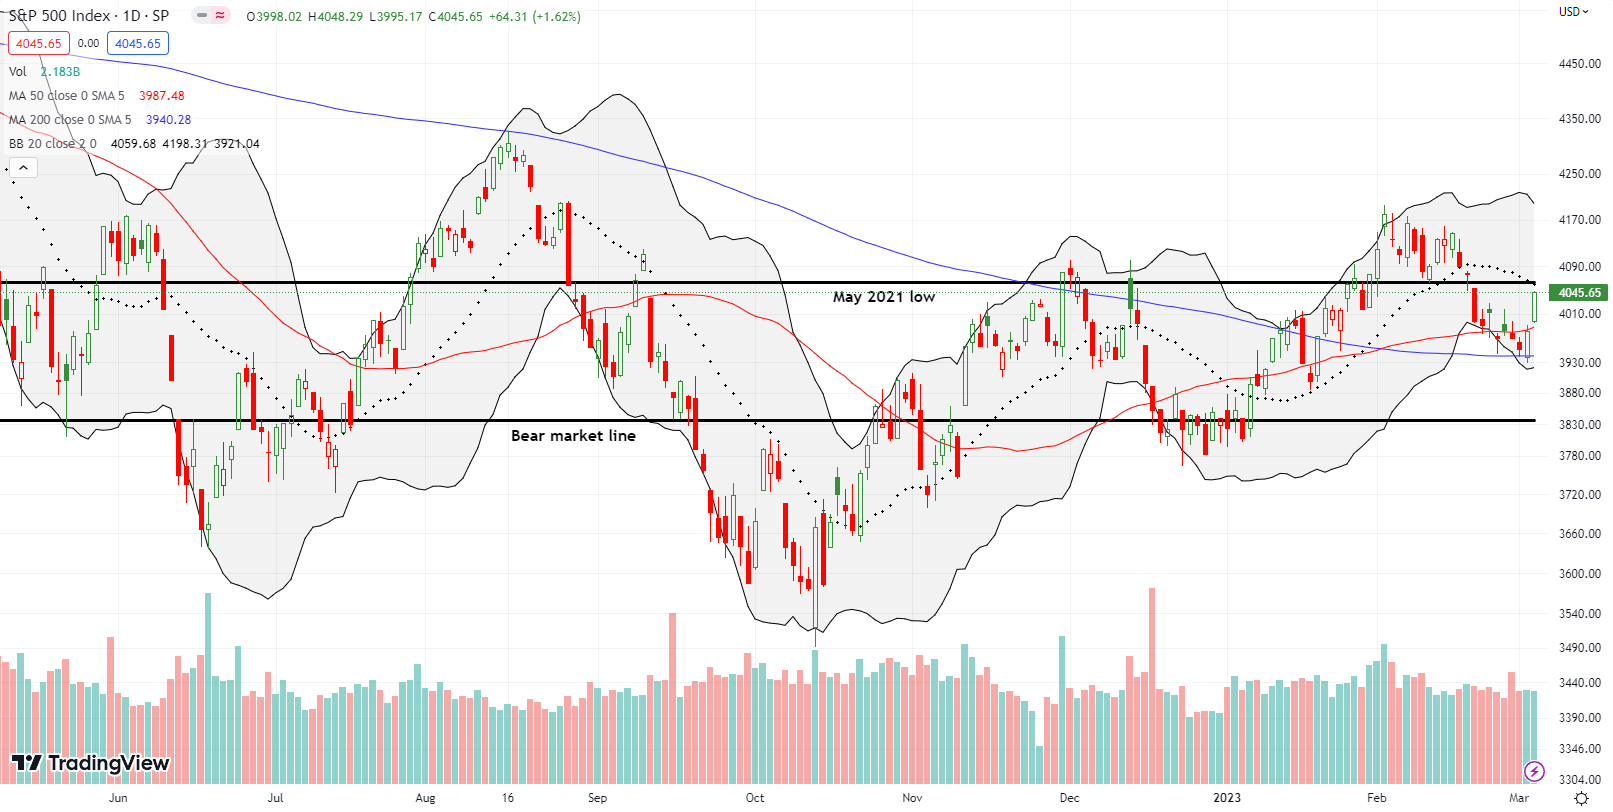
The S&P 500 (SPY) had an impressive end to the week. On Thursday, the index gapped down to support at its 200-day moving average (DMA) (the bluish line) and rebounded right to 50DMA resistance (the red line). Follow-through buying on Friday created a gain of 1.6% and confirmed the picture perfect support. Now the index needs to deal with converged resistance at its now downtrending 20DMA (the dashed line) and the May, 2021 low. That line is becoming quite the pivot point.
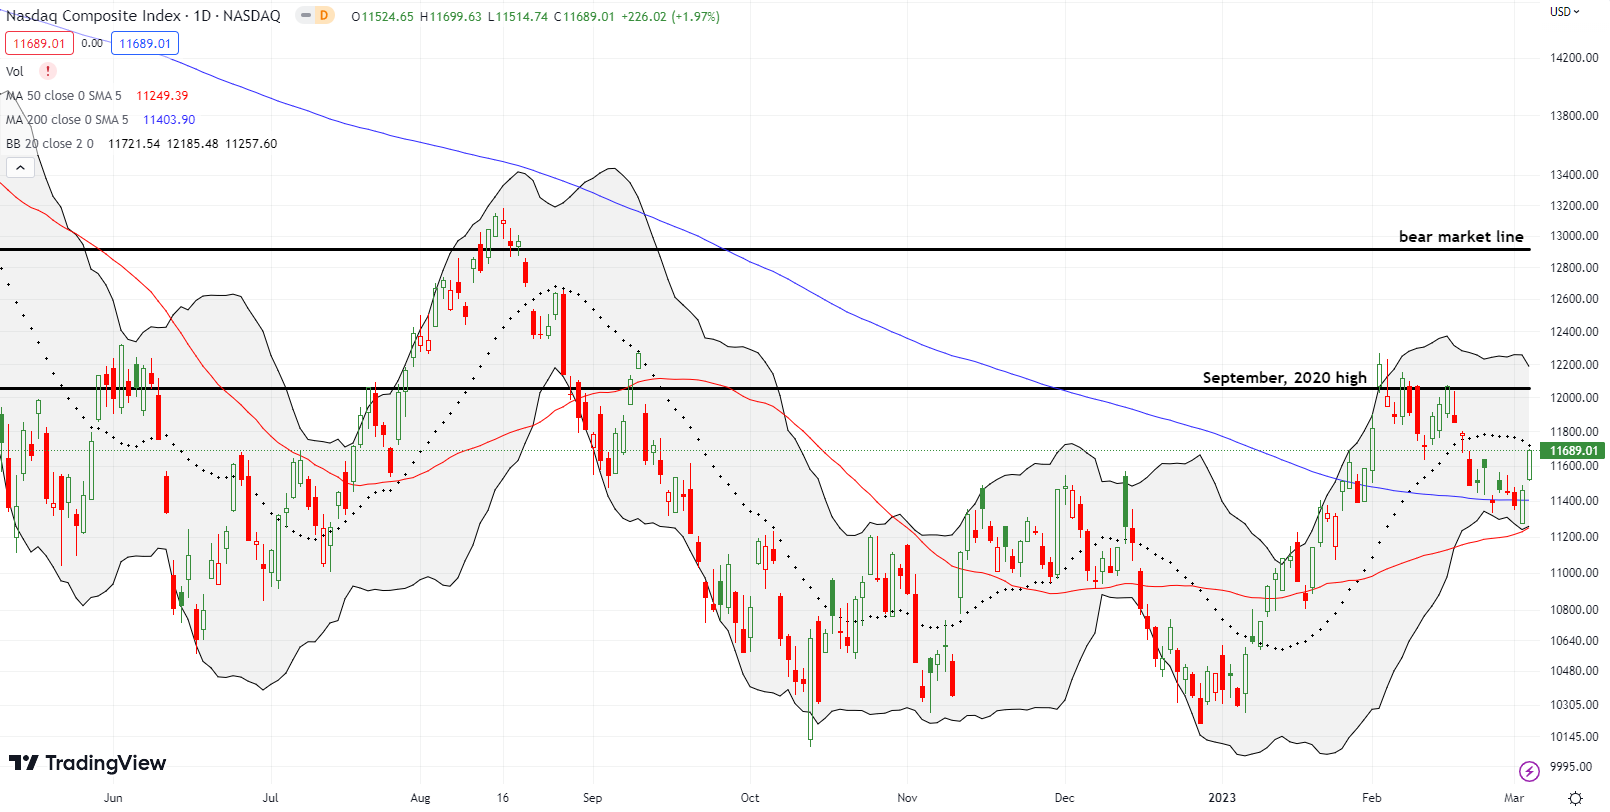
The NASDAQ (COMPQ) found picture-perfect support at its uptrending 50DMA. The close above 200DMA resistance set up Friday’s bullish move and a 2.0% gain. The tech-laden index closed right on downtrending 20DMA resistance. Still, the NASDAQ looks poised to rechallenge resistance at the September, 2020 high.
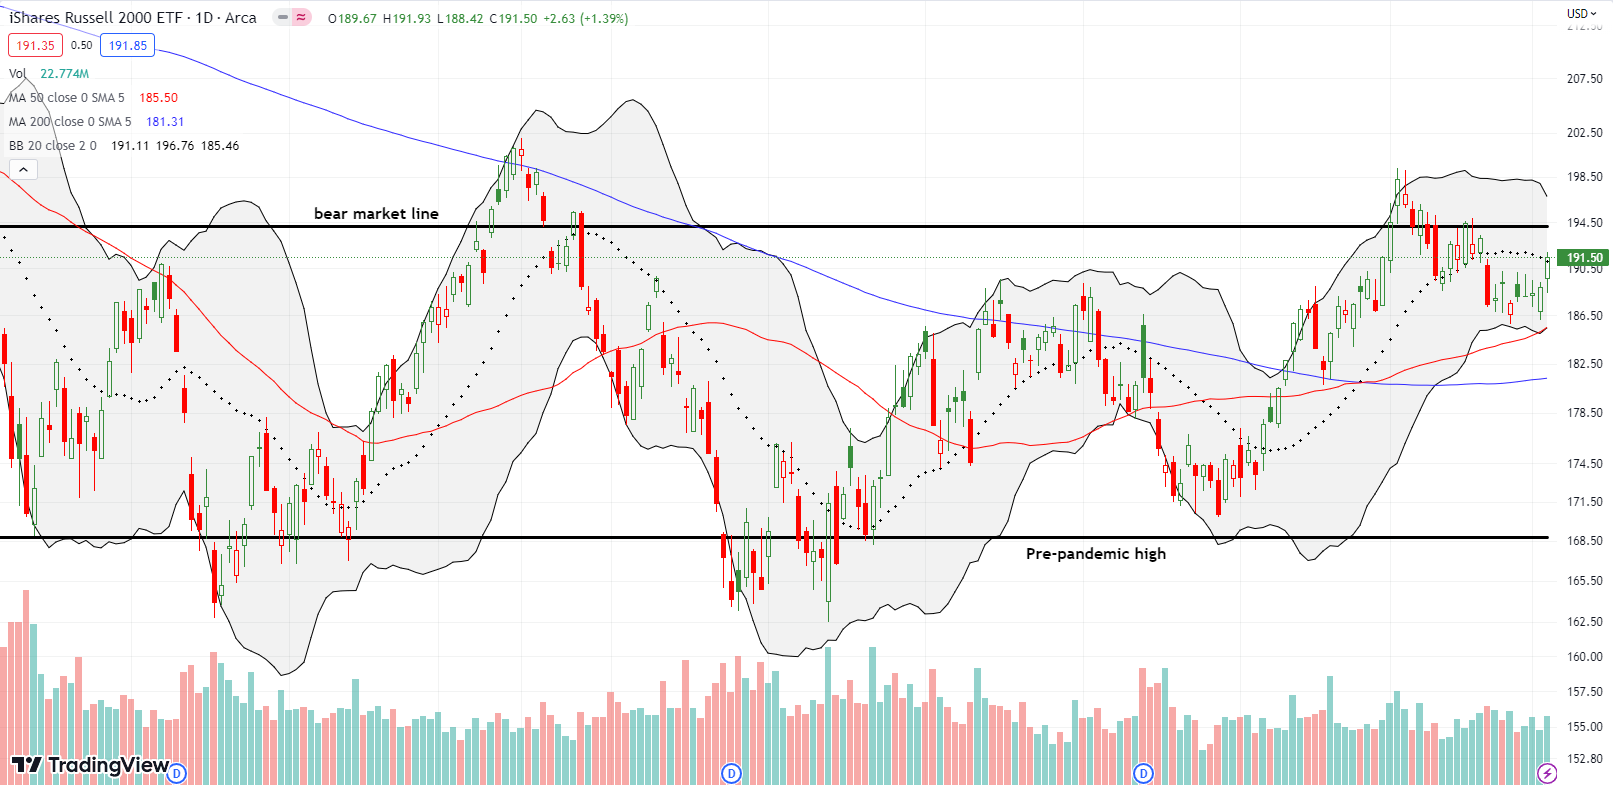
The iShares Russell 2000 ETF (IWM) also rallied into downtrending 20DMA resistance. IWM gained 1.4% on the day. The ETF of small cap stocks looks poised to bang on resistance at its bear market line. If IWM manages a fresh breakout in the coming days, I will consider buying back into IWM.
Stock Market Volatility
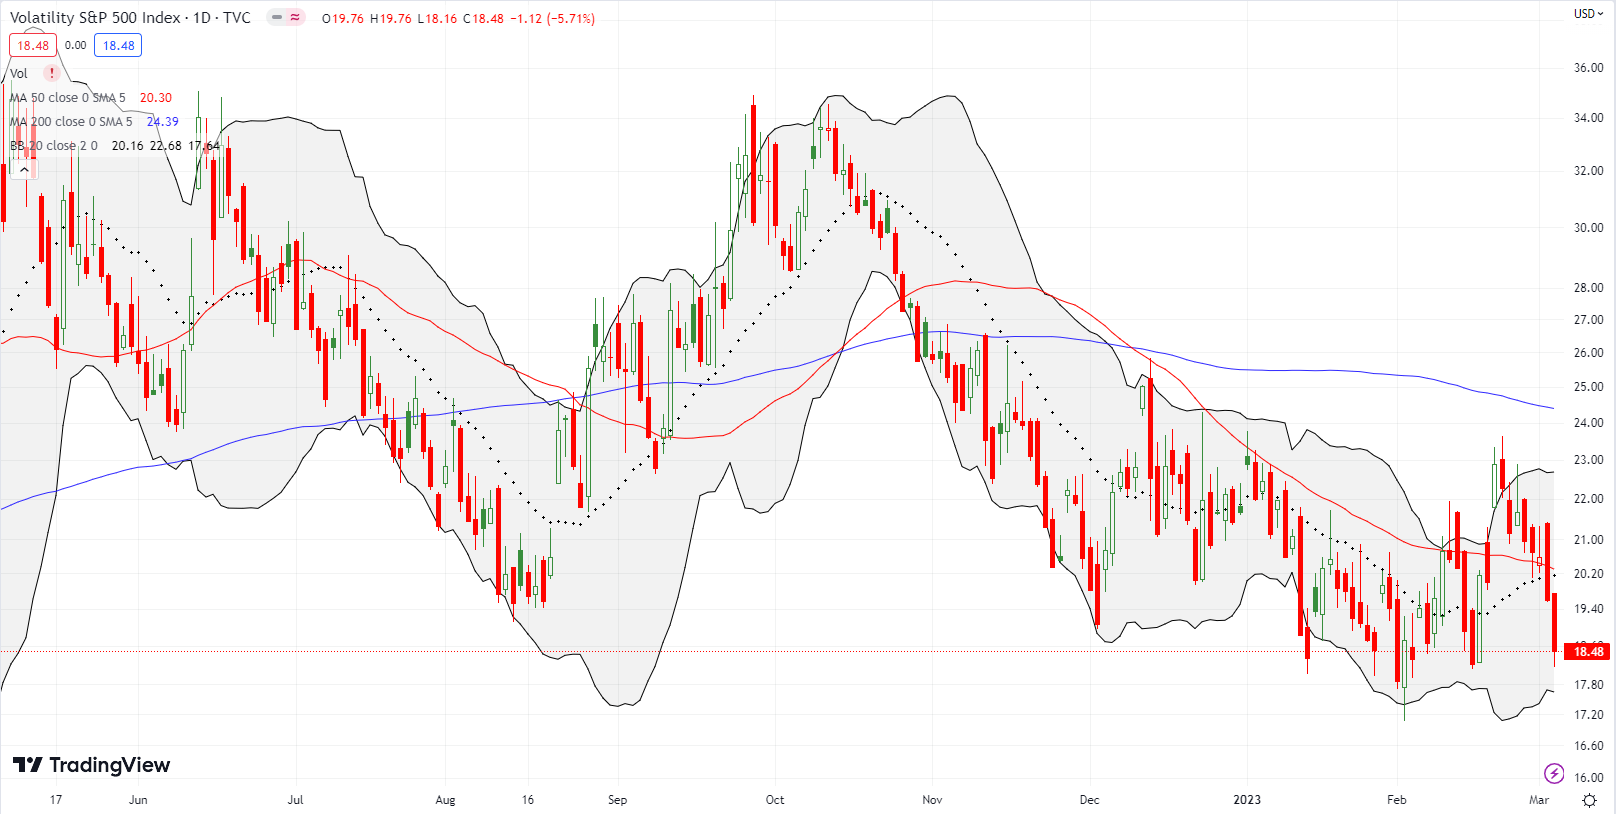
Incredibly, the volatility index (VIX) is right back to challenging its recent lows. Since I am still convinced the VIX has bottomed, I am bracing for a fresh pop. In other words, I cannot create a bullish interpretation for this latest episode of the VIX breaking down below the critical 20 level.
The Short-Term Trading Call With Picture-Perfect Support
- AT50 (MMFI) = 56.8% of stocks are trading above their respective 50-day moving averages
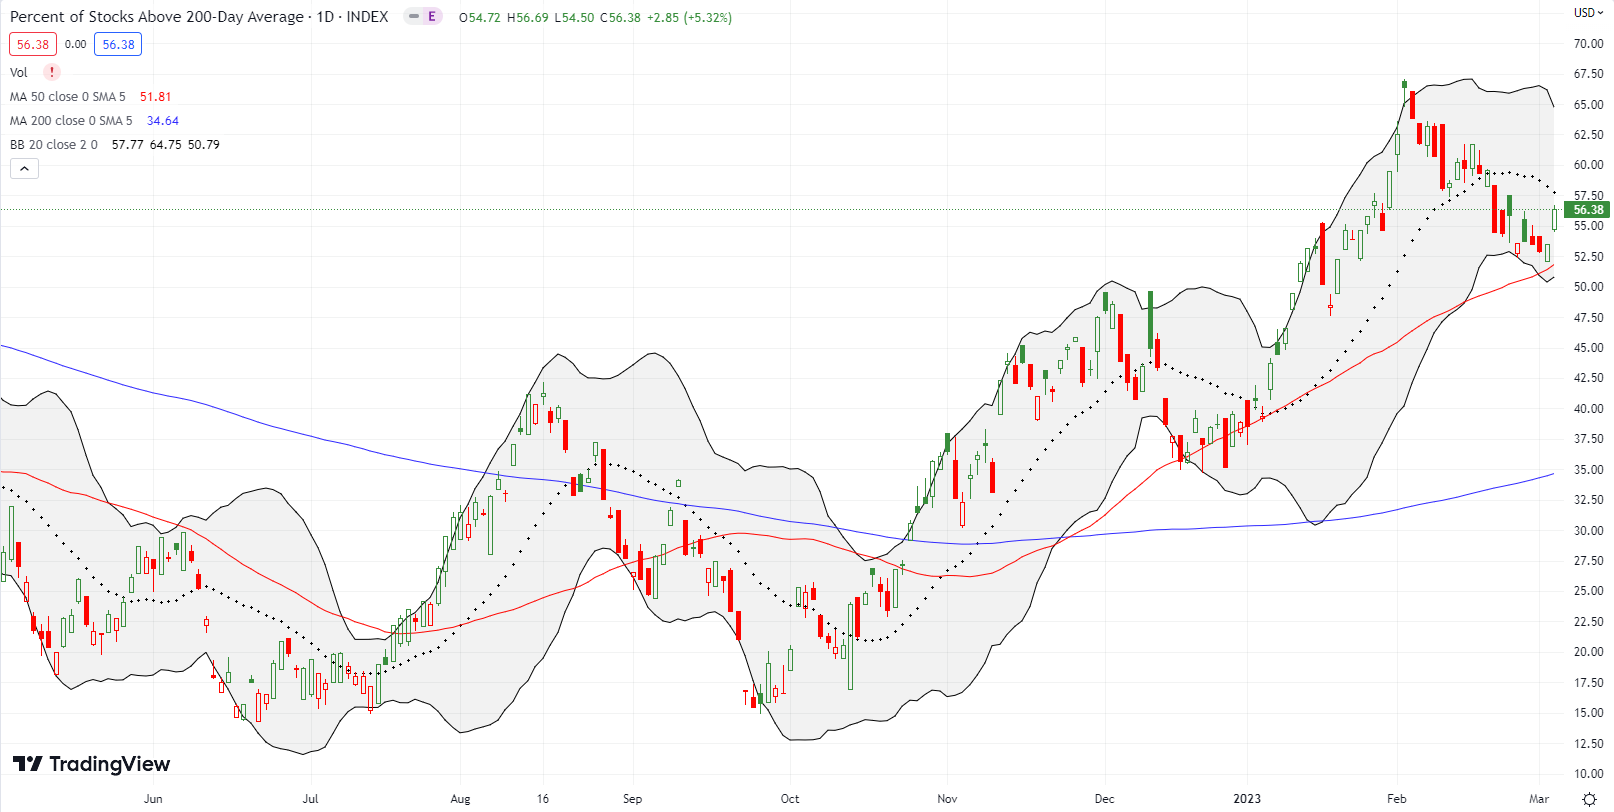
- AT200 (MMTH) = 56.4% of stocks are trading above their respective 200-day moving averages
- Short-term Trading Call: neutral
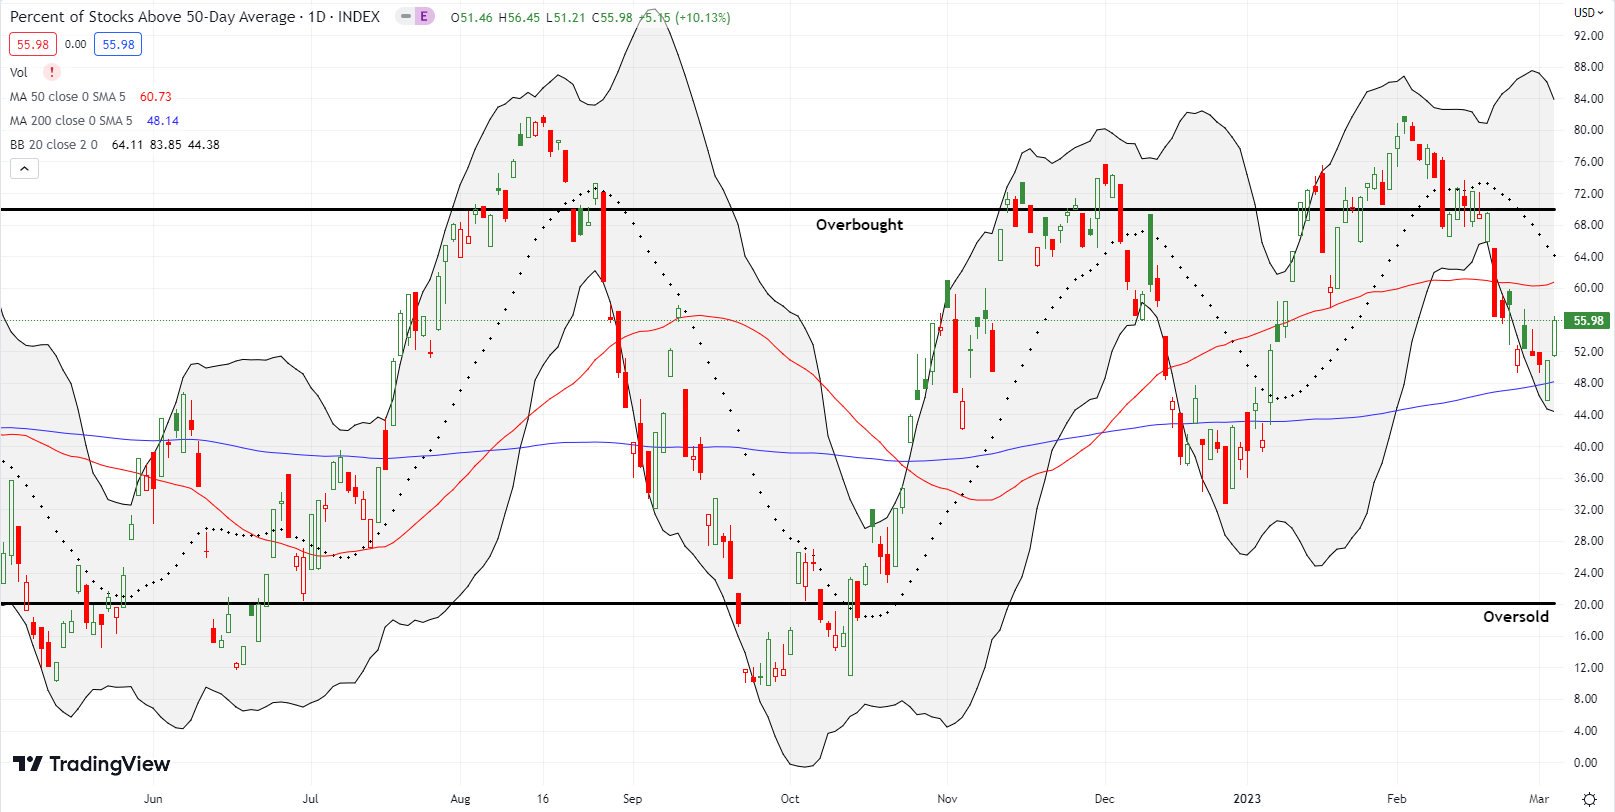
AT50 (MMFI), the percentage of stocks trading above their respective 50DMAs, surged off the Thursday intraday low of 45.8% and closed the week at 56.8%. The bounce represented the spirited defense of the bulls that created the picture-perfect bounce off support. These moves were enough to quickly flip my short-term trading call from bearish to neutral.
The latest bearish cycle was again short. I tried to make the most of the cycle while the trading clarity lasted. Some of my bearish positions lingered into the rebound. I decided to keep them as hedges to the few new bullish positions I put on in the wake of the picture-perfect defense of support. If I fade any rallies, I will keep them on short leashes just as I did in the last bear cycle.
The short-term trading call will go back to bearish if the S&P 500 breaks down below its 200DMA or at the next failure at the overbought threshold – whichever comes first. I am not interested in turning bullish until the next oversold reading for AT50.
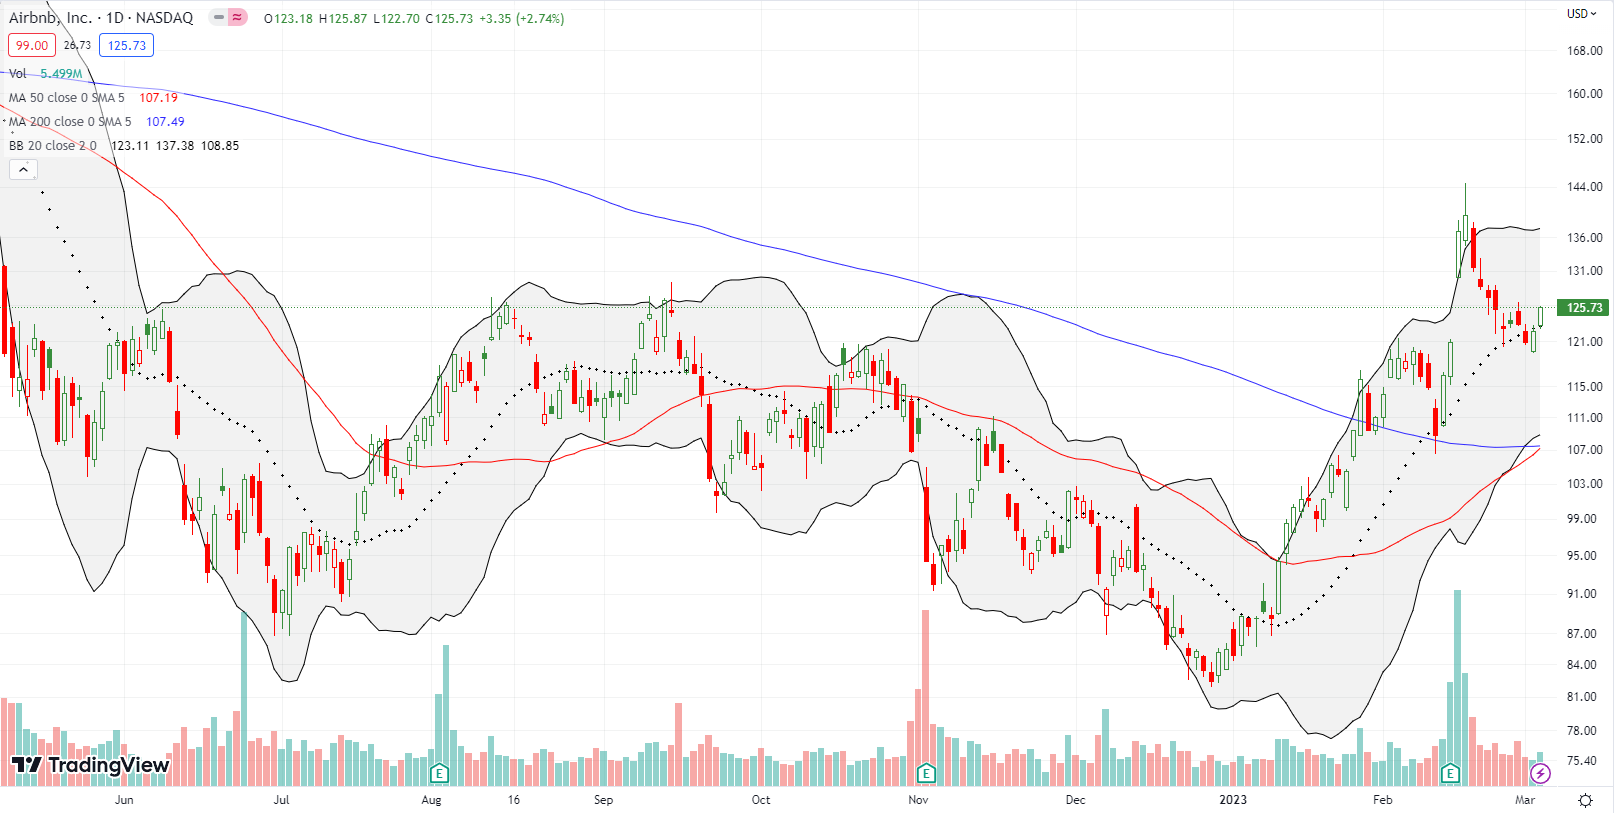
Airbnb, Inc (ABNB) created a bullish swing trade pattern that I saw repeated across a lot of stocks that flamed out sometime in February. ABNB reversed its entire 13.4% post-earnings gains before the buyers stepped in to defend the stock. The uptrending 20DMA provided approximate support. I bought shares and paid for most of a call spread by going short a put spread. While the February flame-out may still hold as a sustaining top, I think ABNB is good for a trade back to the $135 level or higher.
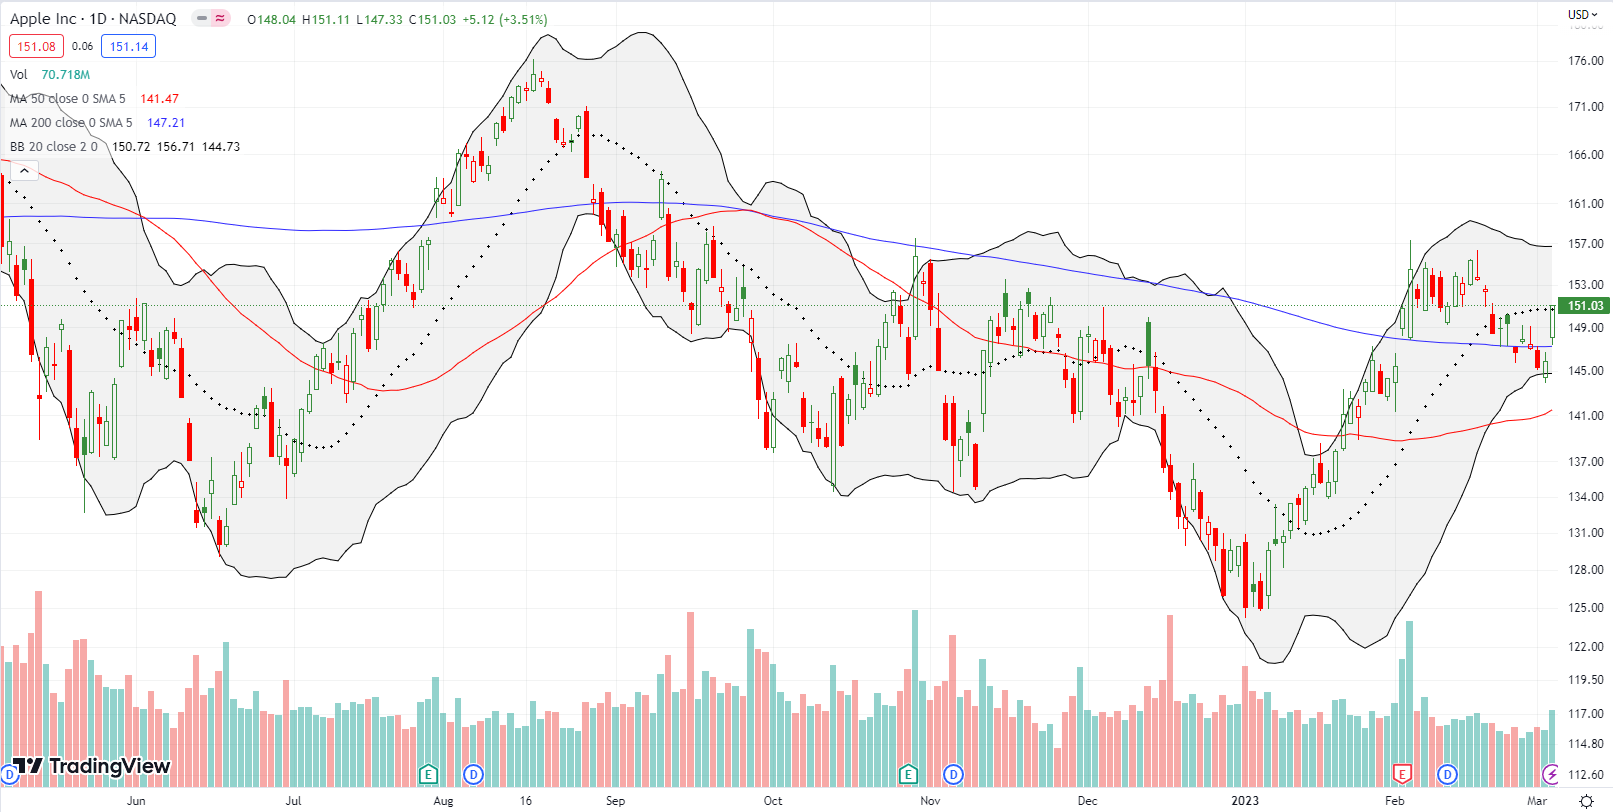
Apple Inc (AAPL) did not print a dramatic topping pattern in February, but it delivered drama last week. AAPL flirted with a bearish 200DMA breakdown all week until Friday’s 3.5% surge. The upswing convincingly squelched the bearish momentum that was building. (I also happened to luck out with a call option on the Apple Trading Model right at Thursday’s intraday low. I sold into Friday’s rally). Now, AAPL is one gain away from confirming a 200DMA breakout. Note February’s 200DMA breakout only received marginal follow-through before sellers took over again.
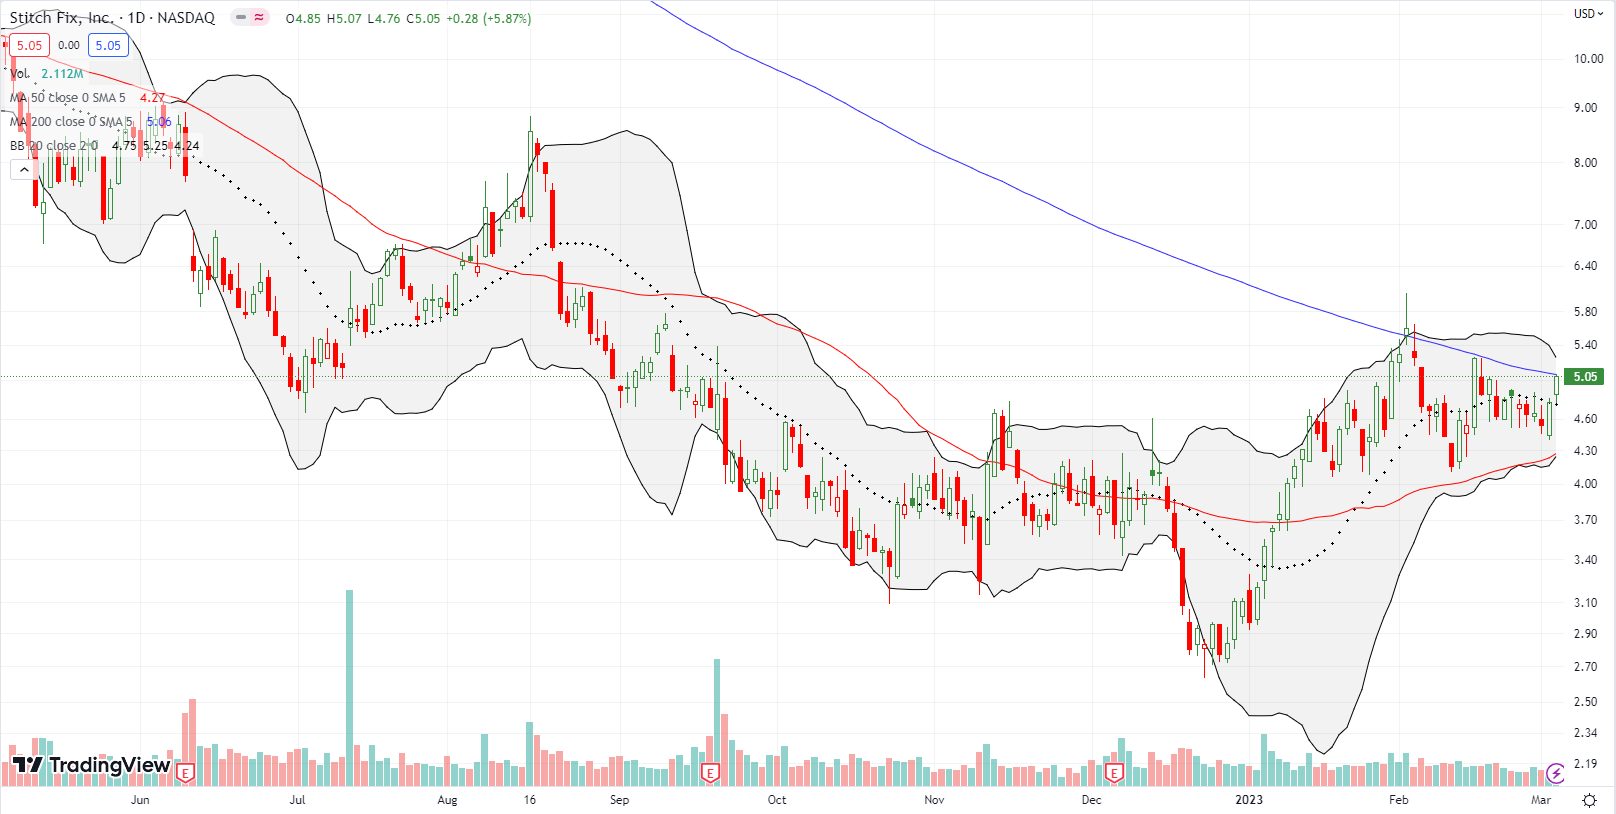
I am eyeing Stitch Fix, Inc (SFIX) as the next test of the market’s refreshed speculative interests. SFIX is wedged between a declining 200DMA and an uptrending 50DMA. The resulting seesaw trading action has built up tension going into next week’s earnings report on March 7th. I am a buyer if SFIX holds a 200DMA post-earnings breakout. However, a breakout will likely create over-stretched conditions at or above the upper Bollinger Band (BB). If so, I will wait for the “dust” to settle before making a move. To the downside, sellers have a lot of work ahead to break SFIX below its 50DMA for a resumption of bearish momentum.
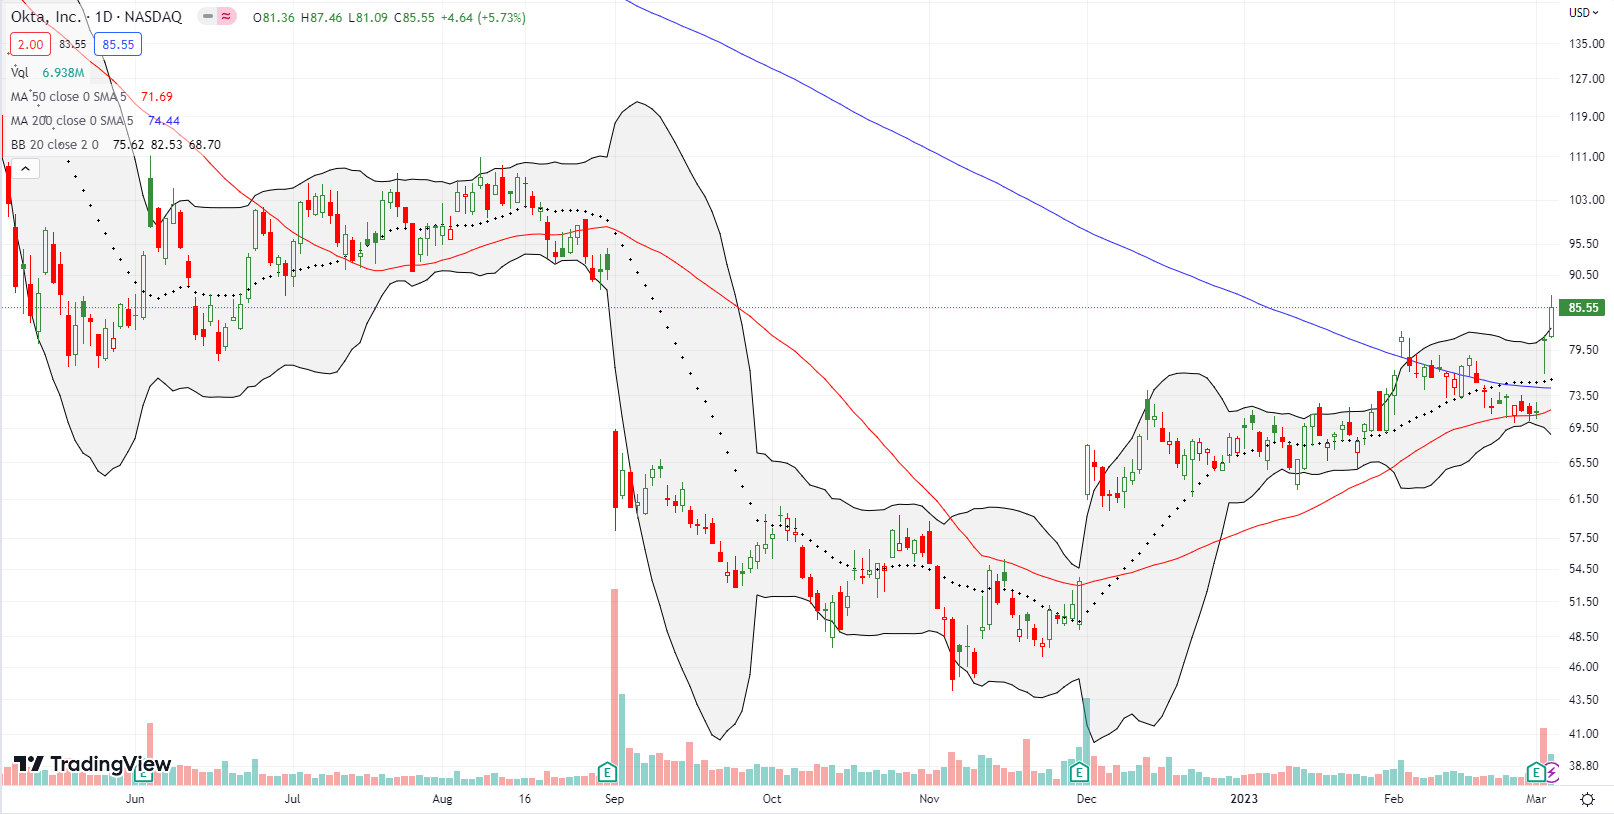
Cybersecurity software company Okta, Inc (OKTA) should have been on my shopping list on Friday. OKTA gained 13.3% post-earnings on Thursday. The clean 20DMA and 200DMA breakout on that day confirmed support at the 50DMA. I should have been ready to buy a breakout to multi-month highs, but I saw the move too late. Friday’s 5.7% gain has nearly reversed the entire September post-earnings disaster (a 33.7% plunge). In retrospect, I also should have seen December’s 26.5% post-earnings surge as a signal of a bottom and shift in mood. These kinds of manic swings of mood can make we question whether the market has any idea what it is doing on a given individual stock.
Be careful out there!
Footnotes
Subscribe for free to get email notifications of future posts!
“Above the 50” (AT50) uses the percentage of stocks trading above their respective 50-day moving averages (DMAs) to measure breadth in the stock market. Breadth defines the distribution of participation in a rally or sell-off. As a result, AT50 identifies extremes in market sentiment that are likely to reverse. Above the 50 is my alternative name for “MMFI” which is a symbol TradingView.com and other chart vendors use for this breadth indicator. Learn more about AT50 on my Market Breadth Resource Page. AT200, or MMTH, measures the percentage of stocks trading above their respective 200DMAs.
Active AT50 (MMFI) periods: Day #95 over 20%, Day #91 over 30%, Day #40 over 40%, Day #40 over 50% (overperiod), Day #9 under 60% (underperiod), Day #11 under 70%
Source for charts unless otherwise noted: TradingView.com
Full disclosure: long QQQ put spread, long SPY puts, long ABNB shares, call spread, and short put spread
FOLLOW Dr. Duru’s commentary on financial markets via StockTwits, Twitter, and even Instagram!
*Charting notes: Stock prices are not adjusted for dividends. Candlestick charts use hollow bodies: open candles indicate a close higher than the open, filled candles indicate an open higher than the close.


