

Stock Market Commentary:
Unlike the prior week, last week was all about the fundamentals, and the fundamentals made a huge difference. After failing to break through picture-perfect resistance levels, especially the 20-day moving averages (DMAs) (the dotted lines in the charts below), the indices were left vulnerable to selling pressure. The pressure started with Federal Reserve chair Jerome Powell reiterating familiar hawkish themes in verbal responses during Congressional testimony. The pressure continued with bank failures. The final blow came from yet another strong jobs report (this one for February) – recall that strong economic news is bad news for a Wall Street that needs a recession to compel the Federal Reserve to cut interest rates. As a result, the stock market suffered from major breakdowns, broadly distributed across the major indices.
Suddenly, the stock market went from bouncing off picture-perfect support to confirming the short-term top from early February.
For giggles, I asked ChatGPT whether Powell’s prepared remarks for Congress were hawkish, dovish, or neither. The AI voted for “neither” and explained its reasoning based on Powell’s relatively balanced language:
“The speech from Fed chair Jerome Powell is neither dovish nor hawkish. Powell expresses a strong commitment to returning inflation to the Fed’s 2 percent goal, acknowledging the significant hardship caused by high inflation. Powell notes that the recent economic data suggest that inflationary pressures are running higher than expected, but inflation has moderated somewhat since the middle of last year. Powell also highlights that the labor market remains extremely tight, with strong job gains and a lagging supply of labor. The Fed’s monetary policy actions are guided by their dual mandate to promote maximum employment and stable prices, and they will continue to make decisions based on incoming data and their implications for the economic outlook. Powell’s overarching focus is on restoring price stability, which is essential to achieving maximum employment and stable prices over the longer run.”
Powell tried to stay boilerplate, but members of Congress forced him to make his hawkishness plain.
The Stock Market Indices
The S&P 500 (SPY) delivered the first warning signal at the start of the week. Sellers faded a small rally attempt above converged resistance at the declining 20DMA and May, 2021 low. With the short-term downtrend intact, the index became vulnerable to all the bad news of the week. Strong selling during 3 of the last 4 trading days generated breakdowns below the 50DMA (the red line) and 200DMA (the bluish line). With both breakdowns confirmed, the S&P 500 looks is in danger of returning to bear market territory. The index closed the week with a near complete reversal of its gains for the year.
")
The NASDAQ (COMPQ) is still holding a 6.4% gain for the year. However, the breakdowns for the tech laden index leave it vulnerable to a complete reversal in due time. Sellers forced the issue by confirming resistance at a downtrending 20DMA, followed by a confirmed 200DMA breakdown. Friday’s 1.8% loss left the NASDAQ staring downward into a lot of open space. The near relentless rally for the first 6 weeks of the year left almost no natural support to catch a pullback.
")
The iShares Russell 2000 ETF (IWM) completed the trifecta of failures at 20DMA resistance. The ETF of small caps also suffered the worst from this failure. IWM lost a whopping 8.0% since testing 20DMA resistance. Friday’s 200DMA major breakdown generated a 2.9% loss on its own. IWM is now over-stretched below its lower Bollinger Band (BB). Note the extremely high trading volume on Friday as traders panicked out of stocks presumably left vulnerable to bank failure fears.
")
Stock Market Volatility
The February bottom for the volatility index (VIX) held up once again. This time the rebound unfolded in dramatic fashion. On Thursday, the VIX soared 18% and closed just short of the February high. On Friday, the VIX shot as high as 29, a 28% gain, before faders stepped into the fray in a big way. The VIX closed short of the December closing high and finished with “only” a 10% gain. The fade followed the gravity of an over-stretched situation. However, the VIX may finally have all the conditions needed to sustain an uptrend that lasts more than a few days.
I am reminded of a March 8th segment on Options Action about some big trader buying up VIX futures call spreads to bet on a double in the VIX by July expiration. Kris Sidial, CIO of Ambrus Group, made the point that the VIX was too low given the amount of macro-economic uncertainty. That trader realized significant profits by the highs of Friday and they would be smart to lock in some, if not all, of those rapid fire gains.
For my part, I did not fully appreciate the weight of this news of the big trades because this same trader made a similar bet back in January. I guess when you have a bearish conviction, you just persist!
")
The Short-Term Trading Call With Major Breakdowns
- AT50 (MMFI) = 23.9% of stocks are trading above their respective 50-day moving averages
- AT200 (MMTH) = 40.7% of stocks are trading above their respective 200-day moving averages
- Short-term Trading Call: neutral
AT50 (MMFI), the percentage of stocks trading above their respective 50DMAs, plunged most of the week from 56% to 24%. Losses accelerated in the last two days. The big irony of this latest flip in market sentiment is that the accompanying major breakdowns in the indices are bearish signals. Yet, with my favorite technical indicator so close to the oversold threshold of 20%, the risk/reward for flipping back to bearish is exceptionally poor. Thus, I left my short-term trading call at neutral. The market’s picture-perfect bounce from important support levels in the prior week delivered a major distraction. The spirited move by buyers forced me to back down from my bearishness born from concluding the market topped out in early February. On Friday, I took profits on a lingering SPY put option.
Of all the bad news that greased the skids for the market last week, the sudden collapse in SVB Financial Group (SVB), parent company of now defunct Silicon Valley Bank, planted several exclamation marks on the trading action. Seeking Alpha author Cavenagh Research provided the tidiest explanation of what happened:
“On the backdrop of a risk-on mentality, which flushed start-ups and founders with cash, Silicon Valley Bank, which has positioned itself as the bank for the venture capital market, enjoyed an inflow of deposits…SIVB total deposits more than tripled, growing from $61.7 billion in 2019 to $173 billion as of December 2022…SVIB decided to park the excess liquidity in U.S treasury securities and similar low-yield risk-free notes… bonds repriced sharply as inflation concerns prompted central banks around the world, including the Fed, to rapidly raise rates…SIVB suddenly needed to struggle with falling prices of its holdings of fixed income securities. Meanwhile, concerns about a depreciating asset base were compounded by an outflow of deposits, as savers were seeking higher yield opportunities than parking cash at a bank.”
In other words, the collapse of Silicon Valley Bank is yet one more tale for the shelves of market distortions caused by centralized financial authority. With good intentions, the Fed flood the economy with liquidity in response to the economic collapse of the pandemic. This response in turn motivated and even forced extreme behaviors throughout the economy. The 180 degree turn on monetary policy is now punishing those who stayed at the feeding trough too long or who failed to efficiently extricate themselves from bets on easy money monetary policy. Silicon Valley Bank found itself trapped by a pile of over-valued Treasury bills and did not adjust its balance sheet in depositor or investor-friendly way. The bank’s adjustments recorded significant balance sheet losses that sparked fear and panic.
Information asymmetry typically masks risks and leaves unsuspecting investors and depositors caught flat-footed. However, our free market system DOES enable voices to wave red flags for those paying attention (or willing to pay attention). Raging Capital Ventures pointing out the balance sheet weakness at SVB. Given their short position in SVB, I am pretty sure they were dismissed as motivated peddlers of FUD (fear, uncertainty, and doubt).
Picking up the bad news baton after the fact, Aaron Klein, former deputy assistant secretary at the Treasury Department, pointed to a “reliance on unusual funding sources to maintain and handle” explosive growth at Silicon Valley Bank. This commentary confirmed for me that the bank holds a large amount of the blame for getting itself into this vulnerable position. The bank exposed itself to the risk of a bank run by, at a minimum, mismanaging the communication of the required balance sheet adjustments. Klein points out that regulators need to wrestle with the implications. For example, could and should regulators have gotten ahead of this situation?
The bottom line as we go into the week of trading came from an interview with Treasury Secretary Janet Yellen on CBS’s Face the Nation.
- The government will NOT bailout SVB.
- The U.S. banking system is sound.
- Treasury is working with others to develop reassurances for financial markets ahead of the start of Asian trading.
- The FDIC and the Federal Reserve will likely consider further actions required to address depositor issues and ensure financial stability.
Of course, the Federal Reserve will be on the hot seat in the coming March meeting. If the Fed proceeds with rate hikes as planned, fresh despair could wash over a market left wondering just how bad the news needs to get before the Fed backs down off its inflation-related monetary priorities.
This whole episode is a stark reminder of the non-linearity of financial markets in times of uncertainty and high risk. It is all too easy to go to bed thinking “all is well” and wake up discovering a “fall into hell.” Those who maintain cash buffers during these times are well-positioned both to reduce risk and also buy into assets at discounts.
")
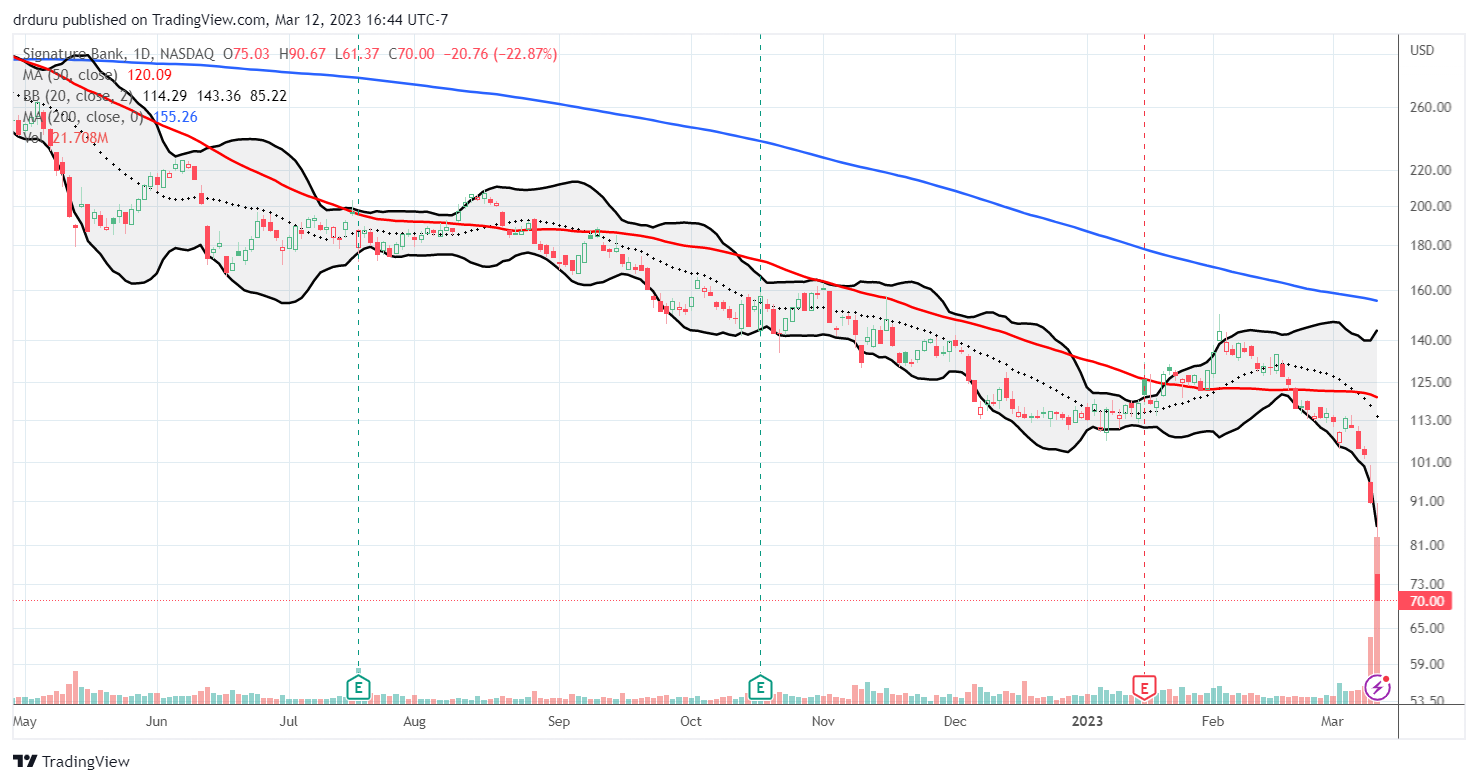
Silvergate Capital Corporation (SI) is another high-profile bank failure. Unlike SIVB, the bearish pressure has unfolded slowly enough to give traders and investors time to bail if they so chose. I honestly do not understand why this bank of crypto is still allowed to trade in the open market. SI has been one bad headline after another as the bank scrambled and tried to save itself from the dustbin of crypto-related disasters over the last two years. (In related news, the Feds seized Signature Bank (SBNY), another bank that got into trouble doing cryptocurrency lending).
")
When I woke up to the unfolding events on Thursday, I reviewed my own portfolio to see what stocks I needed to sell proactively. The main yellow flag in my basket was AGNC Investment Corp (AGNC), an investor in mortgage-back securities. Almost a year ago, I wrote about the risks in AGNC and stayed away. However, I bought back into AGNC as it demonstrated relative strength in the midst of the market selling in December. Now, both the technicals and fundamentals are weighing against AGNC once again. I sold my shares soon after Friday’s open and preserved the slimmest of profits. I will continue to monitor the trading action and news.
")
With bearish winds blowing again, I pounced on Caterpillar, Inc (CAT) as it traded below its 50DMA on Tuesday. I saw a fresh confirmation of a top created by the post-earnings gap down from the late January all-time high. I bought a conservative calendar put spread expecting CAT to churn its way through the rest of the week. A 1.1% gain the next day seemed to confirm my expectations.
The next two days of selling suddenly flipped my position from a small gain to a small loss. My jaw dropped as I lamented the tremendous gains I missed if I had simply traded “flat out” bearish with straight put options! I went ahead and let the market assign me the short side of the calendar put spread while holding the long side that expires on Friday. For good measure, I repeated the weekly put spread play…once again expecting that CAT is likely to churn at worst in the coming week. CAT closed the week right at support from the December lows.
")
Alibaba Group Holding Ltd (BABA) started the year as a darling. The stock bullishly broke out above its 200DMA but topped out ahead of the S&P 500; BABA failed perfectly at resistance from the summer highs. Sellers have been in control ever since with a downtrend tightly defined by the 20DMA. BABA is now down 5.8% year-to-date. I continue to think Chinese stocks are too risky for investment. The big swings can of course deliver profits for intrepid traders: BABA is still 30% above its October low and almost doubled from that low to the high. The swings are wide enough to pick off profits on the way up and/or on the way down. I closed out a put option on Thursday. Note the confirmed 200DMA breakdown on BABA.
")
")
")
Be careful out there!
Footnotes
Subscribe for free to get email notifications of future posts!
“Above the 50” (AT50) uses the percentage of stocks trading above their respective 50-day moving averages (DMAs) to measure breadth in the stock market. Breadth defines the distribution of participation in a rally or sell-off. As a result, AT50 identifies extremes in market sentiment that are likely to reverse. Above the 50 is my alternative name for “MMFI” which is a symbol TradingView.com and other chart vendors use for this breadth indicator. Learn more about AT50 on my Market Breadth Resource Page. AT200, or MMTH, measures the percentage of stocks trading above their respective 200DMAs.
Active AT50 (MMFI) periods: Day #100 over 20% (overperiod), Day #1 under 30% (underperiod ended 95 days over 30%), Day #2 under 40%, Day #4 under 50%, Day #14 under 60%, Day #16 under 70%
Source for charts unless otherwise noted: TradingView.com
Full disclosure: long QQQ put spread; long CAT shares, put, and calendar put spread
FOLLOW Dr. Duru’s commentary on financial markets via StockTwits, Twitter, and even Instagram!
*Charting notes: Stock prices are not adjusted for dividends. Candlestick charts use hollow bodies: open candles indicate a close higher than the open, filled candles indicate an open higher than the close.
Given the fundamentals, an XLF put spread would have made more sense?
Yes. But only in retrospect for me! I guess I didn’t think hard enough about the balance sheet implications for plunging T-bill prices.