

Housing Market Intro and Summary
In my last Housing Market Review, I described a housing market that shows signs of stabilization. That stabilization continues despite a strong rebound in mortgage rates. Mortgage rates now look like a renewed risk to the housing market. However, the uptrend in most of the stocks of home builders are surviving this increased mortgage rate risk so far. I am guessing that the relatively encouraging results from the Q1 earnings season gives investors enough staying power to try to “see through” this rate rebound. With the spring selling season starting, all eyes will be on mortgage applications and other early signs of the health of home buyers and home sales.
Housing Stocks
As I explained in the last Housing Market Review, I considered the near parabolic rise in iShares US Home Construction ETF (ITB) as a signal to take profits on the seasonal trade on homebuilders. Sure enough, ITB promptly declined from that early February peak. However, ITB maintained a solid hold on its uptrend as it bounced off support at its 50-day moving average (DMA) (the red line) during a week where the stock market delivered picture-perfect support.
")
While this support looks encouraging, ITB also closed at what is now downtrending resistance from its 20DMA (the dashed line). Even if ITB manages to break through that resistance, I see limited upside from here until/unless the results from the spring selling season start coming in well above expectations. Expectations already seem high given the relatively strong earnings results in the last several months and the apparent stabilization in the housing data over this time.
Housing Data
New Residential Construction (Single-Family Housing Starts) – January, 2023
Housing starts decreased 4.3% month-over-month to 841,000. Starts decreased 27.3% year-over-year. December’s starts were revised downward to 879,000. The 800K level is still holding as support. The coming sales in the Spring selling season will likely make or break this support level as home builders take their cues from the most important season of the year.
![US. Bureau of the Census, Privately Owned Housing Starts: 1-Unit Structures [HOUST1F], first retrieved from FRED, Federal Reserve Bank of St. Louis, March 2, 2023.](https://drduru.com/onetwentytwo/wp-content/uploads/2023/03/20230302_Housing-Starts.png "Housing starts")
Note that the odds of holding the 800K support are getting lower and lower as permits continue a steep decline. Excluding the immediate pandemic plunge, these permits are at a 7+ year low.
Housing starts declined year-over-year in all four regions. The Northeast stood out with an unusual surge in starts in December. The Northeast region’s starts came plunging right back to earth in January. The starts are back to the middle of the range that has been in place for nearly 2 years for the Northeast. After wrestling with an explanation for the surge, I am satisfied now to call the surge a surprise blip in the data.
Housing starts in the Northeast, Midwest, South, and West each changed +22.9%, -30.3%, -16.9%, and -56.2% respectively year-over-year.
Existing Home Sales – January, 2023
The slow descent for sales of existing homes may be finally flattening out.
Existing home sales dropped for a twelfth month in a row with a very small sequential sales decline. The seasonally adjusted annualized sales in January of 4.00M decreased 0.7% month-over-month from the 4.03M in existing sales for December (upwardly revised from 4.02M). Year-over-year sales decreased 36.9%. Sales were last this low in 2012 excluding the crash at the onset of the pandemic. However, with pending home sales up 8.2% month-over-month in January, a second straight monthly increase, existing home sales should show sequential increases going into the Spring home selling season. Thus, sales for now look like they are stabilizing and bottoming out.

(For historical data from 1999 to 2014, click here. For historical data from 2014 to 2018, click here) Source for chart: National Association of Realtors, Existing Home Sales© [EXHOSLUSM495S], retrieved from FRED, Federal Reserve Bank of St. Louis, March 3, 2022.

December’s absolute inventory level of 980K homes increased 2.1% from December and increased 15.3% year-over-year. According to the NAR, “unsold inventory sits at a 2.9-month supply at the current sales pace, unchanged from December but up from 1.6 months in January 2022.” Supply remains tight but the small increases will support higher sales levels in the spring selling season. The NAR noted that “homes sitting on the market for more than 60 days can be purchased for around 10% less than the original list price.”
And homes are staying on the market a lot longer. It took an average of 33 days to sell a home in January, up significantly from the 26 days in December and 24 in January. Homes only took an average of 19 days to sell a year ago. The 54% of homes that sold within a month is down from the 57% in December. Compare that number to the 61% in November, 64% in October, 70% in September and 81% in August. Buyer enthusiasm has fallen fast. These sales cycles need to stabilize to support a flattening in overall sales.
Prices continue to creep downward in a straight line. The median price of an existing home decreased 2.0% month-over-month to $359,000 but increased 1.3% year-over-year. Prices have risen year-over-year for 131 straight months, an on-going record streak. The current trend still looks on track to end in March or April of 2023. I expect the media to blast alarm bells about the housing market once the median price of existing homes finally registers its first negative year-over-year change. Note well that recent declines are likely driven a lot by a mix shift toward smaller homes.
The sequential price decline has finally motivated a higher share of interest from first-time home buyers. Their share of sales increased to 31% in December from 28% and stayed flat in January. The share was actually lower a year ago at 27%. The NAR’s 2017 Profile of Home Buyers and Sellers reported an average of 34% for 2017, 33% for 2018, 33% for 2019, 31% for 2020, 34% for 2021, and 26% for 2022. The first-time buyer share for 2022 is the lowest on record for the NAR, so the latest increase in share looks like a significant development. First-timers look like a key factor for stabilizing existing home sales.
All regions declined significantly in sales year-over-year with the two biggest regions yet again suffering the largest percentage losses. Yet, both regions, the South and the West, managed sequential gains. The regional year-over-year changes were: Northeast -35.9%, Midwest -33.3%, South -36.6%, West -42.4%.
Each region continues to experience a slowing in the pace of year-over-year gains in the median sales price. The West actually flipped negative after clinging to a 0.1% year-over-year gain in December. The regional year-over-year price gains were as follows: Northeast +0.3%, Midwest +2.7%, South +3.4%, West less than -4.6%.
Single-family existing home sales decreased 0.8% from December and declined on a yearly basis by 36.1%. Per the above graph, sales for existing single-family homes pushed further below the pandemic low set in May, 2020. If not for the NAR’s forecast for a bottom in overall sales in Q1 (see the pending home sales section below), I would be bracing for a test of the post financial crisis low. The median price of $363,100 was up 0.7% year-over-year.
California Existing Home Sales – January, 2022
Sales improved slightly on a sequential basis for the second straight month thanks to lower mortgage rates. The California Association of Realtors (C.A.R.) interpreted these improvements as early signs of a healthier market: “While the monthly sales gains have been nominal over the past two months, the market is moving in the right direction, and more gradual improvements could be coming in the months ahead as the market moves into the spring homebuying season in a few weeks.”
California sales of existing single-family homes increased 0.4% from December to 241,520. Year-over-year, sales still fell a whopping 45.7% – a 19th straight month of year-over-year declines in California.
In November, California’s median sales price crossed the negative year-over-year mark for the first time in 30 months. For December, prices fell 2.8% year-over-year. For January, prices fell 1.9% year-over-year and down 3.0% from December for the fifth monthly price decline in a row. The month-over-month price decline on a square footage basis flattened a bit to $371 from $377 for a 1.6% drop. Year-over-year this price fell just $1.
Bidding wars were rapidly fading from California’s market before October’s apparent pause in the trend. The statewide sales-price-to-list-price ratio stayed below 100.0% for the sixth month in a row and still looks set to remain there for the duration of the housing market recession. This ratio increased ever so slightly to 96.5% from 96.2% in December. The median time to sell a home in California surged from 28 days in December to 33 days in January. The duration was just 12 days a year ago.
Inventory jumped back up in January. The Unsold Inventory Index (UII) increased from 2.4 in December to 3.6 in January. It was 3.3 months in November and last this high in May, 2020 in the immediate wake of the start of the pandemic. The UII was just 1.8 a year ago. The changes in inventory were again broad-based. Per the C.A.R., “unsold inventory increased from a year ago by 88 percent or more in all price ranges, with the $500,000-$749,000 price range gaining the most (112.5 percent), followed by the $1 million-and-up price tier (105.0 percent), the $750,000-$999,000 (100.0 percent) and the sub-$500,000 (88.9 percent).” C.A.R. did not provide an aggregate change in active listings for the state. Forty-eight of 51 counties experienced an increase in active listings (compare to 47 in December).
New Residential Sales (Single-Family) – January, 2023
The playbook for maintaining sales continues to work for home builders. New home sales have essentially stabilized since the summer, the longest stretch since the housing reached its peak in August, 2020.
December new single-family home sales of 670,000 shot up 7.2% from December’s 625,000 (revised up from 616,000), a 9-month high. Sales were still down 19.4% year-over-year. The key support at 550,000 in sales continues to hold.
![Source: US. Bureau of the Census, New One Family Houses Sold: United States [HSN1F], first retrieved from FRED, Federal Reserve Bank of St. Louis, January 31, 2023](https://drduru.com/onetwentytwo/wp-content/uploads/2023/01/20230131_New-Home-Sales.png "new home sales")
December’s decline in median price signaled a likely top in prices for 2023. A shift in sales mix toward homes priced under $399,999 helped bring the median down to $465,500 (revised). In the last housing market review, I declared price relief had finally started. However, mix effects are exaggerating the downward pull; a price per square foot would be more informative. For January, the median price plunged to 427,500 as the distribution of sales significantly shifted under $500,000, especially into the $200,000 to $299,999 range. The median price was last this low a year ago.
![U.S. Census Bureau and U.S. Department of Housing and Urban Development, Median Sales Price for New Houses Sold in the United States [MSPNHSUS], retrieved from FRED, Federal Reserve Bank of St. Louis, March 4, 2023](https://drduru.com/onetwentytwo/wp-content/uploads/2023/03/20230304_Median-Sales-Price-Since-Family-Homes.png "Median Sales Price for New Houses")
The recent plunge in median square footage of a new single family home confirms that the price drop is likely more of a mix effect. The National Association of Home Builders reported last month that median square footage fell to its lowest level in 12 years. It peaked 2 years ago. The Association expects “tighter budgets” to continue pushing home sizes down.
Robust sales pushed Inventory down to 7.9 months of sales from December’s 9.0 9.0 months of sales. The market is over-supplied given inventory sits above the 6.0 level that is the benchmark for a balanced market. Yet, it seems ample inventory is key to sales volumes given the on-going sales downtrend in the much tighter market for existing homes.
The West once again led the year-over-year decline in sales. The Northeast, Midwest, South, and the West changed -13.8%, -34.3%, -2.2%, and -46.9% respectively. The South experienced its second sizeable month-over-month sales increase in a row.
Home Builder Confidence: The Housing Market Index – February, 2023
Builder sentiment is improving so much that the National Association of Home Builders (NAHB)/Wells Fargo Housing Market Index (HMI) actually included the phrase “cautious optimism” in its latest report. February’s HMI soared from 35 in January to 42 in February. The NAHB’s speculation on a bottom in sentiment seems all but confirmed now.
“While the HMI remains below the breakeven level of 50, the increase from 31 to 42 from December to February is a positive sign for the market. Even as the Federal Reserve continues to tighten monetary policy conditions, forecasts indicate that the housing market has passed peak mortgage rates for this cycle. And while we expect ongoing volatility for mortgage rates and housing costs, the building market should be able to achieve stability in the coming months, followed by a rebound back to trend home construction levels later in 2023 and the beginning of 2024.”
In the last Housing Market Review I projected that “buoyancy in consumer sentiment should eventually bleed out to builders given the two sentiment figures rarely diverge for long.” January appears to be the month when the on-going improvement in consumer sentiment helped to pick up the spirits of builders. That momentum continued in February consumer sentiment jumped along with builder sentiment.
/Wells Fargo Housing Market Index (HMI) and the University of Michigan Index of Consumer Sentiment")
Source for data: NAHB and the University of Michigan
An overlay with the HMI components shows a synchronized upswing.
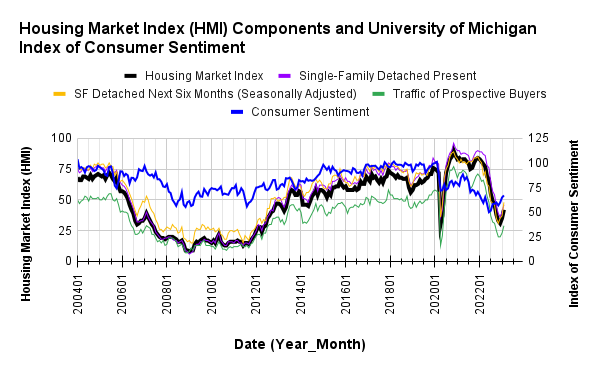
All four regions experienced month-over-month increases in HMI for the second straight month. The Northeast increased from 32 to 34 to 46 over two months. The Midwest plunged in December from 35 to 30 but is now above November with a 36 reading in February. The South was the only region in December to increase its HMI. The region jumped from 35 to 39 to 45 over the last two months. Sentiment in the West moved from last to third place with a jump from 29 to 37 after bottoming at 25 in October and December.
Home closing thoughts
2023 Sales Predictions
The NAR included predictions for 2023 in its latest pending home sales report. It expects existing home sales to bottom this quarter with year-over-year gains returning in 2024. From this bottom, the NAR projects an 11.1% year-over-year decline in sales and a 17.7% gain in 2024. New home sales are supposed to fare better with a 3.7% year-over-year decline this year and a 19.4% surge for 2024.
Spotlight on Mortgage Rates
While the 30-year fixed rate mortgage may have topped out just above 7.0% in October and November, mortgage rates may also have stopped coming down for now. Since the last Housing Market Review, the rate has jumped from 6.09% to 6.65%. The mortgage rate is now once again above Freddie Mac’s October forecast for the mortgage rate at the end of 2023 (the next quarterly forecast is still not available). Accordingly, in February, the Mortgage Bankers Association (MBA) reported three of four weeks with weekly decreases in mortgage applications whereas they increased three of four weeks in January. The inverse correlation between the direction of mortgage rates and the direction of mortgage applications is still relatively consistent. The upshot is the next drop in mortgage rates could generate a surge in buying activity by potential home owners who do not want to risk “missing out.”
![Source: Freddie Mac, 30-Year Fixed Rate Mortgage Average in the United States [MORTGAGE30US], retrieved from FRED, Federal Reserve Bank of St. Louis, March 4, 2023](https://drduru.com/onetwentytwo/wp-content/uploads/2023/03/20230304_30-Year-Fixed-Rate-Mortgage.png)
Be careful out there!
Full disclosure: no positions