Stock Market Commentary:
The stock market this month has teetered on a seesaw alternating from resistance to support. The rapid back and forth makes it too easy to overinterpret both ends of these swings. However, a slow and steady convergence of resistance and support levels portends a potential big move ahead. Active and high volume trading in call options on VIX futures suggests that the resolution of the seesaw trading points to the downside. Still, as I mentioned earlier, the market keeps thwarting my search for excuses to get bearish. So now I just (im)patiently wait for traders to show their collective hand with a resolute breakout or breakdown.
The Stock Market Indices
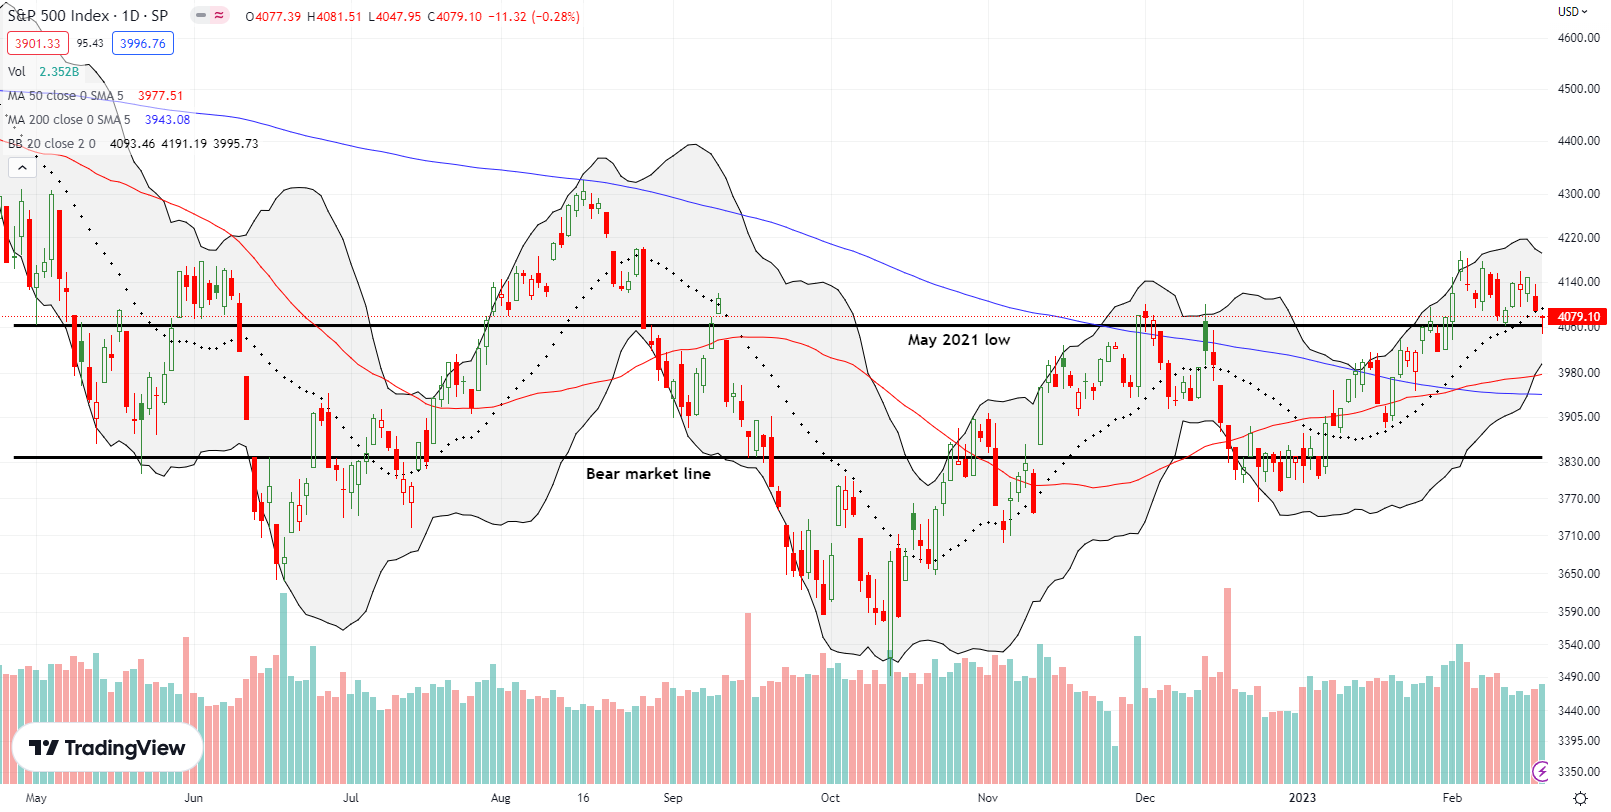
For the second time this month, the S&P 500 (SPY) dipped to support at its May, 2021 low. Like the first time, buyers stepped up to defend support and prevent a close below the line. The S&P 500 ended the day with a marginal 0.3% loss and a close below 20DMA support for the first time since the start of this year. The index has been a seesaw of market emotions going from resistance at the high before last August’s Jackson Hole and support at the May, 2021 low. I now appreciate the need to avoid strong conclusions about the S&P 500’s behavior until it breaks away from this seesaw action.
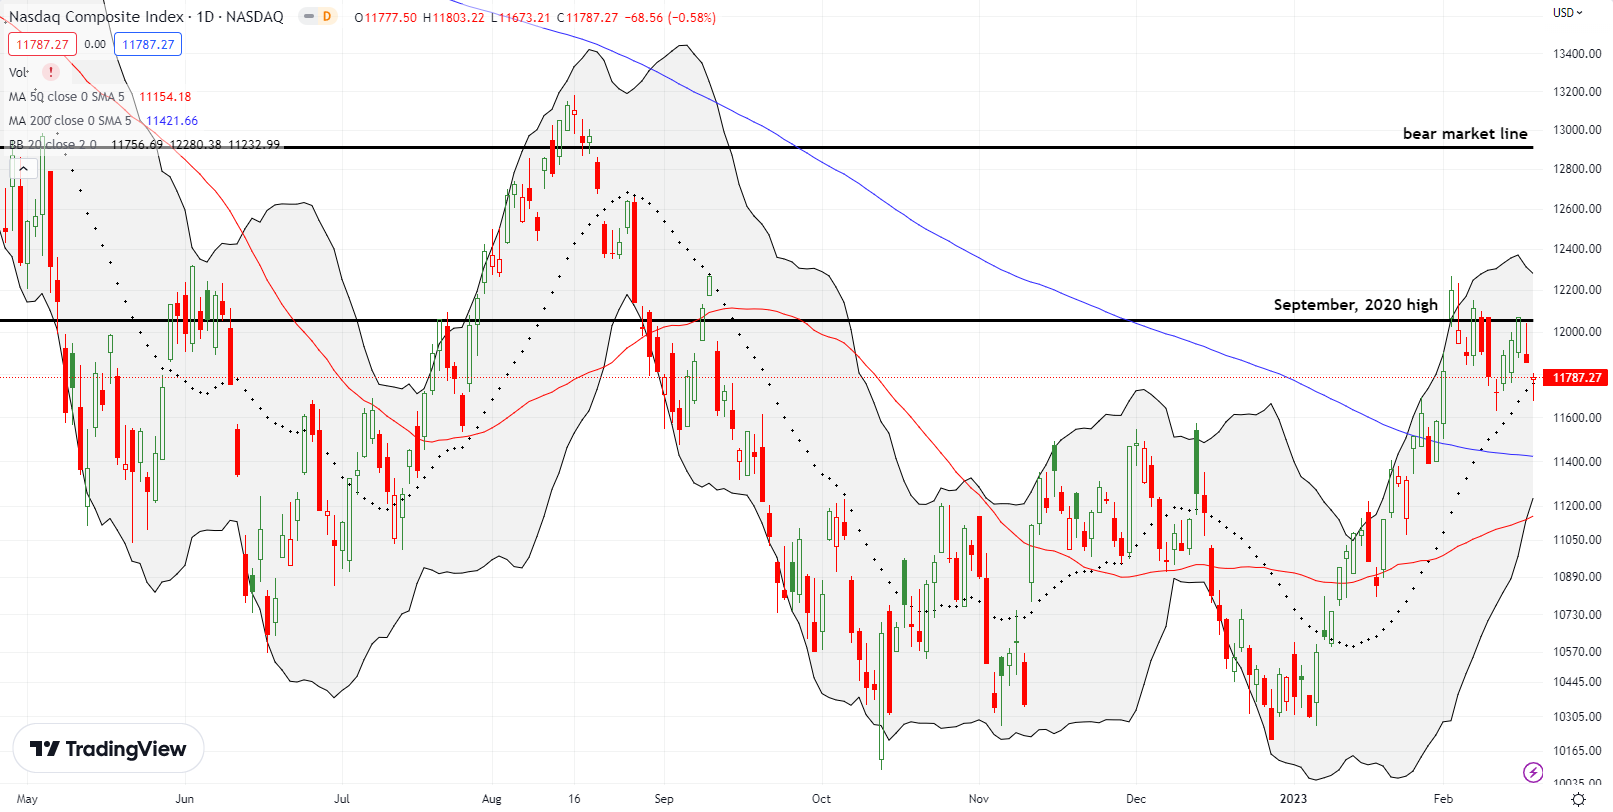
The NASDAQ (COMPQ) has its own seesaw going with a strong resistance limiting the tech-laden index’s advance. Earlier this month, the NASDAQ surged through resistance at the September, 2020 high but failed to progress beyond its September, 2022 high. Since then, the NASDAQ has mainly traded below the September, 2020 high. Unlike the S&P 500, the NASDAQ held support at its 20DMA. As support converges with resistance, I expect an explosive resolution to this seesaw action. Note well how the 50DMA (red line) and the 200DMA (bluish line) are converging to provide the next level of support.
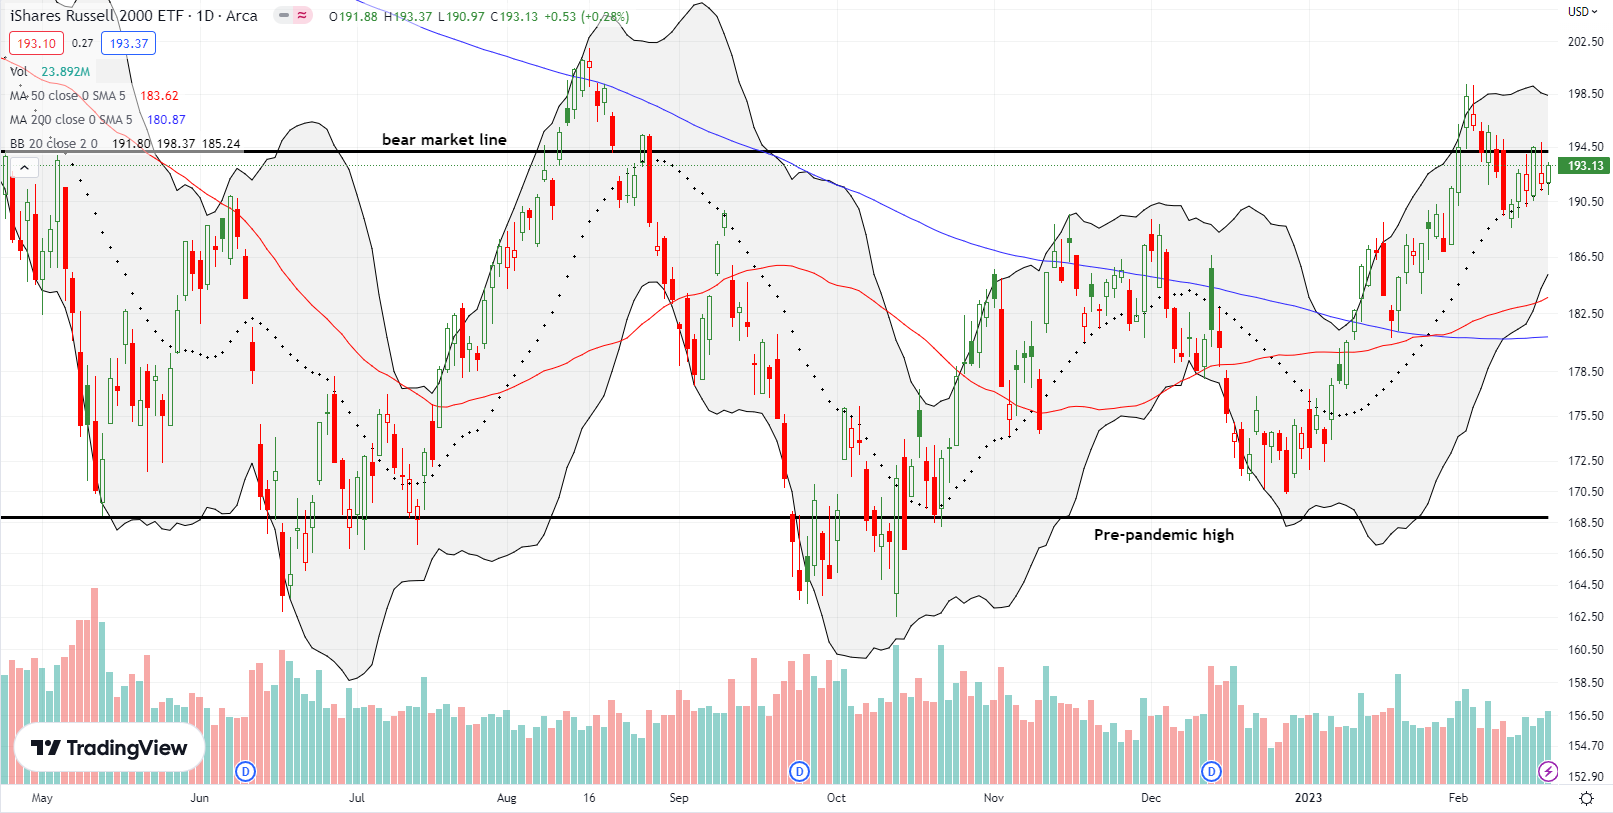
The iShares Russell 2000 ETF (IWM) continues to put on a poetic display of defending support at its 20DMA. The ETF of small caps has incredibly tagged its 20DMA seven straight days. During this time, IWM has also tapped resistance at its bear market line three times. Like the NASDAQ, I am on alert for an explosive resolution of this seesaw action as the 20DMA converges with the bear market line. Of course, IWM could continue to frustrate resolution by pivoting around converged support and resistance!
Stock Market Volatility
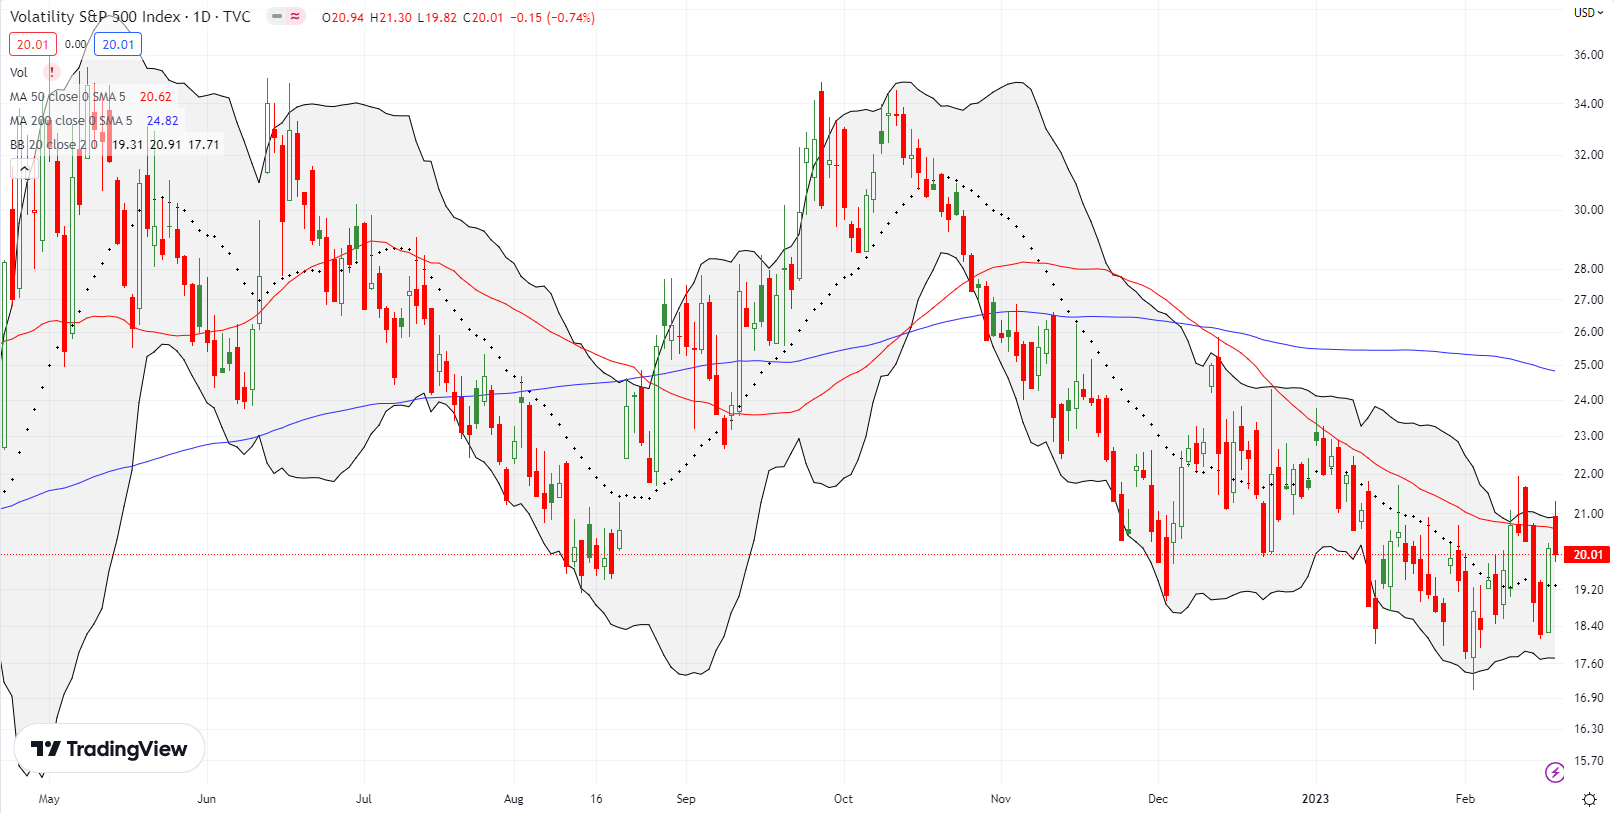
The volatility index (VIX) managed to avoid breaking down to new lows. So now I am more convinced that February 1st marked a sustainable low for the VIX. The CNBC Options Action gang showed how a choppy uptrend from the 2017 low suggests that the VIX is due for a fresh surge. Extremely heavy call option buying on VIX futures added support to “a vol event brewing”. Four of the last five days last week featured options volume higher than January’s highest volume of trading.
The Short-Term Trading Call With Seesaw Trading
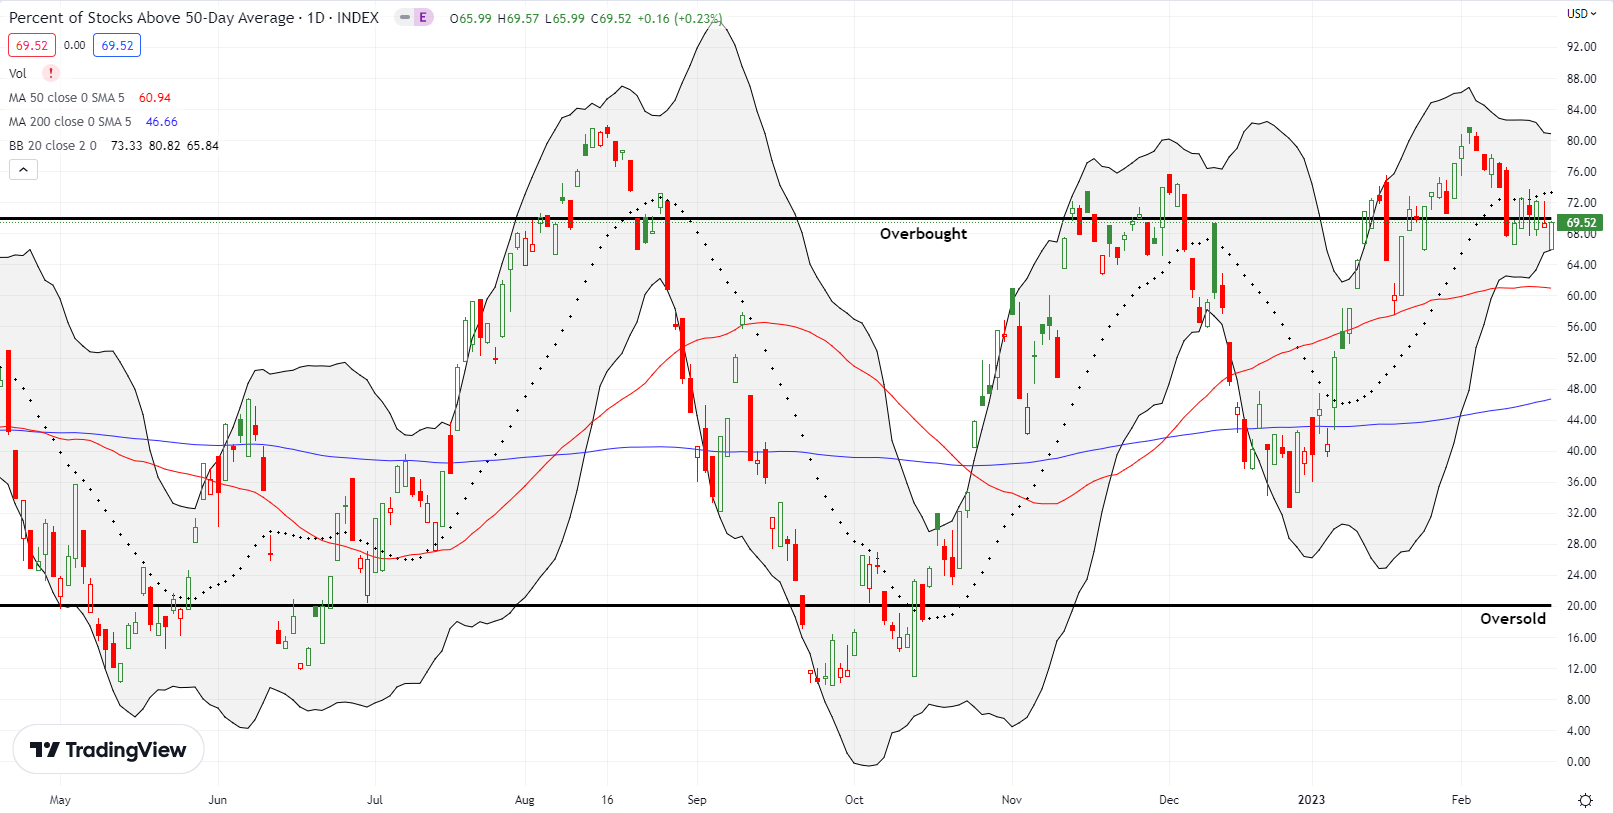
- AT50 (MMFI) = 69.5% of stocks are trading above their respective 50-day moving averages (3rd day overbought)
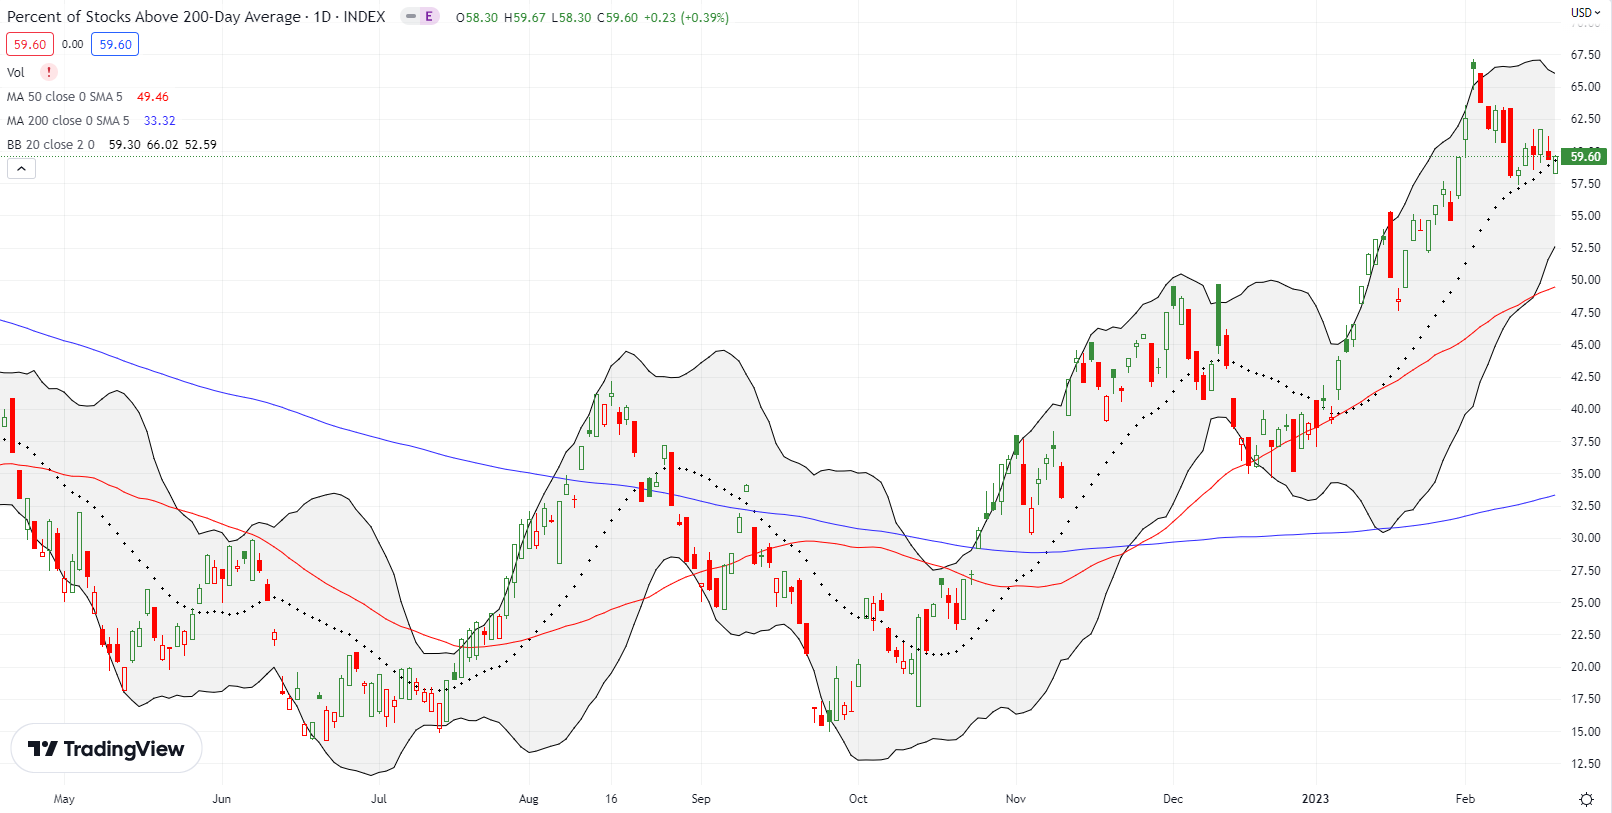
- AT200 (MMTH) = 59.6% of stocks are trading above their respective 200-day moving averages
- Short-term Trading Call: neutral
AT50 (MMFI), the percentage of stocks trading above their respective 50DMAs, fell from overbought trading conditions after a 3-day visit. The moves are all marginal as my favorite technical indicator essentially pivots around the 70% overbought threshold. Accordingly, I have no strong conclusions from the trading action. The short-term trading call stays at neutral until AT50 closes below the current range. At that point, I will return to cautiously bearish. A confirmed breakout for the VIX may serve as a confirming force.
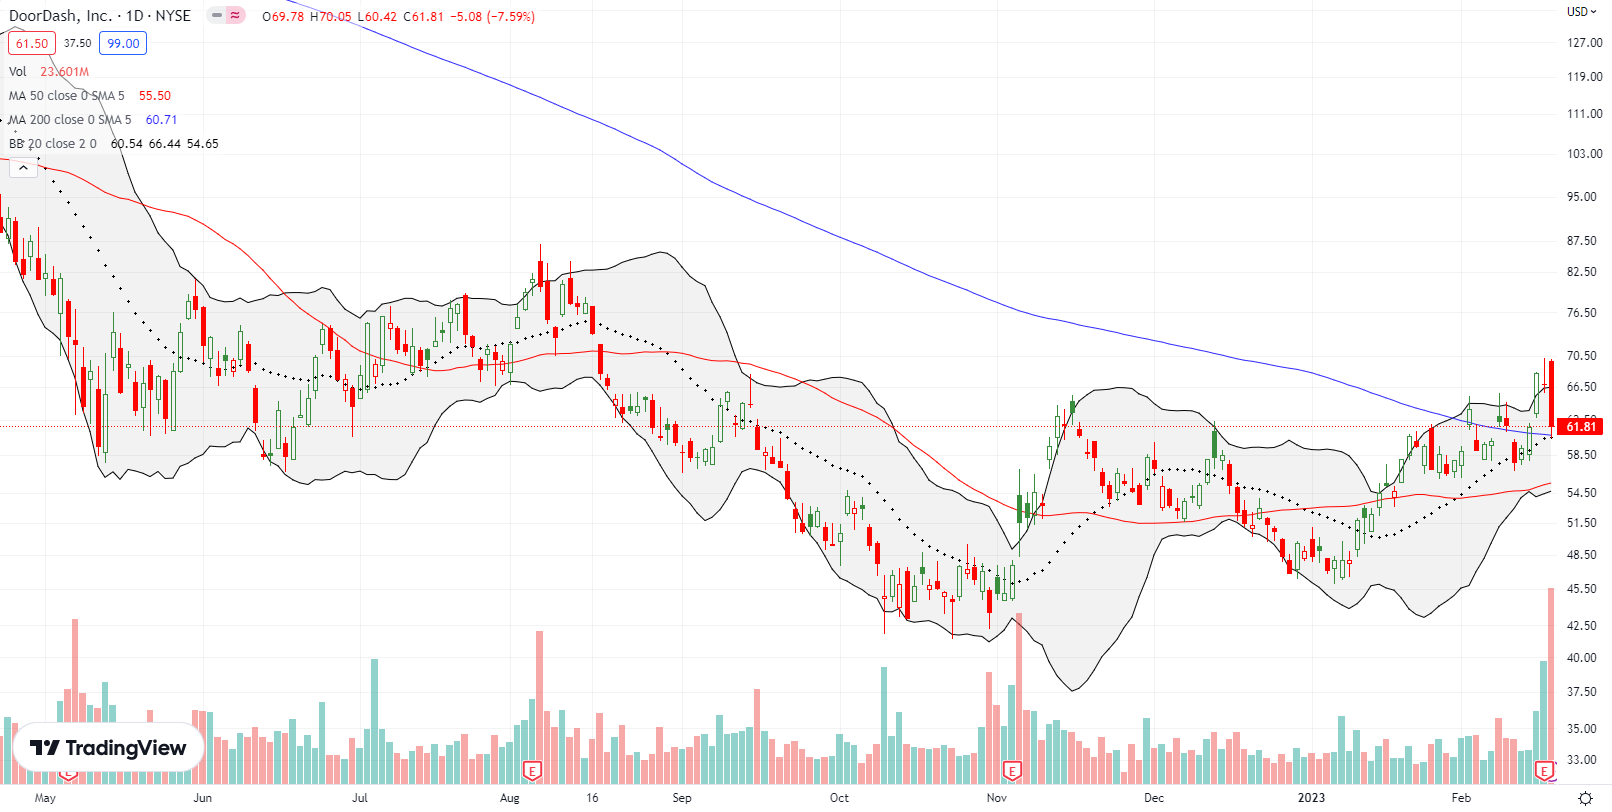
The “bullish bear market” took a hit in some key stocks. DoorDash, Inc (DASH) looked set to extend its 200DMA breakout after the stock opened with a 4.3% post-earnings gain. Sellers took over from there and created a vicious fade to a 7.6% loss. Buyers tentatively held on to support at the converged 20DMA and 200DMA support. The squeeze on the trend lines makes for tricky trading. Thus, I am content to wait out resolution from a post-earnings closing high or a 50DMA breakdown.
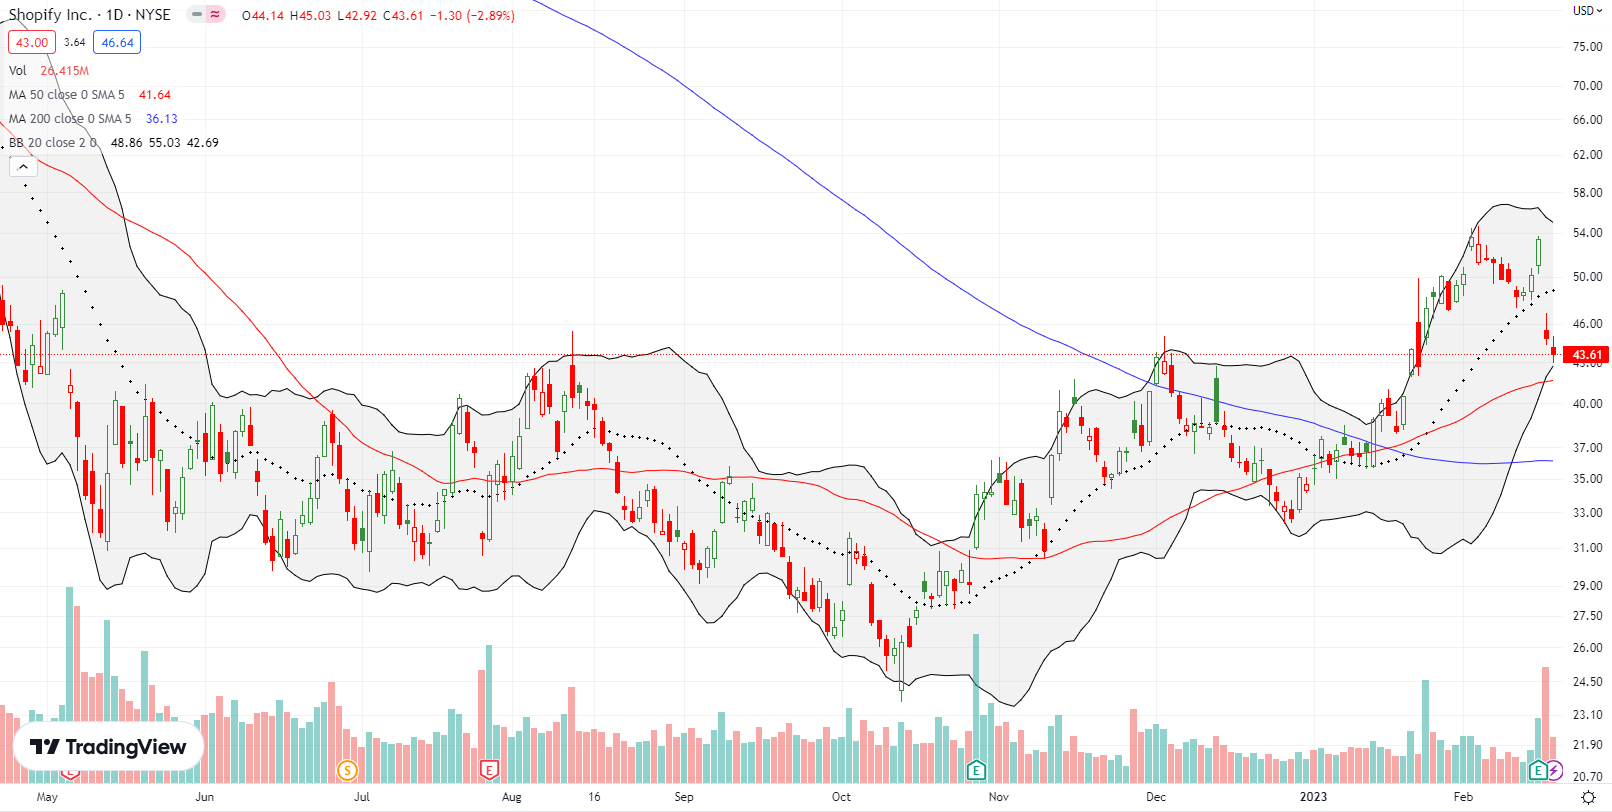
Shopify Inc (SHOP) looked poised for a fresh confirmation of its bullish breakout. Buyers rallied off 20DMA support only to get hit the next day with a 15.9% post-earnings loss. With selling slowing down on Friday to a 2.9% loss, the uptrending 50DMA looks ready for a try at providing sustained support.
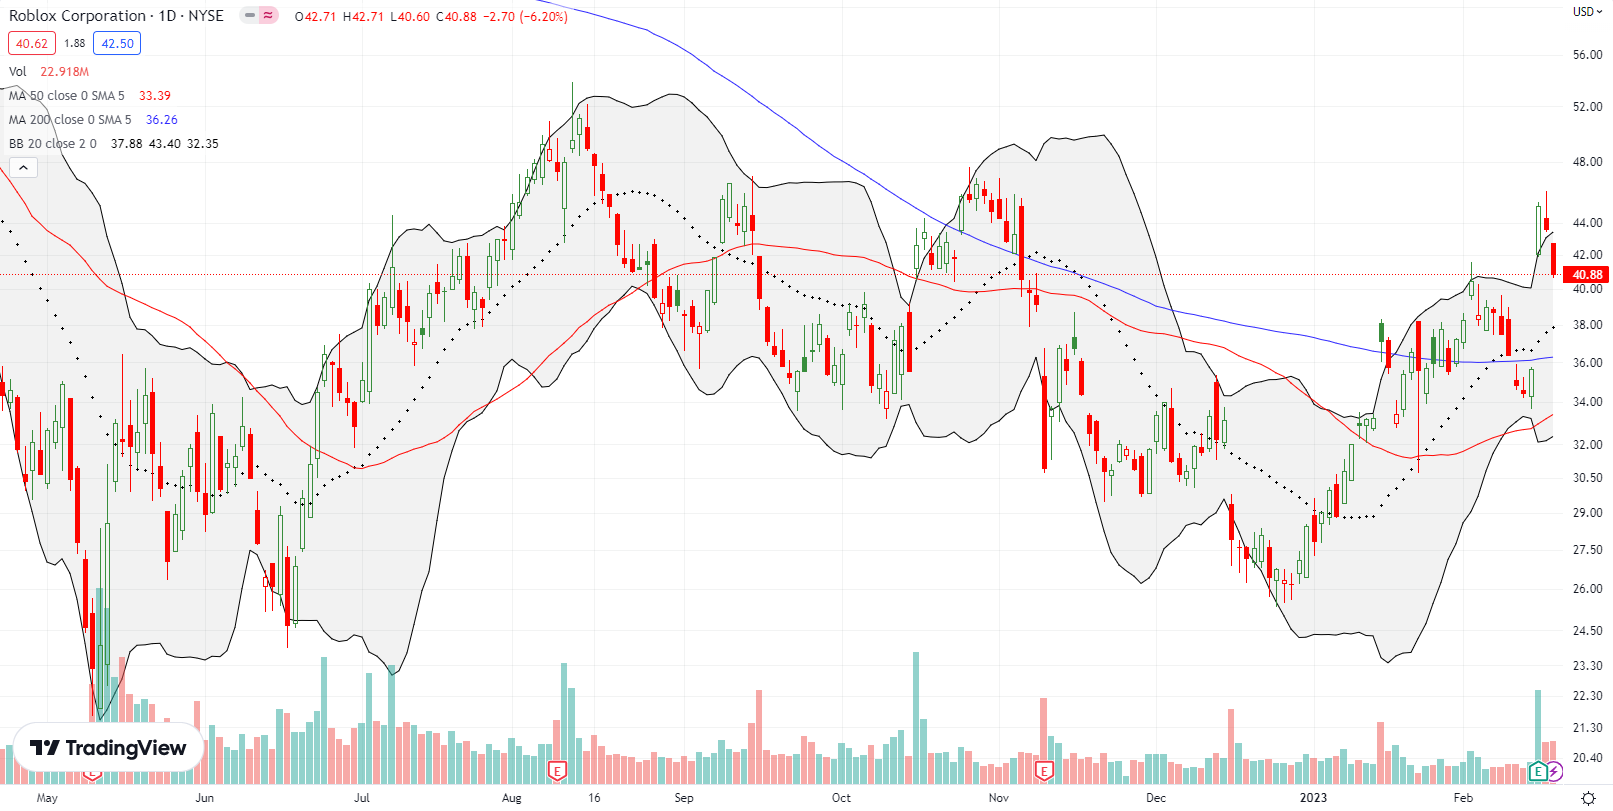
Roblox Corporation (RBLX) soared 26.4% post-earnings but stopped short of challenging the October highs. The gaming platform company followed up earnings with news about integrating generative AI capabilities in the platform. The functionality promises to accelerate the creation of games and expand the ability to customize gaming features. Despite the news, sellers continued to take profits from the post-earnings gains. RBLX closed the week right on top of the former February closing high. I will speculate again on RBLX if that high holds as support. If support gives way, RBLX will be at risk for losing all its post-earnings gain.
Be careful out there!
Footnotes
Subscribe for free to get email notifications of future posts!
“Above the 50” (AT50) uses the percentage of stocks trading above their respective 50-day moving averages (DMAs) to measure breadth in the stock market. Breadth defines the distribution of participation in a rally or sell-off. As a result, AT50 identifies extremes in market sentiment that are likely to reverse. Above the 50 is my alternative name for “MMFI” which is a symbol TradingView.com and other chart vendors use for this breadth indicator. Learn more about AT50 on my Market Breadth Resource Page. AT200, or MMTH, measures the percentage of stocks trading above their respective 200DMAs.
Active AT50 (MMFI) periods: Day #86 over 20%, Day #82 over 30%, Day #31 over 40%, Day #31 over 50%, Day #26 over 60%, Day #2 under 70% (underperiod)
Source for charts unless otherwise noted: TradingView.com
Full disclosure: long QQQ puts
FOLLOW Dr. Duru’s commentary on financial markets via StockTwits, Twitter, and even Instagram!
*Charting notes: Stock prices are not adjusted for dividends. Candlestick charts use hollow bodies: open candles indicate a close higher than the open, filled candles indicate an open higher than the close.


