
Stock Market Commentary:
This stock market is one bullish bear market. A bear market perhaps cannot get more bullish than the current market. Since the October lows, the various indices have shown a general upside bias. As much time that I have spent the last several weeks looking for excuses to get bearish, the market has worked harder to find reasons to drift higher. Last week, I concluded that the last drop from overbought trading territory marked a warning for this week and the January CPI report. Instead, the market found yet more reasons to nudge higher.
Retail sales was today’s surprisingly strong piece of economic data. I did not hear anyone deconstruct the numbers to come up with a negative narrative about the consumer. Such a feat would have been difficult given no retail category experienced a decline in sales. Since SPDR S&P Retail ETF (XRT) gained 2.5%, I assume the long-awaited recession has been delayed yet again. The bond market decided the retail data justified slightly higher bond yields. Slowly but surely, the stock market seems to numb to the hawkish implications of good economic news. Perhaps an economic “soft landing” looks more and more likely to market participants.
I am now monitoring the recession predictions from the Federal Reserve of Cleveland. (I am surprised that anyone at the Fed is comfortable talking about the odds of a recession!) The current data projects a recession going above 50% starting in December. This projection is based on the yield curve from Treasury bonds (which suggests the yield curve is indeed predictive of recessions!).
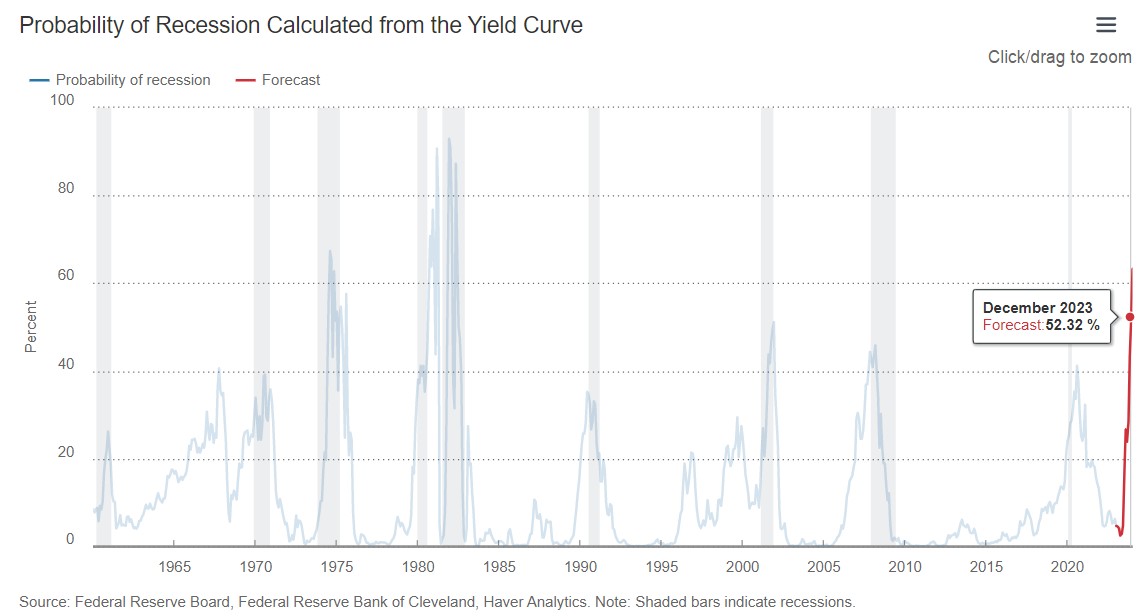
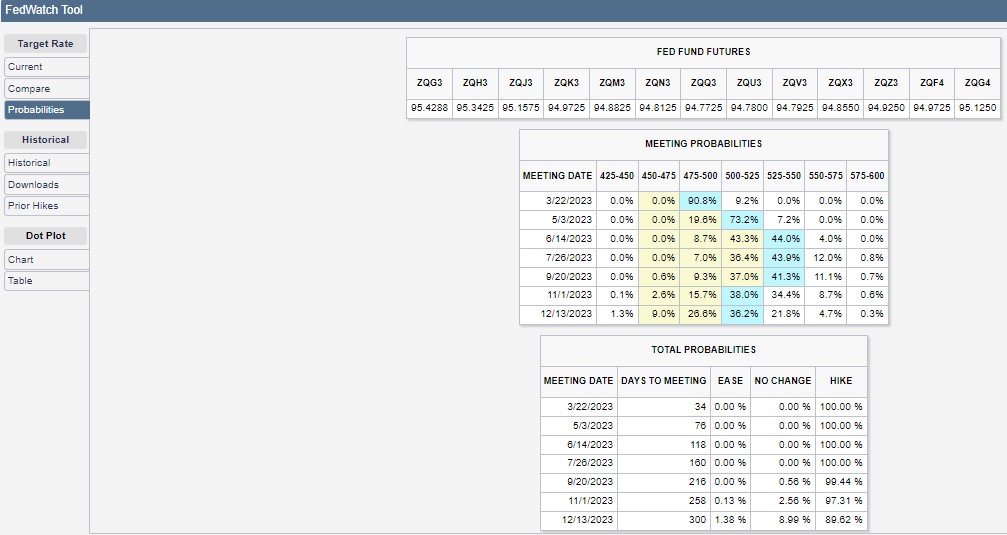
Note that a December start to a recession neatly coincides with the Fed Fund futures prediction of a first rate cut. Presumably, economic weakness will build going into a recession. One plausible scenario featured the Fed waiting out the weakness as long as possible. At the edge of that recession, the clamor will become unbearable enough to push the Fed into its next rate cut cycle.
The Stock Market Indices
The S&P 500 (SPY) has effectively churned the entire month of February after breaking out above the May, 2021 low. While I have looked for reasons for this support to give way, the index has chosen to hold that support. While today’s 0.3% gain was too tepid to signal an imminent breakout, the price action is supportive of an eventual breakout. This week’s generally positive price action confirmed support at the 20-day moving average (DMA) (the dashed line below).
The S&P 500 left its bear market behind with the December lows. Subsequent breakouts have given the index a more and more bullish tone. However, it needs to conquer the August highs to be more convincing.
")
The NASDAQ (COMPQ) is looking persistent in its rebound right back to resistance at its September, 2020 high. While the tech-laden index did not quite test its 20DMA support, another breakout would effectively confirm this uptrend.
")
The iShares Russell 2000 ETF (IWM) has put on a poetic display of defending support at its 20DMA. The ETF of small caps has tagged the 20DMA four straight days. IWM closed the day right on top of its bear market line with a 1.0% gain. I certainly thought last week’s return to bear market territory would last a lot longer.
")
Stock Market Volatility
The volatility index (VIX) is wavering all over again. I thought last week’s VIX wake-up call signaled a bottom for volatility. Now, the last two sharp declines put that bottom on notice of a likely test. A lower close would confirm the market’s refreshed bullish bias even as a bear market continues.
")
The Short-Term Trading Call With A Bullish Bear Market
- AT50 (MMFI) = 72.2% of stocks are trading above their respective 50-day moving averages (3rd day overbought)
- AT200 (MMTH) = 61.7% of stocks are trading above their respective 200-day moving averages
- Short-term Trading Call: neutral
AT50 (MMFI), the percentage of stocks trading above their respective 50DMAs, returned to overbought trading conditions after just a 2-day hiatus. The skeptic in me looks warily at my favorite technical indicator pivoting around the 70% threshold for overbought territory. My inclination to defer to market sentiment tells me to concede to this bull market nestled within a bear market. The awkwardness of this market setup keeps me firmly planted in neutral for the short-term trading call.
The signs of the bullish bear market are most evident in the stocks that received historic beatings last year.
Roku, Inc (ROKU) made a double top just under $500/share in 2021. ROKU lost about 50% from there to the end of 2021. The stock lost another 82% in 2022. So 2023’s 56.0% gain is bullish for this year but a speck compared to the larger context of ROKU’s bear market. The stock rallied 12.1% ahead of reporting earnings tonight. ROKU motivated investors to the tune of another 10.6% gain in the after hours by saying things like “advertising spend on our platform continues to grow more slowly than our beginning-of-year forecast due to current weakness in the overall TV ad market and the ad scatter market in particular…We continue to increase our share of advertising spend as traditional TV audiences decline.”
")
Twilio Inc (TWLO) laid off 12% of its workforce last September. The company announced another 17% cut two days ago. These layoffs apparently paved the way to make another shareholder friendly announcement in Q4 2022 earnings. TWLO announced its board authorized a stock repurchase of up to $1B in shares, including a commitment to buy $500M of stock in the next 6 months. Lawson explained the move as an opportunistic reallocation of capital:
“Ordinarily, I wouldn’t consider a buyback the best use of our balance sheet. But this program reflects our confidence in the business and our belief that our current share price undervalues our position in the market today and the long-term opportunity ahead, while still leaving us with a strong balance sheet to execute our strategy.”
CEO Jeff Lawson is leading the celebration of a leaner, stock buying machine with a $10M purchase of his own.
I interpreted the 17% layoff as ominous news about the condition of the company. I summarily bought a pre-earnings put spread. Lesson learned! Sometimes companies who remain confident in their businesses just have better uses for their money than spending it on employees (=shrug=).
")
Apple Inc (AAPL) is one of the more convincing signs of a bullish bear market. AAPL has held firm since breaking out above its 200DMA (the bluish line below) just ahead of earnings. AAPL closed the day with a 1.4% gain and a 4-month high. Another close higher, and AAPL could very well make a run at least summer’s high….which would carry the rest of the market along.
")
")
")
Be careful out there!
Footnotes
Subscribe for free to get email notifications of future posts!
“Above the 50” (AT50) uses the percentage of stocks trading above their respective 50-day moving averages (DMAs) to measure breadth in the stock market. Breadth defines the distribution of participation in a rally or sell-off. As a result, AT50 identifies extremes in market sentiment that are likely to reverse. Above the 50 is my alternative name for “MMFI” which is a symbol TradingView.com and other chart vendors use for this breadth indicator. Learn more about AT50 on my Market Breadth Resource Page. AT200, or MMTH, measures the percentage of stocks trading above their respective 200DMAs.
Active AT50 (MMFI) periods: Day #82 over 20%, Day #78 over 30%, Day #27 over 40%, Day #27 over 50%, Day #22 over 60%, Day #3 over 70% (overperiod)
Source for charts unless otherwise noted: TradingView.com
Full disclosure: long QQQ put spread
FOLLOW Dr. Duru’s commentary on financial markets via StockTwits, Twitter, and even Instagram!
*Charting notes: Stock prices are not adjusted for dividends. Candlestick charts use hollow bodies: open candles indicate a close higher than the open, filled candles indicate an open higher than the close.