

Housing Market Intro and Summary
In my last Housing Market Review, I laid out the case for bracing for what 2023 would bring even as “faint signs of a bottoming for sentiment have started to appear.” The latest housing data and industry expectations suggest that the market is well-braced for 2023. The signs of bottoming are pointing to a stabilization in the housing market, especially in the market for new homes where sufficient inventory is keeping sales moving as mortgage rates decline. Improving sentiment and a stabilization in housing starts points to expectations for a relatively healthy spring selling season, all things considered.
Housing Stocks
The stock market moved well in advance of this year’s stabilization. The iShares US Home Construction ETF (ITB) last bottomed in June and made a higher low in October. ITB’s pre-pandemic high featured prominently in this bottoming process (see the chart below). ITB is now up 18.0% year-to-date. The ETF is significantly outpacing the S&P 500 (SPY) and its 7.7% gain year-to-date. Thus, the seasonal trade on homebuilders is performing well ahead of expectations.
")
Buying in ITB intensified last week; the ETF shot up in near-parabolic fashion. Parabolic price action is not sustainable, so I sold all my shares in ITB and effectively ended my trade on the seasonal strength in home builders. However, given the existing uptrend, I will definitely consider restarting the trade on a dip to support whether at the 20-day moving average (DMA) (the dotted line above) and/or, even better, the 50DMA (the red line).
Last month, I wrote about the notable optimism oozing from the earnings reports of home builders. That optimism seemed to represent a stark contrast to macroeconomic headwinds. Now, I am bracing to see just how much that optimism may have overshot the reality of what stabilization will look like in 2023.
Housing Data
New Residential Construction (Single-Family Housing Starts) – December, 2022
Housing starts rebounded significantly in December. Starts increased 11.3% month-over-month to 909,000. Starts decreased 25.0% year-over-year. November’s starts were revised downward to 828,000. The 800K level actually held firm as a “support” level. This rebound coincides with an apparent bottoming in sentiment for builders and provides a sense that the housing market is finally stabilizing.
![Source: US. Bureau of the Census, Privately Owned Housing Starts: 1-Unit Structures [HOUST1F], first retrieved from FRED, Federal Reserve Bank of St. Louis, January 31, 2023](https://drduru.com/onetwentytwo/wp-content/uploads/2023/01/20230131_Housing-Starts.png "Housing starts")
Housing starts declined year-over-year in three of four regions. The Northeast stood out with an unusual surge in starts. The Northeast region’s starts were last this high in May, 2006! The surge was so shocking, I emailed the Census Bureau hoping for an explanation. Here is the response I received:
“You are right in that the Northeast Single Family and the total did have a large increase this month and we spent a lot of time reviewing and discussing it. There were no changes in methodology or measurement this month…
Knowing the Survey of Construction is a relatively small sample with higher margins of error, we do get projects that can impact the estimates once they are weighted up to what they represent for the region. I would also look at the role seasonal adjustment is playing, which is generally expecting less starts in the Northeast in December. Taking a look at the not-adjusted data will show you what impact seasonal adjustment had on it and what increase came from the underlying projects that started this month.
I can say that we validated all the information and made sure all of our outlier adjustments and survey processes were working as intended. Keeping in mind the volatility we have in monthly data, especially in the smaller Northeast region, I would recommend keeping an eye on a three-month moving average and looking at the permit authorization data, which is more accurate and not sample based.”
Unadjusted for seasonality, starts in the Northeast surged 89.6%. So the seasonal adjustment actually brought the rate of change downward. The data for privately-owned housing units authorized, but not yet started, did not reveal any surges over the past year. Thus, I have to assume that December’s big increase in Northeast starts represents a fluke, likely a coincidental convergence of projects that are catching up to accumulated authorizations (or perhaps some municipalities have lags in reporting permits). I will of course be keeping an eye on what happens in the Northeast in the coming months!
Housing starts in the Northeast, Midwest, South, and West each changed +85.5%, -56.6%, -25.8%, and -26.4% respectively year-over-year.
Existing Home Sales – December, 2022
Another month, another slow continuation of existing trends for existing home sales.
Existing home sales dropped for an eleventh month in a row. The drop completed a steep and persistent downtrend for 2022. The seasonally adjusted annualized sales in December of 4.02M decreased 1.5% month-over-month from the 4.08M in existing sales for November (downwardly revised from 4.43M). Year-over-year sales decreased 34.0%. Sales dropped further below the pre-pandemic existing home sales activity between 5.0M to 5.5M in 2019 and 2018. Sales were last this low in 2012 excluding the crash at the onset of the pandemic. Per the National Association of Home Builders (NAHB):
“On a year-over-year basis, sales were 34.0% lower than a year ago. In 2022, existing sales totaled 5.03 million, down from 17.8% from 2021. This marks the lowest annual total since 2014 and the largest annual decline since 2008. The month-over month decline is the longest run of declines since 1999.”

(For historical data from 1999 to 2014, click here. For historical data from 2014 to 2018, click here) Source for chart: National Association of Realtors, Existing Home Sales© [EXHOSLUSM495S], retrieved from FRED, Federal Reserve Bank of St. Louis, January 20, 2022.

December’s absolute inventory level of 970K homes decreased 13.4% from November and increased 10.2% year-over-year. According to the NAR, “unsold inventory sits at a 2.9-month supply at the current sales pace, down from 3.3 months in November but up from 1.7 months in December 2021.” The on-going tightness in inventory creates a housing recession where both buyers and sellers are hesitant.
Despite the drop in inventories, the time it took for buyers to take a home off the market increased again. The average 26 days it took to sell a home in December was 2 days above the 24 days in November and up from 19 days a year ago. The 57% of homes that sold within one month represents an on-going decline from the 61% in September, 64% in October, 70% in September and 81% in August. Buyers are less and less enthused by what is left for sale.
Prices continue to creep sequentially downward. The median price of an existing home decreased 1.5% month-over-month to $366,900 and increased 2.3% year-over-year. Prices have risen year-over-year for 130 straight months, an on-going record streak. The current trend still looks on track to end in March or April of 2023. I am still expecting the media to ring fresh alarm bells about the housing market once existing home sales register the first negative year-over-year change.
The sequential price decline may have finally stirred more first-time home buyers on a relative basis. Their share of sales increased to 31% from 28% the prior month and 30% a year ago. The NAR’s 2017 Profile of Home Buyers and Sellers reported an average of 34% for 2017, 33% for 2018, 33% for 2019, 31% for 2020, 34% for 2021, and 26% for 2022. The share for 2022 is the lowest on record for the NAR.
All regions declined significantly in sales year-over-year with the two biggest regions yet again suffering the largest percentage losses. The regional year-over-year changes were: Northeast -28.8%, Midwest -30.3%, South -33.1%, West -43.4%. Only the West avoided a month-over-month decline by coming in flat with November.
Each region continues to experience a slowing in the pace of year-over-year gains in the median sales price. The West has the most notable slowdown in pace. The regional year-over-year price gains were as follows: Northeast +1.6%, Midwest +2.9%, South +3.5%, West less than +0.1%.
Single-family existing home sales decreased 1.1% from November and declined on a yearly basis by 33.5%. Per the above graph, sales for existing single-family homes pushed further below the pandemic low set in May, 2020. The median price of $372,200 was up 2.0% year-over-year.
California Existing Home Sales – December, 2022
The California Association of Realtors (C.A.R.) also interpreted December’s numbers as a sign of stabilization:
“As buyers and sellers gradually adapt to the new normal, we are seeing a shift toward a more balanced market. With both sides slowly adjusting their expectations, it’s hopeful that we’ll see sales ratcheting higher as market conditions improve further throughout 2023”
California sales of existing single-family homes increased 1.1% from November to 240,330. Year-over-year, sales till fell a whopping 44.1% year-over-year, an 18th straight month of year-over-year declines in California.
In November, California’s median sales price crossed the negative year-over-year mark for the first time in 30 months. For December, prices fell 2.8% year-over-year and down 0.4% from November for the fourth monthly price decline in a row. The month-over-month price decline on a square footage basis was $392 to $377 for a 3.8% drop. Year-over-year this price fell just 1.3%.
Bidding wars were rapidly fading from California’s market before October’s apparent pause in the trend. The statewide sales-price-to-list-price ratio stayed below 100.0% for the fifth month in a row and still looks set to remain there for the duration of the housing market recession. This ratio dropped slightly to 96.2% in December from 96.7% in November from 97.3% in October and 101.2% a year ago. The median time to sell a home in California increased from 19 days in August to 22 in September to 24 in October and held steady in November at 24 days. The duration increased further in December to 28 days. The duration was just 12 days a year ago.
Inventory declined to over 2.4 from November’s 3.3 months for the Unsold Inventory Index (UII). The UII was just 1.2 a year ago (and 1.6 a year ago November). The changes in inventory were broad-based. Per the C.A.R., “all price ranges recorded an increase in UII from a year ago by 92 percent or more, with the unsold inventory in the $1 million and higher price range gaining the most (154.5 percent), followed by the $750,000 – $999,000 price range (145.5 percent), the $500,000 – $749,000 (136.4 percent), and the sub-$500,000 segment (92.9 percent).” C.A.R. did not provide an aggregate change in active listings for the state. Forty-seven of 51 counties experienced an increase in active listings (compare to 46 in November).
In the October report, C.A.R. President Jennifer Branchini projected that “…the market bottom could be in sight.” For November, C.A.R. Vice President and Chief Economist Jordan Levine added a little bit of data to point toward support for this optimism: “…pending sales suggest that the pace of declines should moderate in the coming months.” December may yet represent the confirmation of this bottoming out.
New Residential Sales (Single-Family) – December, 2022
New home sales delivered the clearest sign of some kind of stabilization. As mortgage rates continued to rise and dampen demand, home builders moved quickly to keep sales going. The results show an apparent bottoming between July and September of last year.
December new single-family home sales of 616,000 were up 2.3% from November’s 602,000 (revised down from 640,000). Sales were still down 26.6% year-over-year. The key support at 550,000 in sales continues to hold.
![Source: US. Bureau of the Census, New One Family Houses Sold: United States [HSN1F], first retrieved from FRED, Federal Reserve Bank of St. Louis, January 31, 2023](https://drduru.com/onetwentytwo/wp-content/uploads/2023/01/20230131_New-Home-Sales.png "new home sales")
December’s decline in median price signaled a likely top in prices for 2023. A shift in sales mix toward homes priced under $399,999 helped bring the median down to $442,110. The rocket ship of price that launched after the pandemic started created a steep uptrend in prices. Price relief looks like it has finally started.

Inventory stabilized at 9.0 months of sales, compare to the 8.9 and 8.6 in the previous two months. The market is over-supplied given inventory sits above the 6.0 level that is the benchmark for a balanced market. Yet, it still seems ample inventory is key to sales volumes given the on-going sales downtrend in the market for existing homes.
The year-over-year decline in sales was led by the West. The Northeast, Midwest, South, and the West changed -21.6%, -14.1%, -17.5%, and -49.6% respectively. The Midwest and the South had sizeable month-over-month sales increases.
As I expected earlier, the Northeast’s countertrend in new home sales stalled out. The decline from November looks like a part of stabilization. In the coming months, sales could surge again given the jump in starts for December.
Home Builder Confidence: The Housing Market Index – January, 2023
The National Association of Home Builders (NAHB)/Wells Fargo Housing Market Index (HMI) ended a 12-month losing streak. January’s HMI jumped to 35 from December’s 31. The NAHB speculated on a bottom in sentiment and threw in its vote for stabilization in the market for 2023:
“It is possible that the low point for builder sentiment in this cycle was registered in December, even as many builders continue to use a variety of incentives, including price reductions, to bolster sales. The rise in builder sentiment also means that cycle lows for permits and starts are likely near, and a rebound for home building could be underway later in 2023.”
The NAHB went on to forecast a year-over-year decline in starts for 2023. However, it also expects a continued decline in mortgage rates to stoke more demand and create a cycle low for sales.
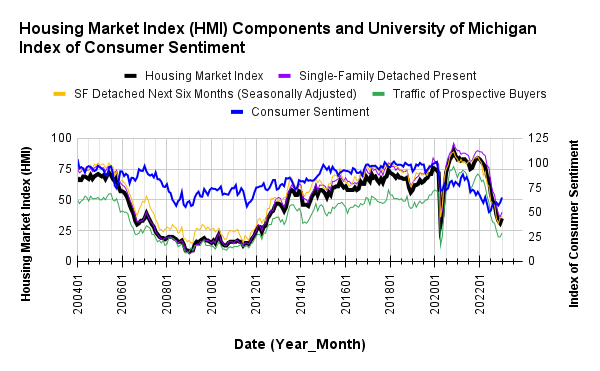
In the last Housing Market Review I projected that “buoyancy in consumer sentiment should eventually bleed out to builders given the two sentiment figures rarely diverge for long.” January appears to be the month when the on-going improvement in consumer sentiment helped to pick up the spirits of builders. The graph below also suggests that builder sentiment may have bottomed out right above the pandemic lows.
/Wells Fargo Housing Market Index (HMI) and the University of Michigan Index of Consumer Sentiment")
Source for data: NAHB and the University of Michigan
An overlay with the HMI components shows that the traffic of prospective buyers led sentiment down but could now be leading the bottoming process. This component was the one of the three that did not undercut its pandemic low. All three components increased in concert in January.
All four regions experienced month-over-month increases for HMI. The Northeast increased from 32 to 34 after holding steady in December. The Midwest also increased by 2 points, going from 30 to 32 after plunging in December. The South is leading the bottoming process. After being the only region in December to increase its HMI, the South jumped 4 points in January. This jump is consistent with my previous claim: “If a bottom in builder sentiment is imminent, the South must be the region that will lead the way to stabilization.” The West enjoyed the largest percentage gain going from 25 to 29 in January. Sentiment in the West still lags the other three regions.
Home closing thoughts
The Challenges In Building Affordable Housing
All sorts of obstacles confront anyone trying to build affordable housing. By definition, affordable housing is not economical and thus requires non-market solutions. For example, subsidies from the government or the private sector are typically required to make affordable housing work. KQED’s “Bay Curious” broadcast a story last month that described the challenges facing religious groups who want to build affordable housing on their own property. This podcast was based on an article written last August by Adhiti Bandlamudi titled “California Churches Want to Build Affordable Housing on Their Land, So Why Is It So Hard?“
The article described a rare success that made it through familiar obstacles: “the project’s road to completion was a long and tiresome one with all the usual speed bumps that face affordable housing developments: high construction costs, bureaucracy and neighbors saying ‘not in my backyard.'” The article provides other examples of religious organizations struggling through the obstacles to provide affordable housing for seniors and others.
Spotlight on Mortgage Rates
The 30-year fixed rate mortgage continues its descent as inflation fears wane. Since the last Housing Market Review, the rate has dropped from 6.3% to 6.09%. The mortgage rate is now already below Freddie Mac’s October forecast for the mortgage rate at the end of 2023 (the next quarterly forecast was not available at the time of writing). During January, the Mortgage Bankers Association (MBA) reported three of four weeks with weekly increases in mortgage applications. The inverse correlation between the direction of mortgage rates and the direction of mortgage applications seems relatively consistent now.
The MBA offered up its own vote for stabilization in the housing market in its latest mortgage application report:
“Purchase activity is expected to pick up as the spring homebuying season gets underway, bolstered by lower rates and moderating home-price growth. Both trends will help some buyers regain purchasing power.”
![Source: Freddie Mac, 30-Year Fixed Rate Mortgage Average in the United States [MORTGAGE30US], retrieved from FRED, Federal Reserve Bank of St. Louis, February 5, 2023](https://drduru.com/onetwentytwo/wp-content/uploads/2023/02/20230205_30-Year-Fixed-Rate-Mortgage.png)
Be careful out there!
Full disclosure: long ITB shares