Stock Market Commentary:
Last week ended the overbought period with a relatively strong report on initial claims for unemployment. The stock market – still freshly stung with the memory of the previous week‘s exceptionally strong jobs report – sold off sharply in response to the good economic news. A stubbornly resilient labor market continues to push out the perceived date for the next recession. Moreover, the longer the jobs market remains strong in aggregate, the more likely the CPI (Consumer Price Index) will produce a new upside surprise for inflation. All combined, the Federal Reserve has every reason to keep interest rates higher for longer and to hold fast to the process of normalizing rates. So this string of good employment news is a potential sign of trouble ahead from the CPI. The next CPI report comes out Tuesday.
The “lagging indicator” of a strong jobs market apparently wants to keep dragging out the inevitable recession. The ironies only deepen as we approach at least a year since pundits started claiming the economy was already in a recession. Note well, I do not continue to pound home this point to claim that all is well and no one is suffering in this economy. Obviously, there is always a baseline of economic suffering in this economy. However, investors and traders need to maintain disciplined definitions of economic principles which in turn translates into disciplined trades. My claim should be especially true during this unprecedented time that has undermined all sorts of conventional wisdoms.
The Stock Market Indices
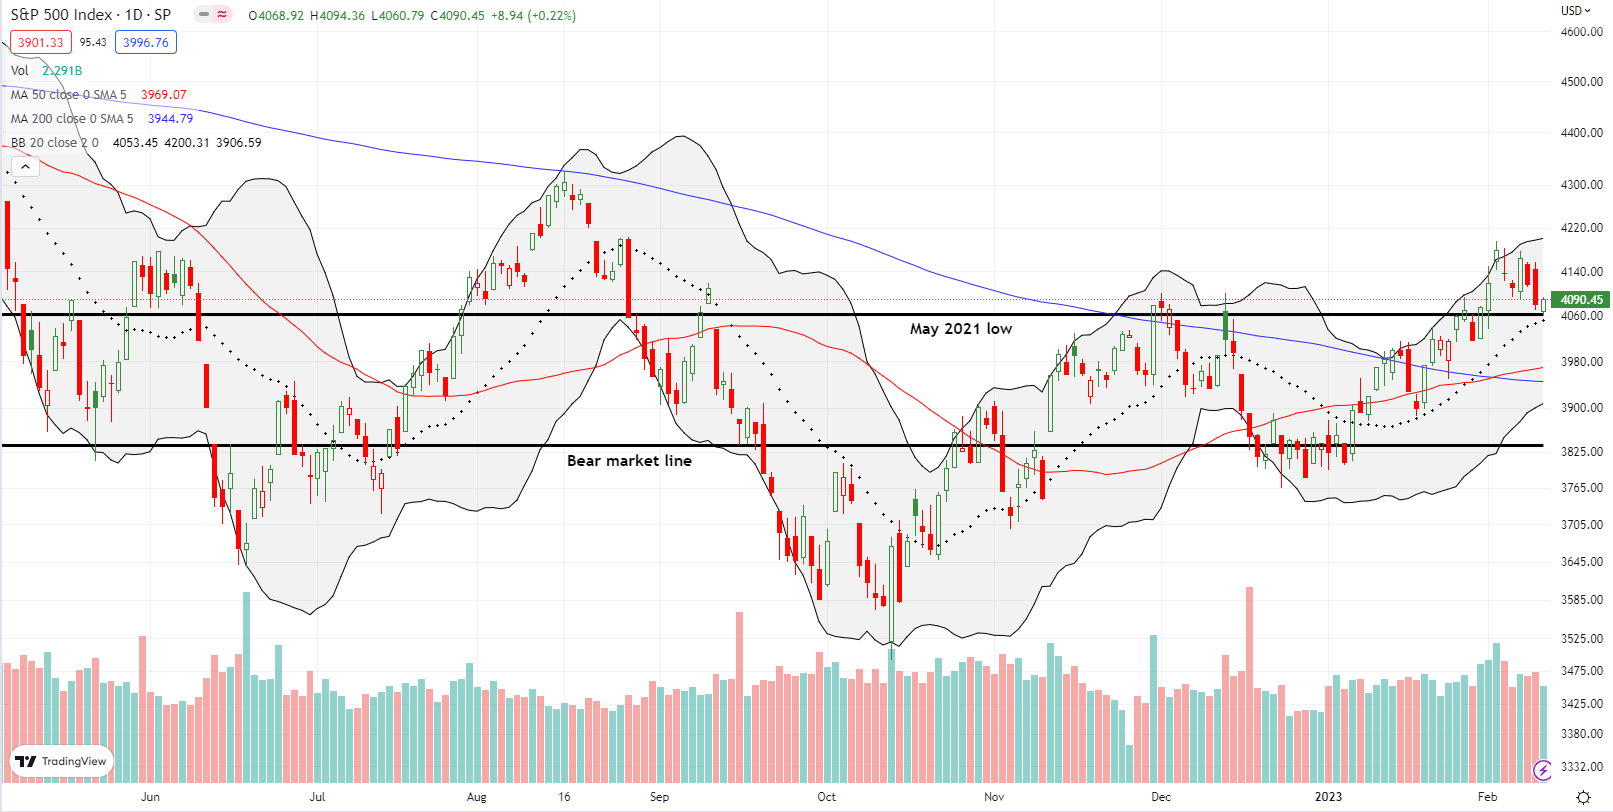
The S&P 500 (SPY) lost 1.1% on the week but found convenient support at the converging May, 2021 low and the uptrending 20-day moving average (DMA) (the dotted line below). So while the end of overbought trading signaled trouble ahead, the S&P 500 did its best to hold out hope for an immediate rebound. The CPI report should prove critical for differentiating the S&P 500 from a toppy pattern and a successful test of support.
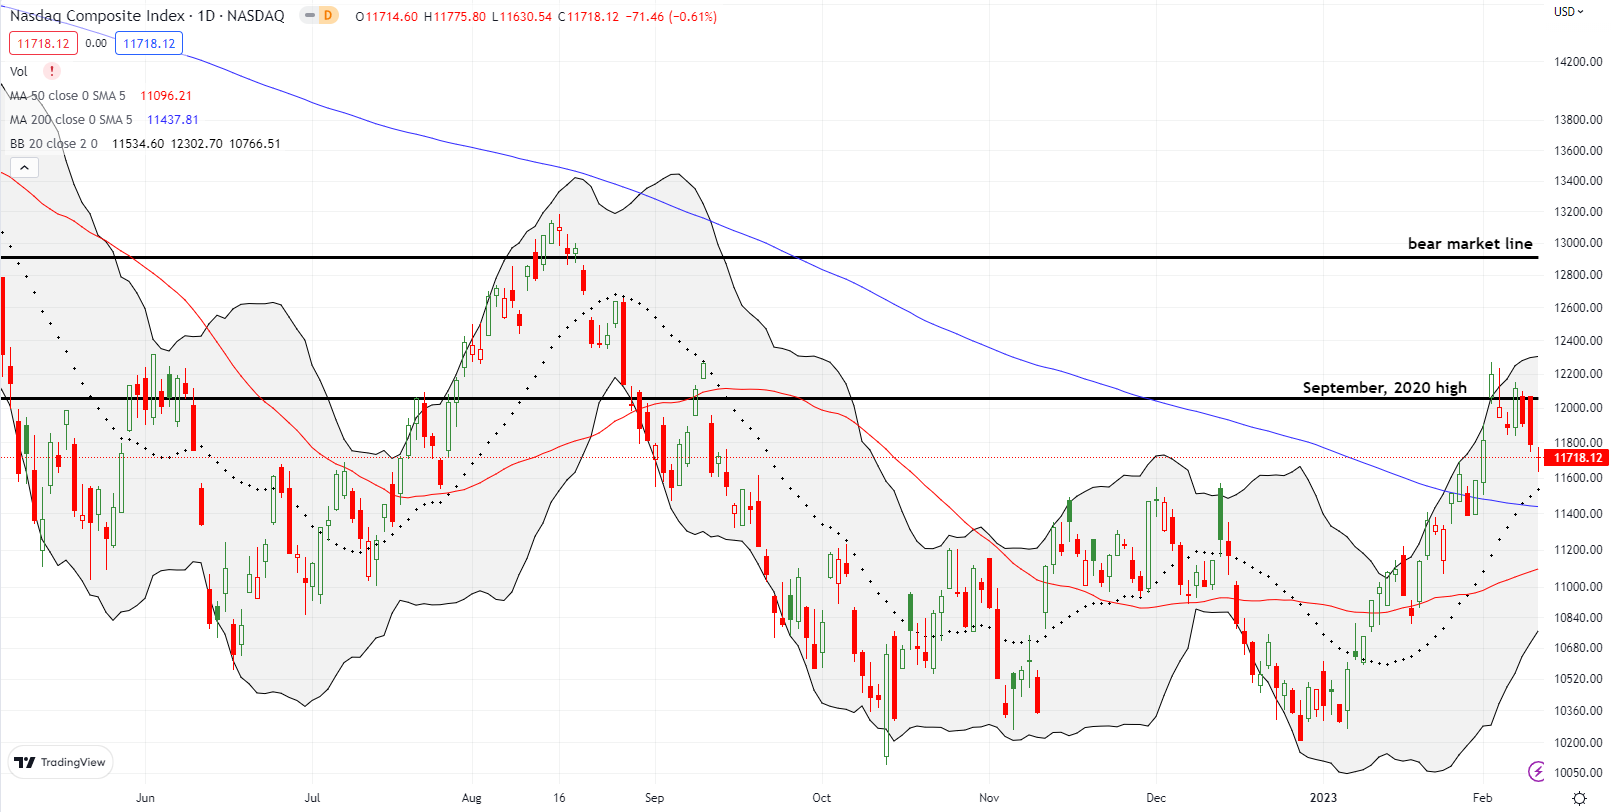
The NASDAQ suffered deteriorating technicals by confirming resistance at its September, 2020 high. The tech-laden index lost 2.4% for the week including Friday’s underperformance with a 0.6% loss. While uptrending 20DMA support awaits below, I think the NASDAQ trades heavy enough to test 200DMA support (the blue line below) in short order. Note how these tests will neatly coincide with the tops of the November and December highs.
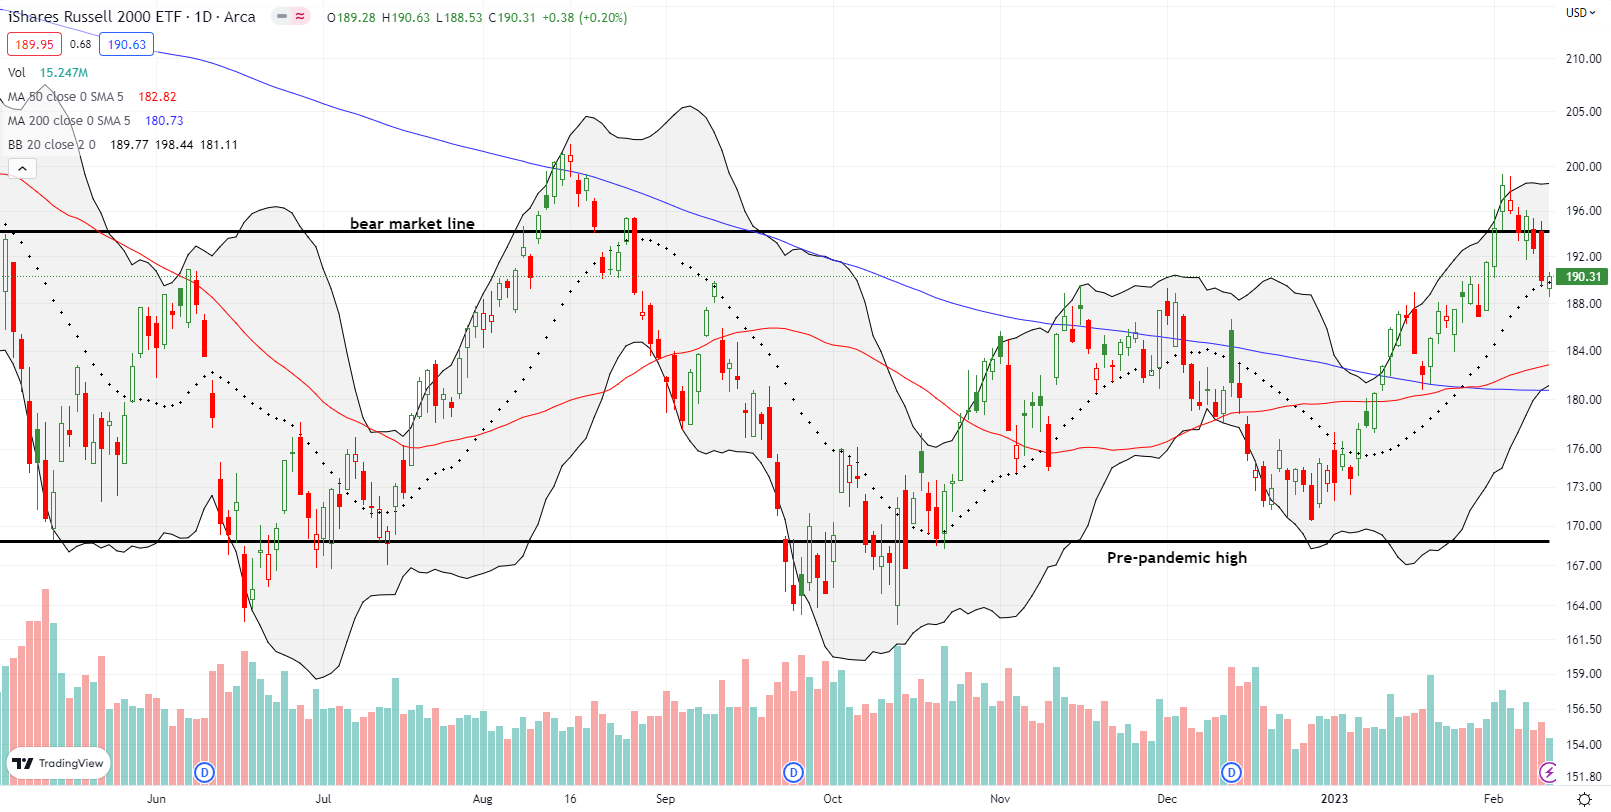
Like the NASDAQ, the iShares Russell 2000 ETF (IWM) confirmed important resistance. The ETF of small caps quickly lost its breakout above the bear market line. IWM fought to hold uptrending 20DMA support despite its return to bear market territory.
Stock Market Volatility
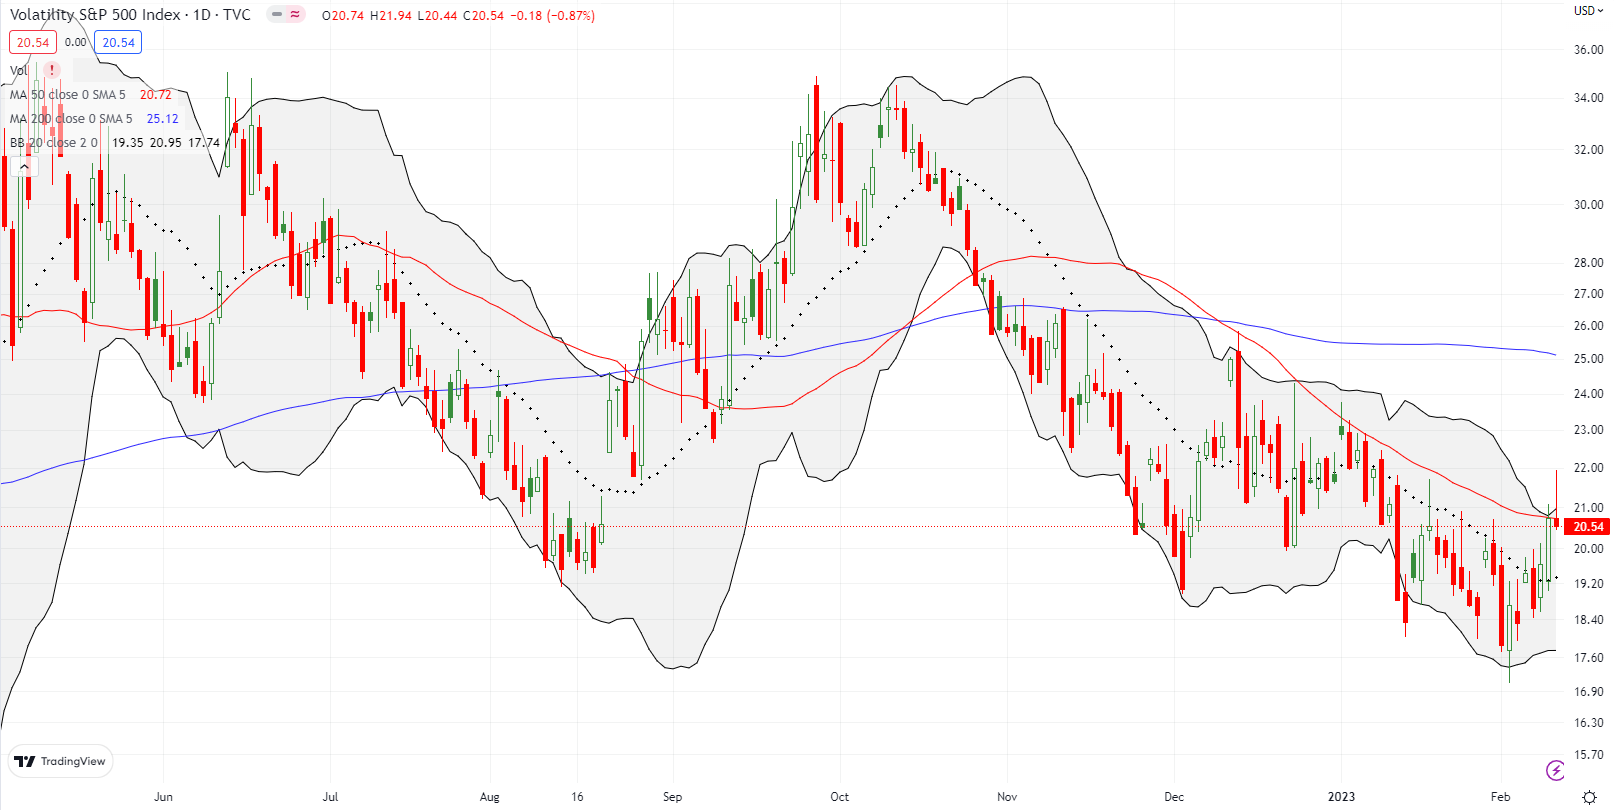
The volatility index (VIX) woke up a bit last week and adds to a sense of trouble ahead of the CPI. On Thursday, the VIX jumped 5.6% and closed above the key 20 level for the first time since January 19th. On Friday, the VIX actually broke out above its downtrend (defined by the red line). However, faders won the day and pushed the VIX to a small loss on the day. A close above the downtrend would open up the potential for a long overdue runup. For now, I am assuming the VIX has finally bottomed out.
The Short-Term Trading Call With Trouble Ahead
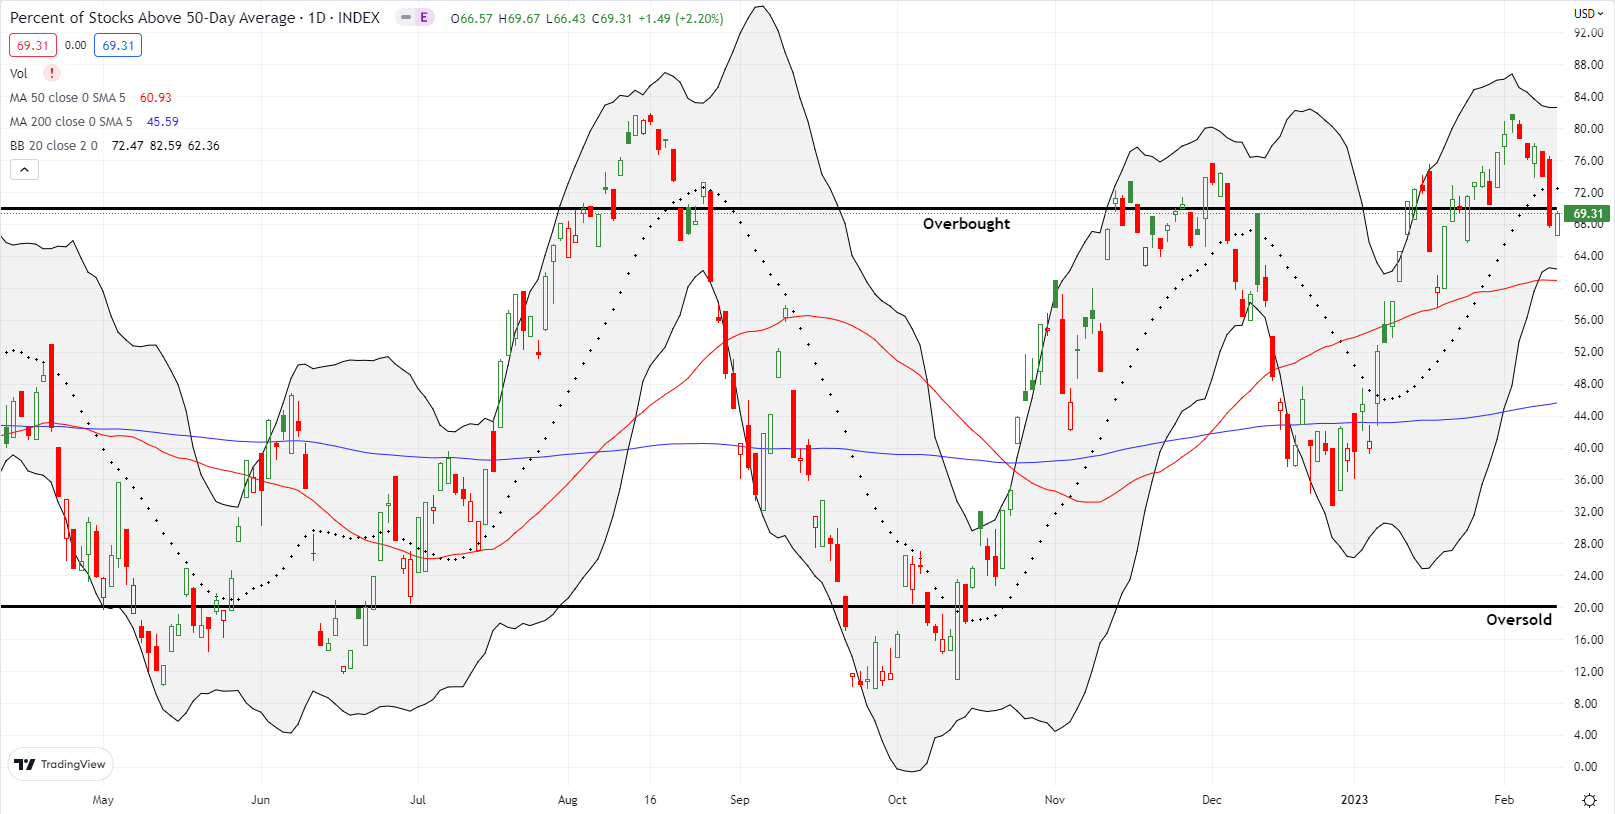
- AT50 (MMFI) = 69.3% of stocks are trading above their respective 50-day moving averages (last overbought period lasted 10 trading days)
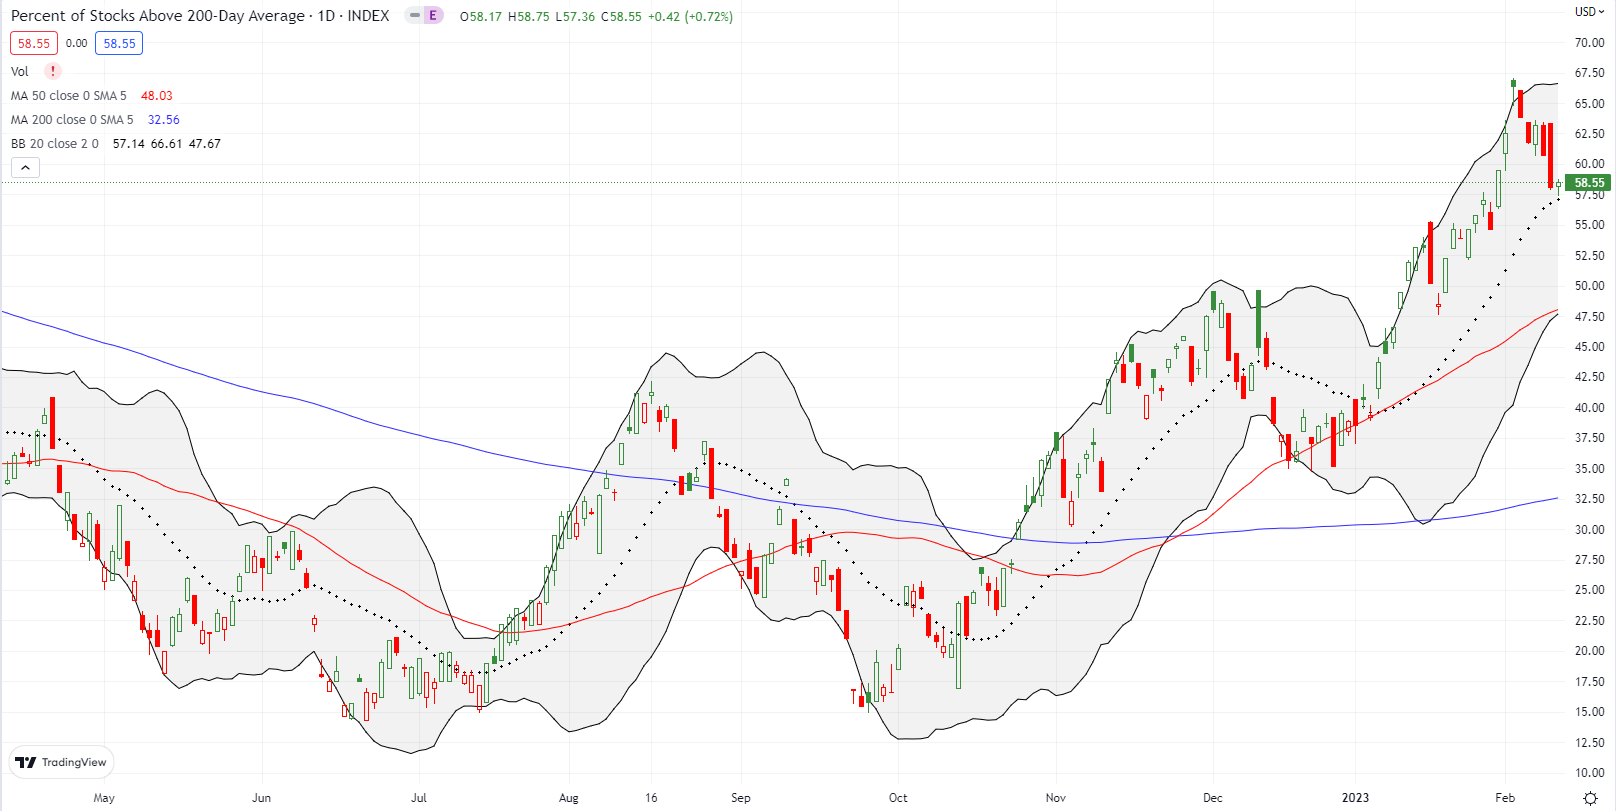
- AT200 (MMTH) = 58.6% of stocks are trading above their respective 200-day moving averages
- Short-term Trading Call: neutral
AT50 (MMFI), the percentage of stocks trading above their respective 50DMAs, ended its run in overbought territory at 10 days. This drop from overbought territory signals trouble ahead, and I expect this drop to last longer than the previous one. Still, because Friday’s tepid rebound brought my favorite technical indicator back to the overbought threshold, I decided to leave the short-term trading call at neutral. A lower close will flip me to bearish. The January CPI report could catalyze such a move if inflation comes in hotter than market expectations. Upside surprises increasing in likelihood the more the market assumes the inflation problem is already behind us.
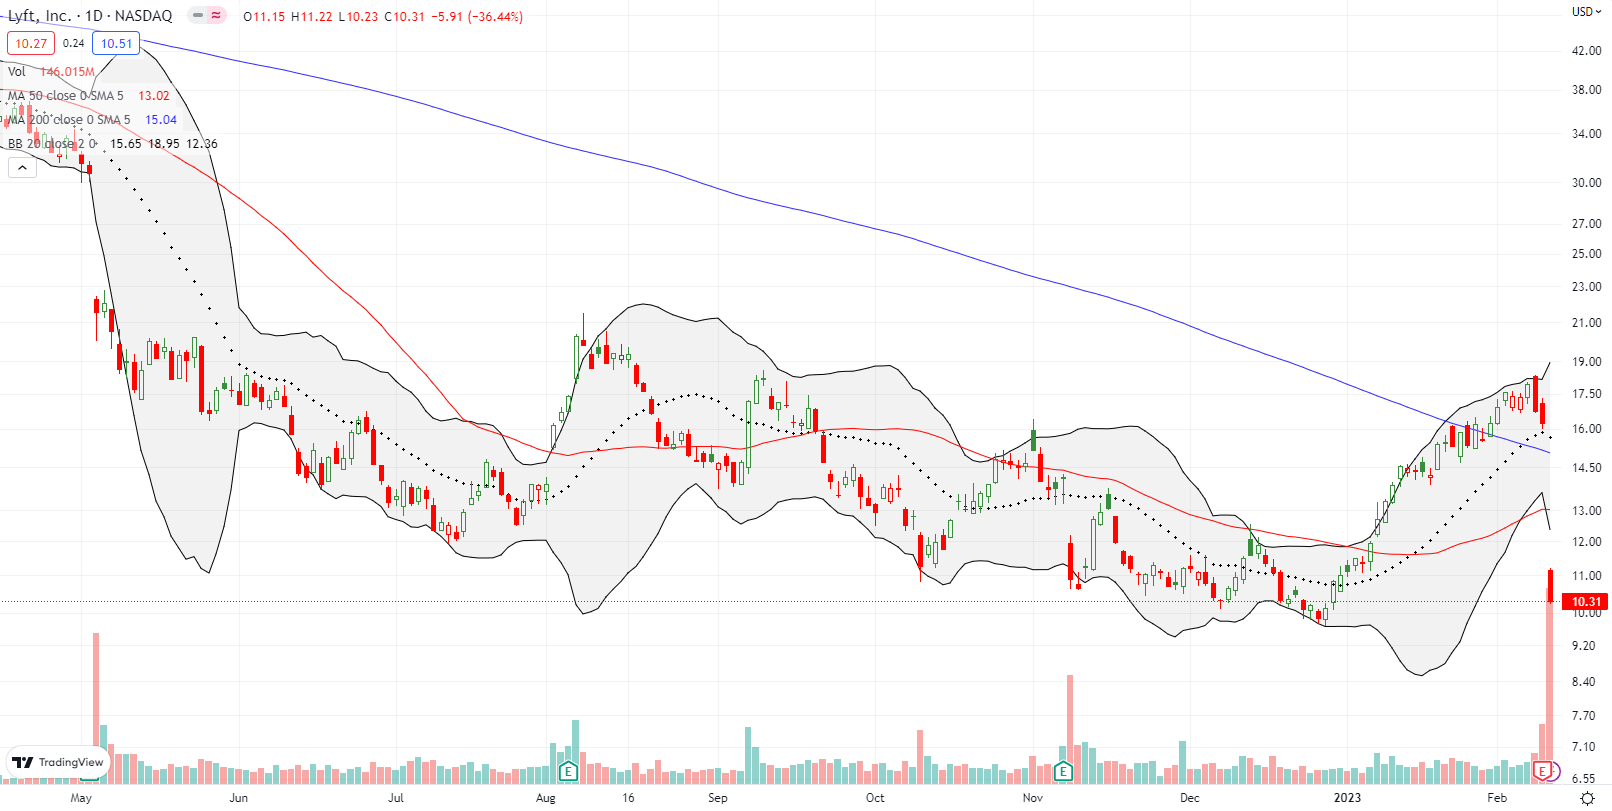
Ridesharing company Lyft, Inc (LYFT) was my disaster of the week. The stock lost an astounding 36.4% after reporting earnings. Sellers instantly wiped out LYFT’s gains for the year and almost closed the stock at its all-time low. Earlier in the week, LYFT benefited from a positive reaction to Uber’s earnings. The stock closed at a 4-month high at that point.
LYFT is an instructive case showing the risks of chasing last year’s beaten up stocks.
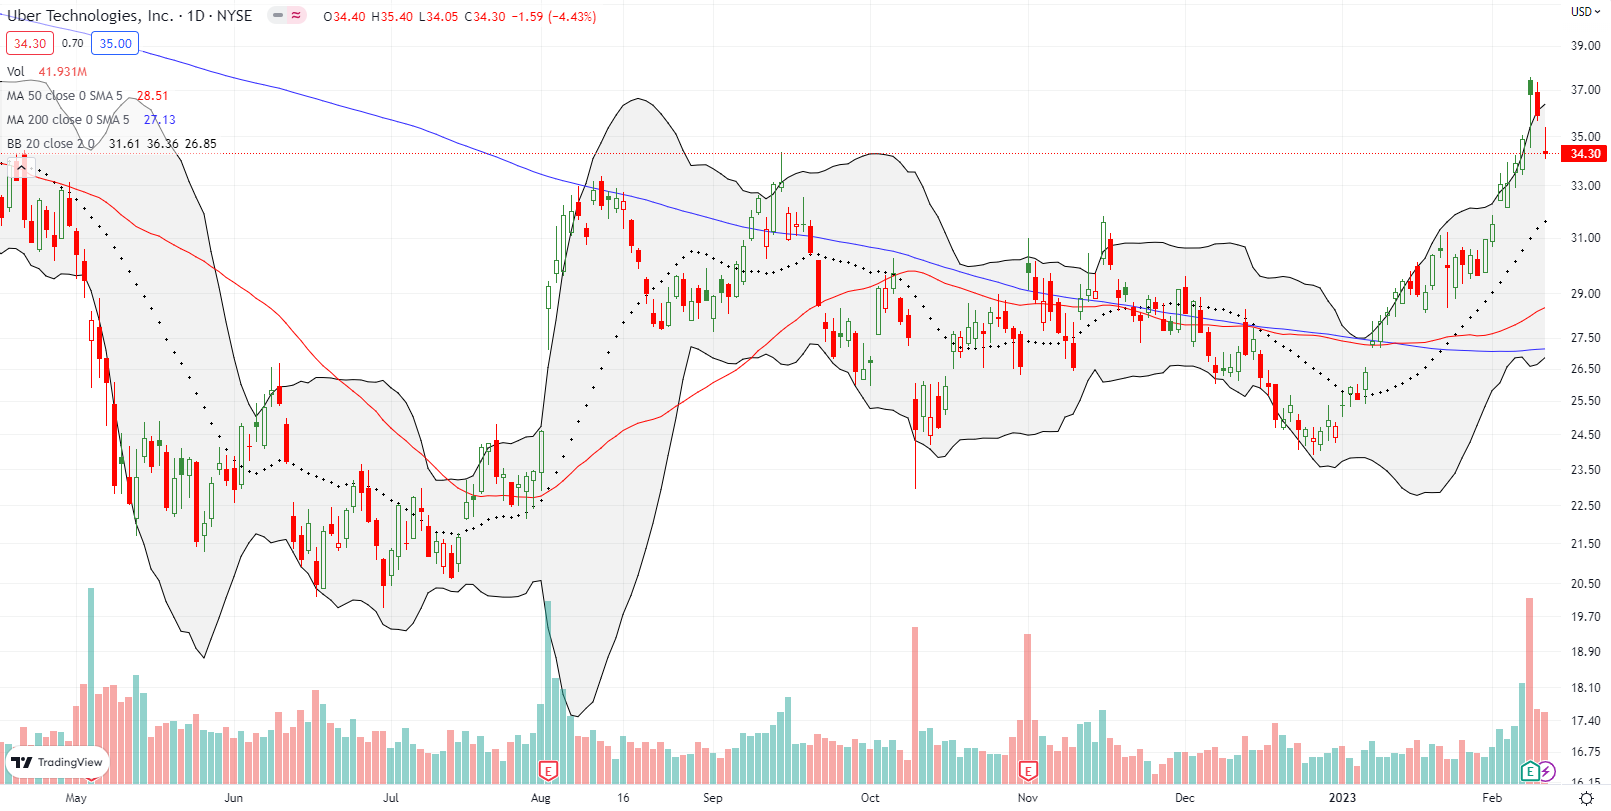
Uber Technologies, Inc (UBER) enjoyed a strong runup into its earnings report. Buyers maintained enough enthusiasm to push UBER to a 5.5% post-earnings gain. The market’s general weakness ended the run there. LYFT’s sell-off the next day was bad enough to knock UBER for a 4.4% loss. UBER lost all its post-earnings gain.
That complete reversal surprised me. If UBER had enough good news to warrant post-earnings gains, then there is little LYFT should have done to invalidate that news. My best guess is market fears of a price war. From the Seeking Alpha transcript for LYFT (emphasis mine):
“There are three factors putting pressure on both revenue and adjusted EBITDA relative to Q4. First, seasonality. As we’ve shared before, our business faces pressures in the first quarter of the year, both in terms of ride share as well as bikes and scooters related to colder weather. Second, prime time is coming down dramatically quarter-over-quarter because of increased driver supply. This reduction in prime time is good for our service levels, but will reduce our Q1 revenue and adjusted EBITDA. Third, base price. In January, we slightly reduced base pricing to remain competitive with the industry.”
I will be watching UBER for a potential return of pre-earnings momentum. Without such a rebound, UBER will be at risk for retesting 50DMA support.
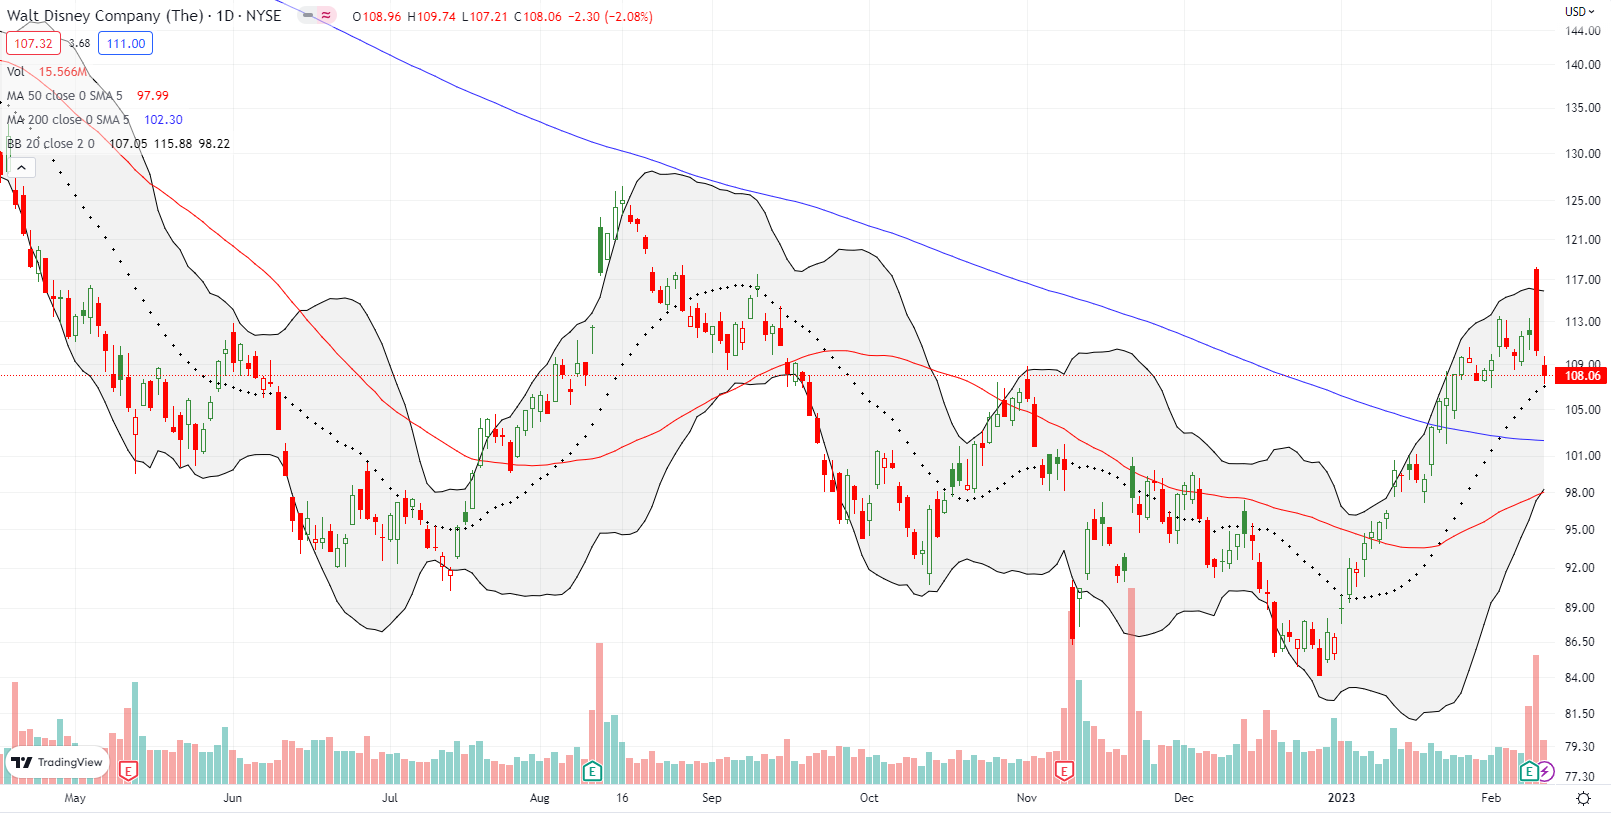
For a hot minute, the Walt Disney Company (DIS) defied the skeptics: DIS jumped to a 5.7% post-earnings gain on Thursday. However, sellers jumped in and faded DIS back to a 1.3% loss on the day. Friday’s 2.1% loss confirmed the fade and the bearish engulfing topping pattern. if 20DMA support fails, a critical 200DMA test comes next.
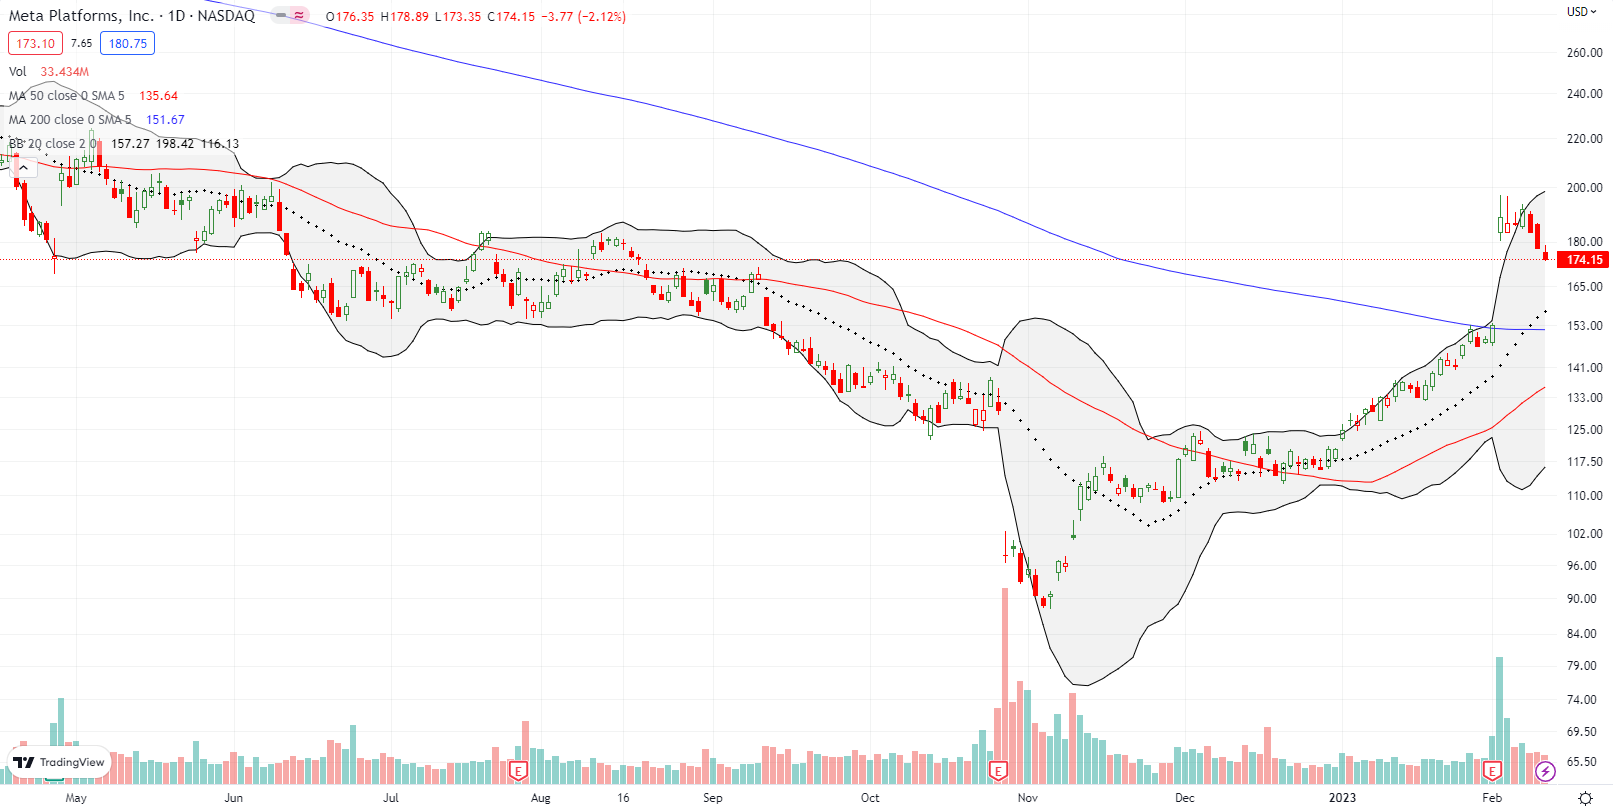
The fresh weakness in the stock market was even enough to push Meta Platforms, Inc (META) into its post-earnings gap up. Suddenly, that 23.3% post-earnings gain looks insecure with trouble ahead. Given META gained 112% from its November low, some kind of pullback is long overdue. Moreover, the main story and risk for META has little changed. The market was mainly relieved to see layoffs and a presumed reduced commitment to the metaverse. I want to fade a rebound with a stop above $200. Support at the 200DMA looks like a good downside target.
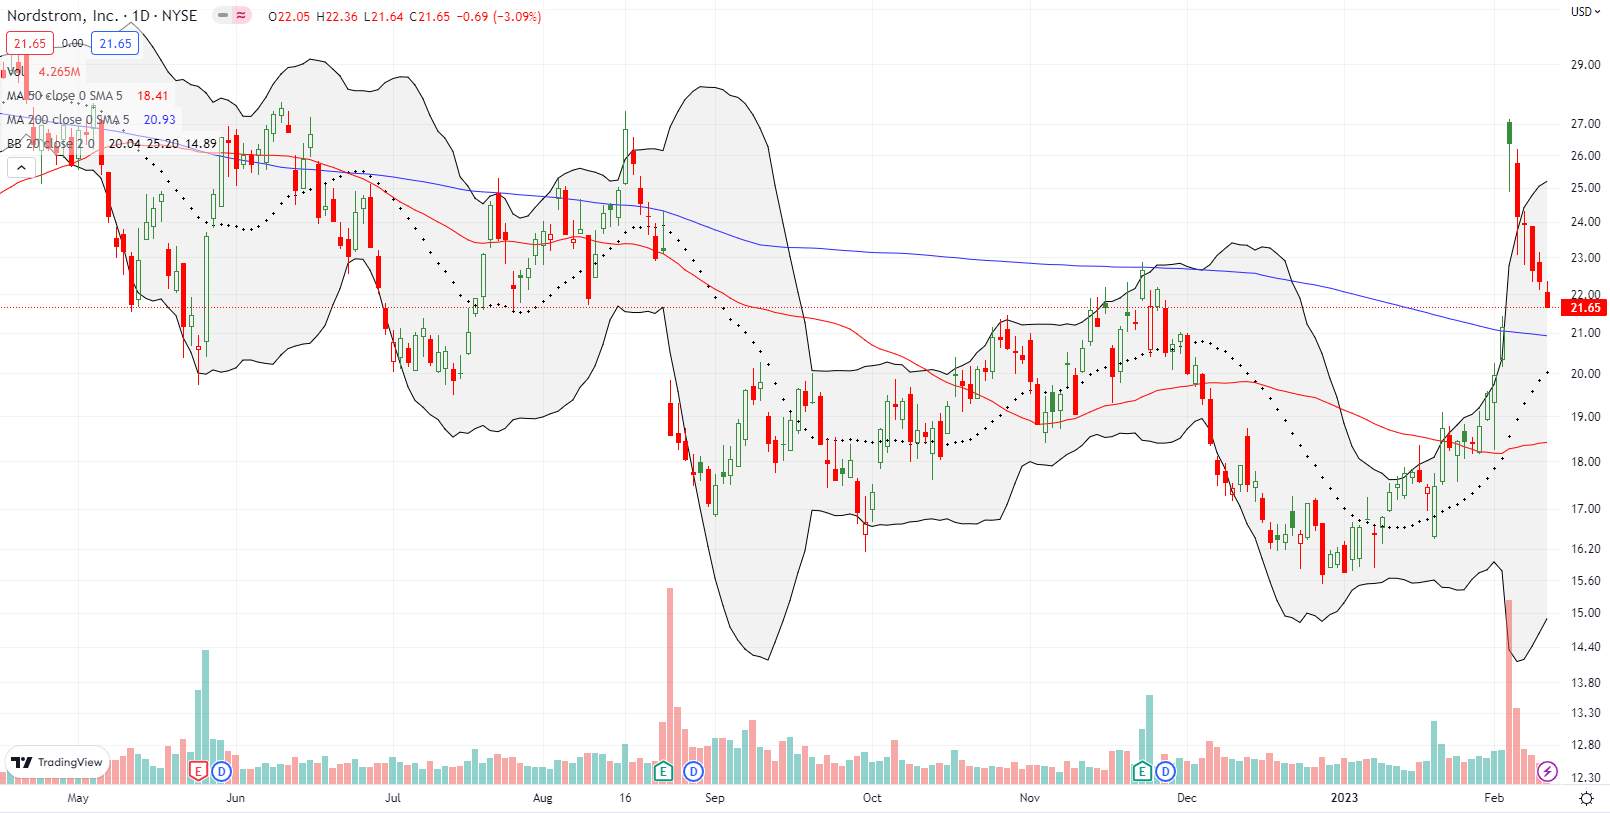
Nordstrom, Inc (JWN) experienced a sharp reversal all week. JWN soared 24.8% a week ago on news that activist investor Ryan Cohen had acquired a stake in the company. JWN repeated a familiar pattern from previous episodes of excitement over potentially going private. The reaction now looks like a short-covering panic (19% of the float is sold short). After selling off all week, JWN has lost almost all its gains. Assuming nothing changed about the news, I am looking for a successful test of 200DMA support as an area to make a speculative buy on some kind of recovery.
Be careful out there!
Footnotes
Subscribe for free to get email notifications of future posts!
“Above the 50” (AT50) uses the percentage of stocks trading above their respective 50-day moving averages (DMAs) to measure breadth in the stock market. Breadth defines the distribution of participation in a rally or sell-off. As a result, AT50 identifies extremes in market sentiment that are likely to reverse. Above the 50 is my alternative name for “MMFI” which is a symbol TradingView.com and other chart vendors use for this breadth indicator. Learn more about AT50 on my Market Breadth Resource Page. AT200, or MMTH, measures the percentage of stocks trading above their respective 200DMAs.
Active AT50 (MMFI) periods: Day #79 over 20%, Day #75 over 30%, Day #24 over 40%, Day #22 over 50%, Day #19 over 60% (overperiod), Day #2 under 70% (underperiod)
Source for charts unless otherwise noted: TradingView.com
Full disclosure: long QQQ put spread
FOLLOW Dr. Duru’s commentary on financial markets via StockTwits, Twitter, and even Instagram!
*Charting notes: Stock prices are not adjusted for dividends. Candlestick charts use hollow bodies: open candles indicate a close higher than the open, filled candles indicate an open higher than the close.

I concur VIX’s downtrend is over. The question is, how to play a rebound? The volatility options have never worked well, and the ETFs joined the options late last year in losing a reliable connection to the VIX. The theory I’ve heard from long-time VIX specialist Bill Luby is that big traders have switched to using puts directly.
I agree that buying puts is the best way to play a bottom in volatility. The volatility products seem “broken” to me.