Stock Market Commentary:
The Fed said “no” in 2022. The Fed said no to inflation, no to easy money, no to the housing market, and pointedly said no to a stock market pleading for relief from an accelerated cycle for normalizing monetary policy. Instead of the typical routine rushing to the rescue of a plunging stock market, the Fed turned a deaf ear and blind eye to the carnage and continued to hike interest rates. The market had to dig itself out of holes on hope and a prayer, sometimes around optimistic readings of the implications of an inflation report, sometimes on the technicals of oversold conditions. Good economic news and more hawkish talk and rate hikes tended to push the market back toward reality.
The Federal Reserve dominated the stock market in 2022 perhaps like no other year since the Great Financial Crisis (GFC). A new generation of market participants got to feel the pain of an aggressive and ambitious effort to normalize monetary policy. Persistent and sticky inflationary pressures forced the Fed to pivot from easy money accommodation and from a goal to continue driving unemployment ever lower. The Fed shifted to a campaign of rate hikes that choked off a lot of the speculative fever that earlier dominated financial markets since the pandemic.
The tragedy of a global pandemic ironically fueled so much excess. The Fed’s pivot dramatically reversed much of that speculative fever with related stocks reversing most, if not all, of their pandemic-era gains. Cathie Wood’s ARK Innovation funds became the poster children of the roller coaster of easy money highs and monetary tightening blues. The rolling crises in crypto symbolized how easy money in the traditional world of finance enabled centralized wealth to push crypto speculation and financial engineering. Those extremes surely rivaled the “creativity” in the GFC.
The year 2022 was the year the Fed first quietly and then emphatically said no to financial markets.
The Stock Market Indices
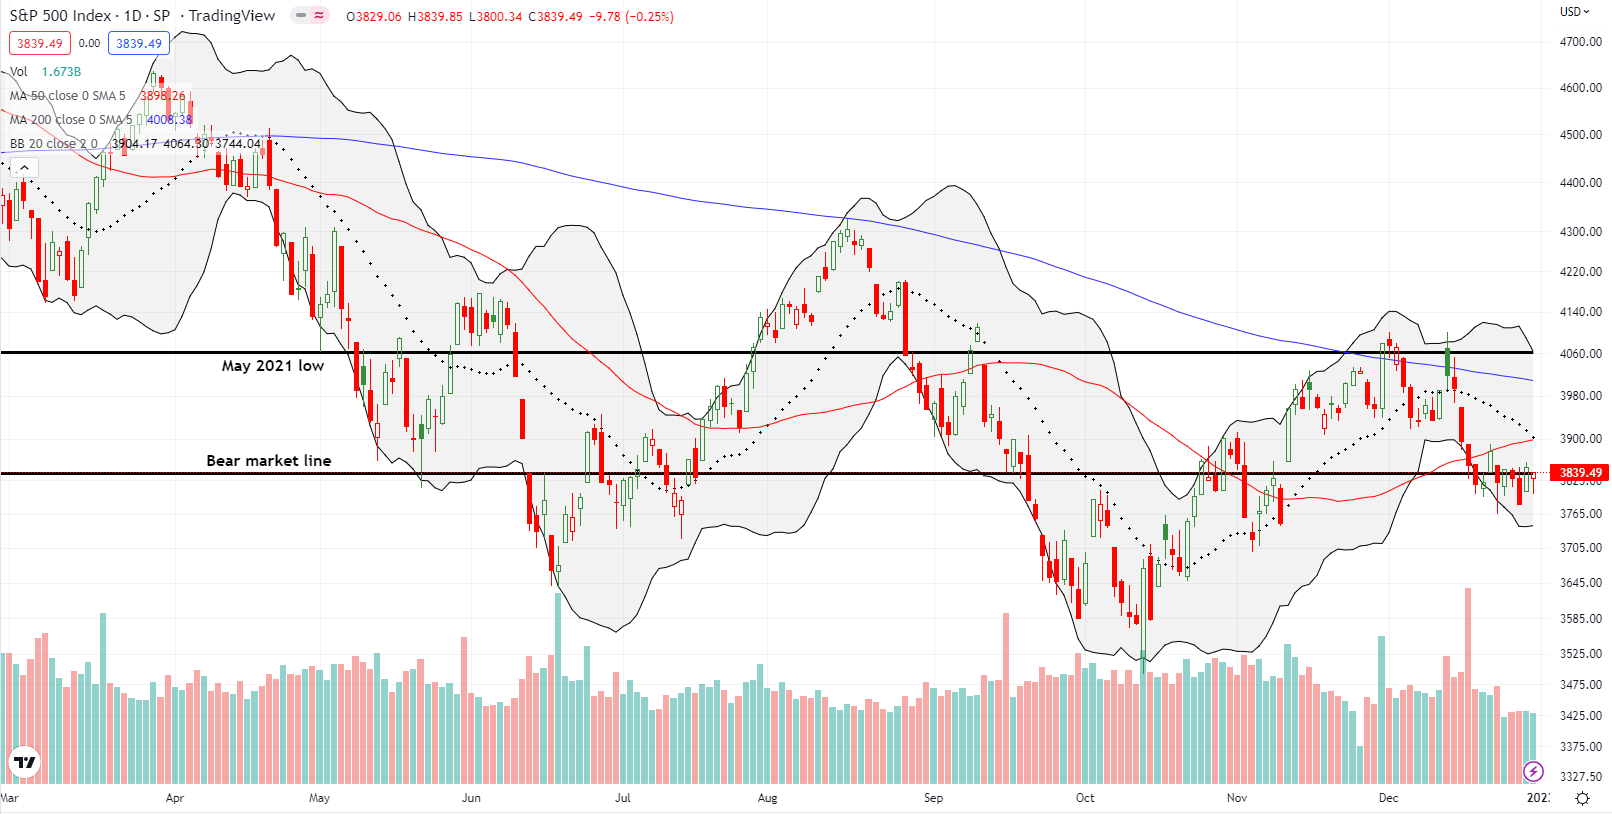
The S&P 500 (SPY) spent almost half of December desperately clinging to its bear market line. The index closed the year right on the line for a 19.4% loss for the year. Despite the carnage, the S&P 500 still delivered on the trading rule to buy into October sell-offs. The index is still up 7.3% from its October low.
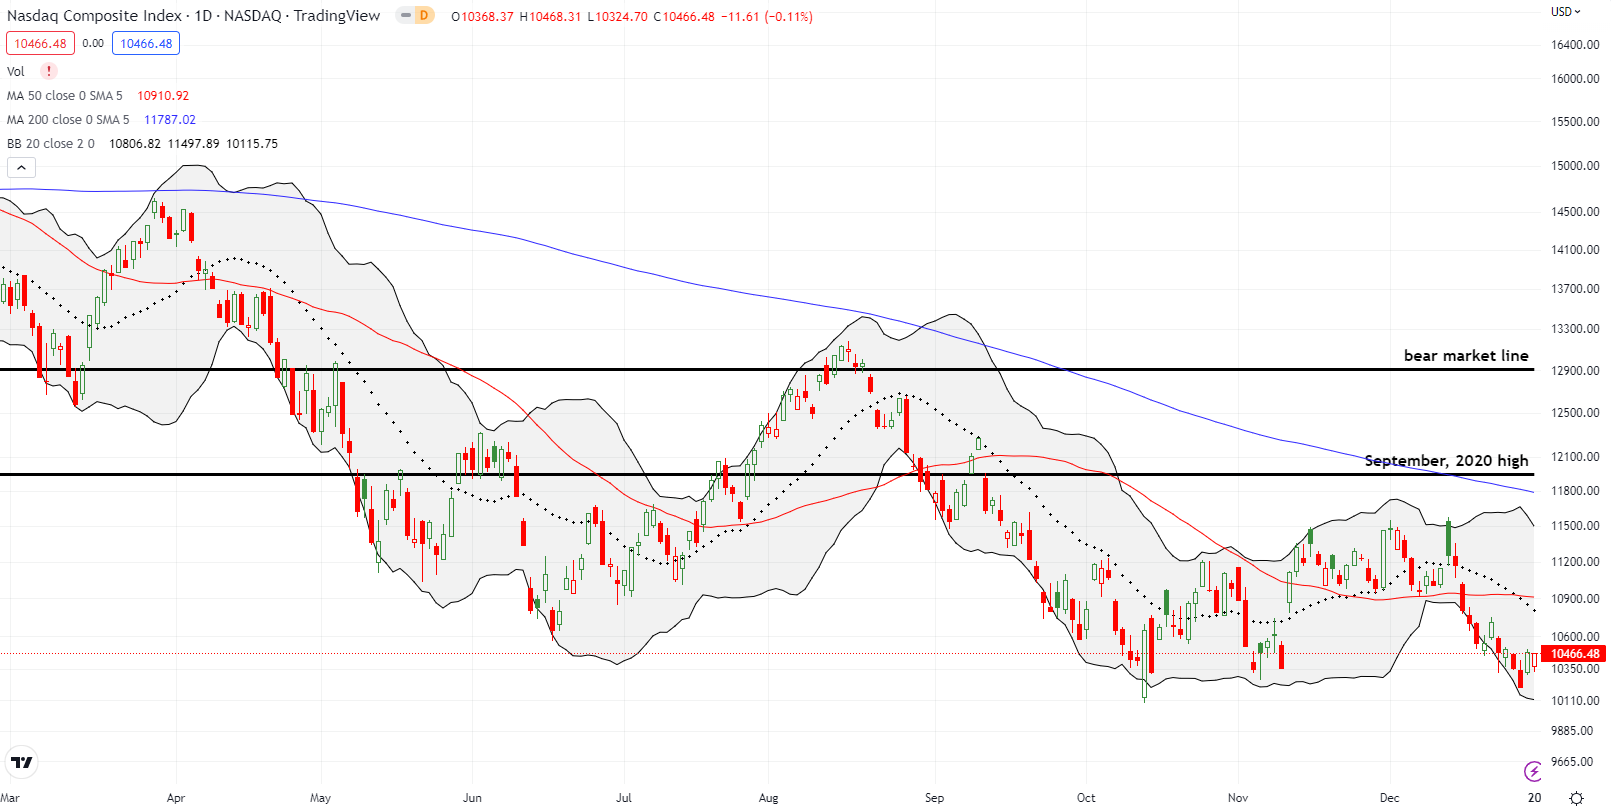
The NASDAQ (COMPQ) heard the Fed say no the loudest. Unlike the S&P 500, the tech-laden index failed to hold on to its October closing low as support. While buyers in the last two days of the year dragged the NASDAQ off a 29-month closing low, trading in the NASDAQ looks particularly precarious going into 2023. I refreshed a bearish trade on the NASDAQ with a QQQ January put spread.
The NASDAQ closed the year with a gut-wrenching 33.1% loss.
The iShares Russell 2000 ETF (IWM) avoided a new low in October and closed the year 4.5% up from its October closing low. Accordingly, IWM out-performed the NASDAQ with a 21.6% loss for the year. Overall, the ETF of small cap stocks spent much of the year bouncing between its bear market line and its pre-pandemic high.

Stock Market Volatility
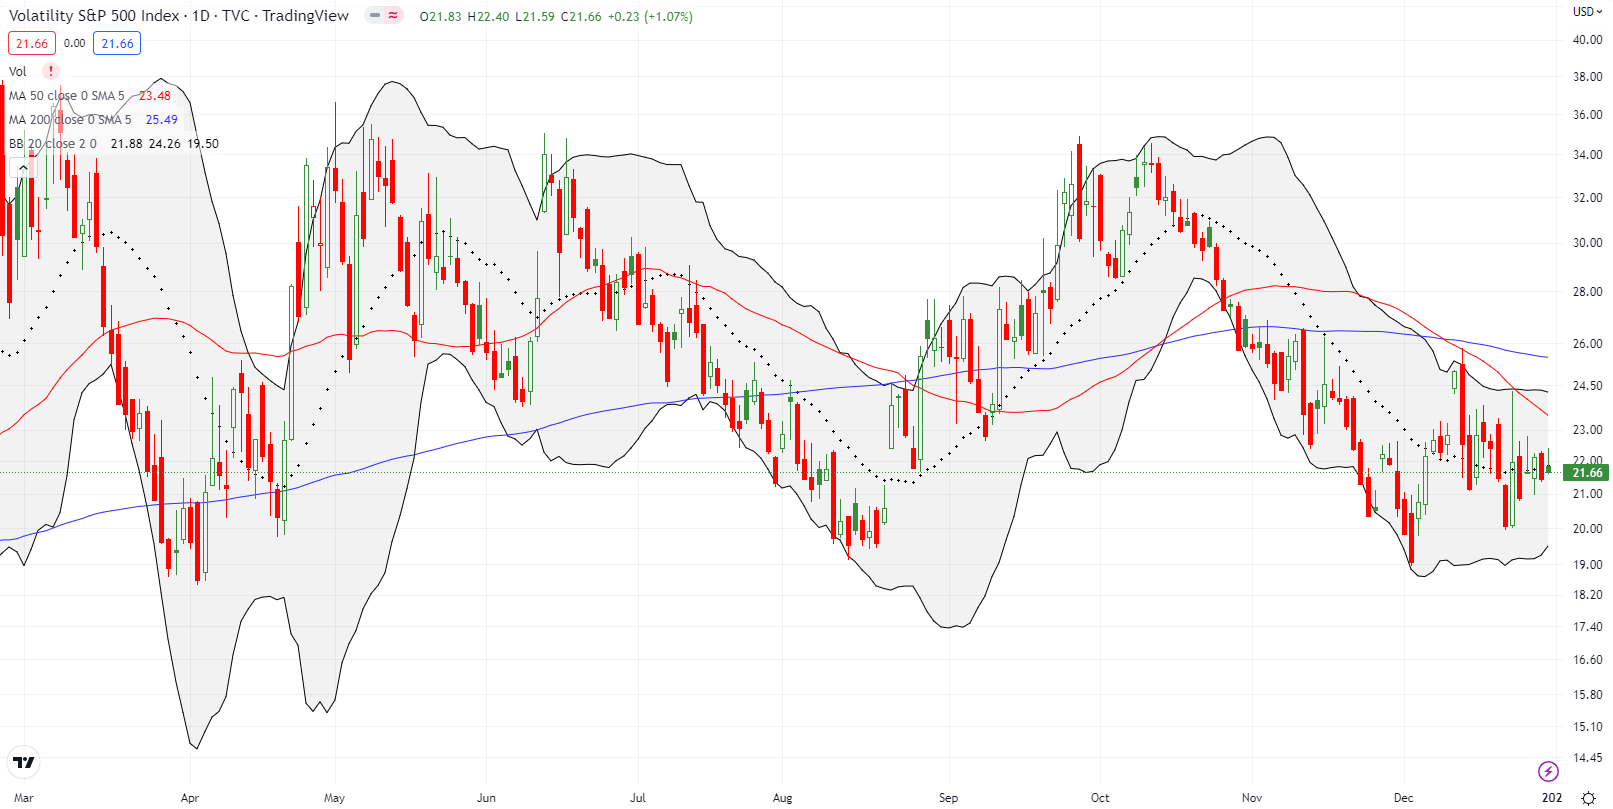
The volatility index (VIX) exactly touched the critical 20 level in the previous week. That point was the closest the market got to the Christmas spirit. Thus, at that time I thought the path of resistance pointed upward.
In my last Market Breadth post, I explained why the VIX is losing some of its explanatory power for market sentiment. Marketwatch published a Barron’s piece providing more details on what broke the VIX in 2022, including “one popular explanation is that as institutional investors dumped stocks and shifted more of their portfolios to cash this year, they were left with smaller levels of long-equity exposure in need of hedging.” I will continue monitoring the VIX for clues. However, I will accept a higher degree of uncertainty about its signals.
The Short-Term Trading Call Given the Fed Said No
- AT50 (MMFI) = 39.9% of stocks are trading above their respective 50-day moving averages
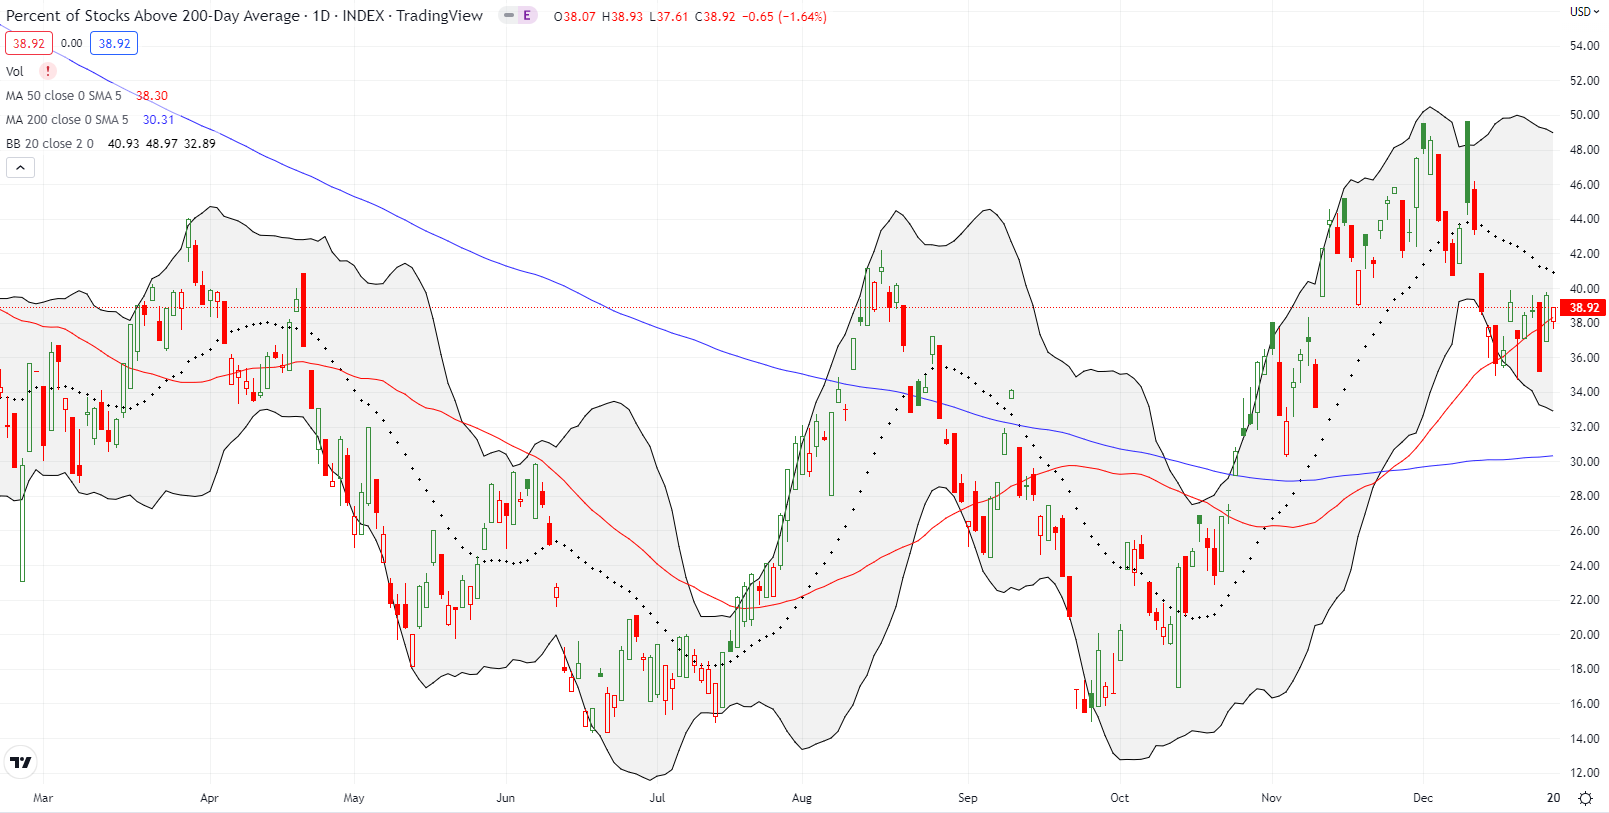
- AT200 (MMTH) = 38.9% of stocks are trading above their respective 200-day moving averages
- Short-term Trading Call: cautiously bearish
AT50 (MMFI), the percentage of stocks trading above their respective 50DMAs, ended the year at 39.9%. At one point during the week, my favorite technical indicator fell to 32.8%. The stock market clearly treated that point as “close enough to oversold” as the stock market promptly gapped up the next day: the S&P 500 gained 1.8% and the NASDAQ gained 2.6%. That trade signal did not trigger for me as the market action simply moved too fast (my one flip was a weekly Apple (AAPL) call option that I paired with the QQQ put spread). I am bracing for more swift moves in 2023. Monetary policy, inflation data, and economic growth data promise to continue working on the nerves of market participants, especially after the Fed reiterates a “no” to the stock market’s petitions and entreaties.
I go into the new year cautiously bearish. I still prefer to fade rallies rather than chase downward price action.
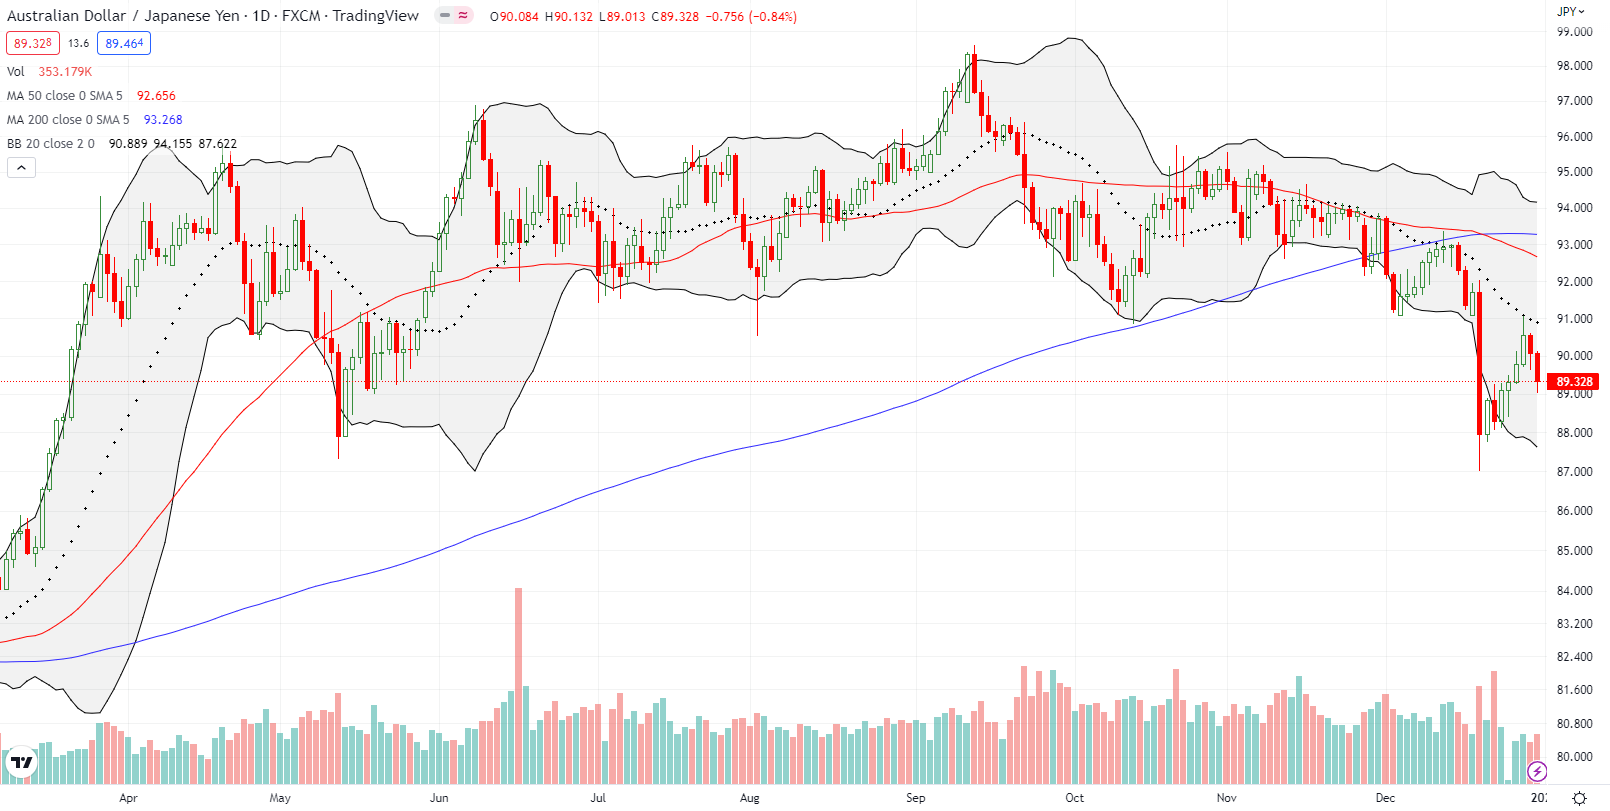
Finally, the currency markets look to feature prominently in the stock market action. The Australian dollar vs the Japanese yen (AUD/JPY) is back in sync with the peaks and valleys of the S&P 500. As a result, I am quite wary about what the next week or two will bring given AUD/JPY sank contrary to the stock market in the final two days of the year.
Be careful out there!
Footnotes
“Above the 50” (AT50) uses the percentage of stocks trading above their respective 50-day moving averages (DMAs) to measure breadth in the stock market. Breadth defines the distribution of participation in a rally or sell-off. As a result, AT50 identifies extremes in market sentiment that are likely to reverse. Above the 50 is my alternative name for “MMFI” which is a symbol TradingView.com and other chart vendors use for this breadth indicator. Learn more about AT50 on my Market Breadth Resource Page. AT200, or MMTH, measures the percentage of stocks trading above their respective 200DMAs.
Active AT50 (MMFI) periods: Day #54 over 20%, Day #50 over 30% (overperiod), Day #1 under 40% (underperiod), Day #12 under 50%, Day #18 under 60%, Day #20 under 70%
Source for charts unless otherwise noted: TradingView.com
Full disclosure: long IWM put, long QQQ put spread
FOLLOW Dr. Duru’s commentary on financial markets via StockTwits, Twitter, and even Instagram!
*Charting notes: Stock prices are not adjusted for dividends. Candlestick charts use hollow bodies: open candles indicate a close higher than the open, filled candles indicate an open higher than the close.

