Stock Market Commentary:
Yesterday’s surge in the Japanese yen (FXY) may have exhausted enough sellers to clear the path for some holiday cheer in the stock market. Suddenly, the market seemed to transition from the heavy burdens of a stubbornly hawkish Fed to the alluring hopes from a lack of (scheduled) negative catalysts for the rest of the year. Without any significant economic releases or another hawkish Fed gathering, the path of least resistance offers a reprieve from bearishness.
The Stock Market Indices
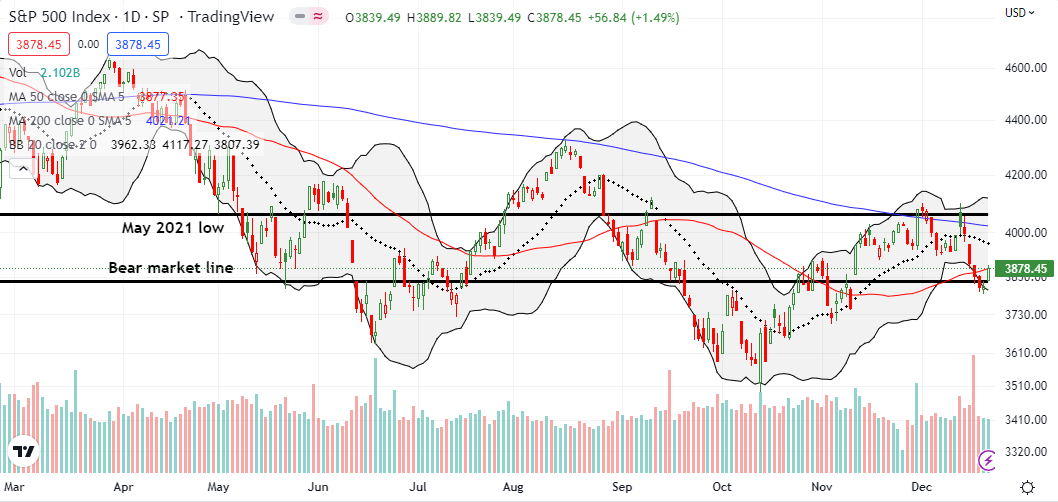
Yesterday’s drama slammed the S&P 500 (SPY) through the floor of the bear market line and confirmed the prior day’s breakdown below the 50-day moving average (DMA) (the red line below). In turn, the index looked ready to confirm a return to an official bear market. Instead, the S&P 500 rebounded in what looks like a relief rally. The 1.5% bounce closed the S&P 500 right on top of its 50DMA. Further buying from here would confirm a reprieve from bearish pressures.
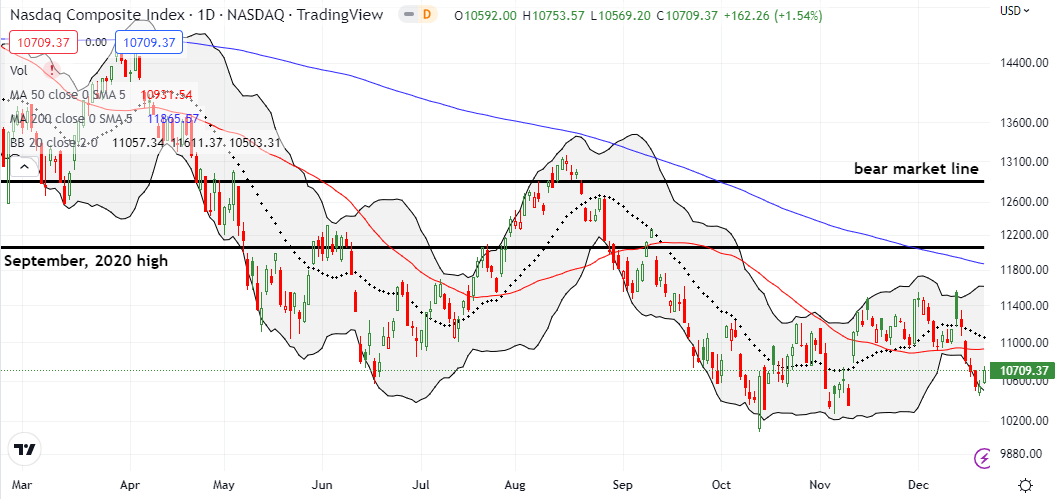
The NASDAQ (COMPQ) confirmed its 50DMA breakdown at the end of last week. Today’s 1.5% bounce barely closed the tech-laden index above last week’s close. Buyers still have work ahead to challenge overhead 50DMA resistance. The upside to this challenge is the prospect for a path of least resistance pointing higher.
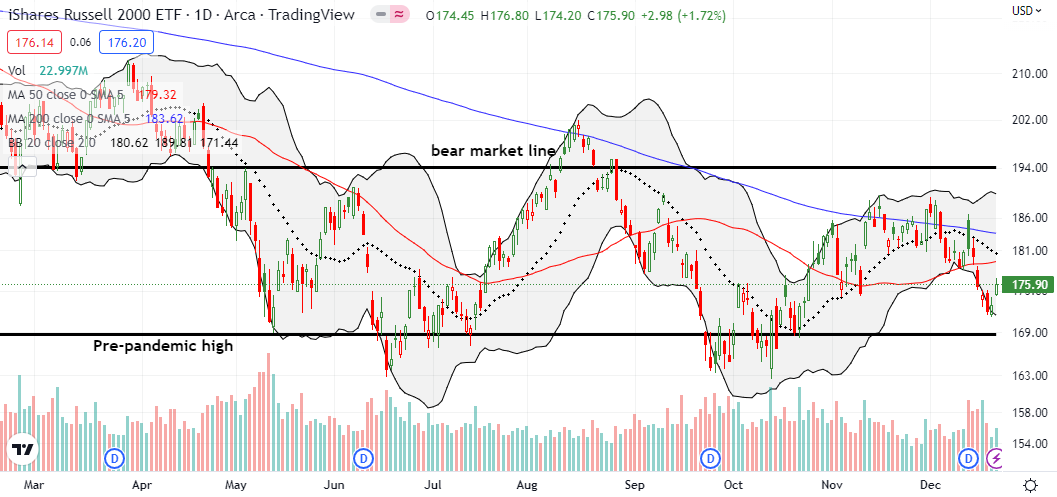
The iShares Russell 2000 ETF (IWM) also has work ahead after a 1.7% rebound. A rendezvous with the pre-pandemic high looks postponed for now as the path of least resistance points toward a test of converging resistance from the 20DMA (the dotted line below) and the 50DMA.
Stock Market Volatility
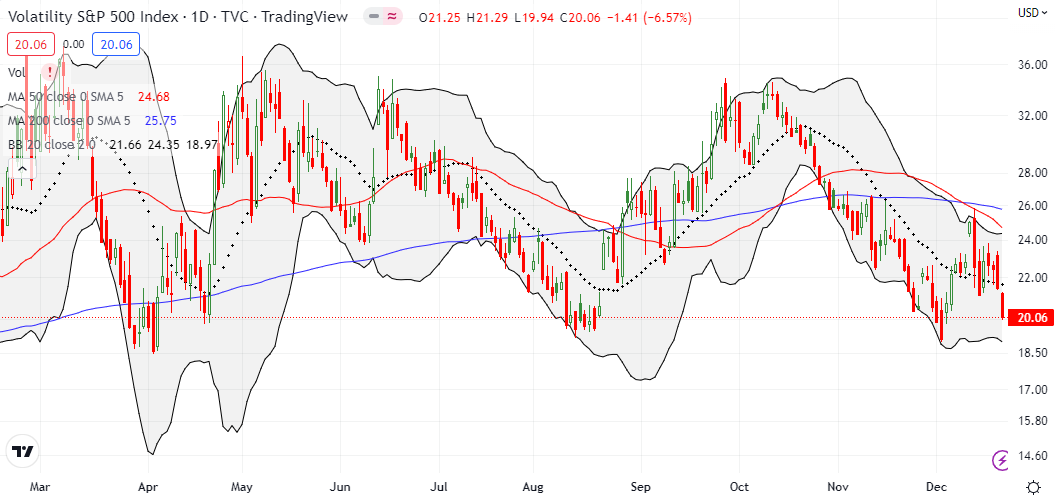
The volatility index (VIX) continues to confound me. The VIX closed flat on Monday despite selling in the market. The VIX was actually up on the day for a bit despite Tuesday’s continued selling. Today’s 6.5% plunge in the VIX seems extreme given the relative levels of the indices. Yet, this renewed weakness and breakdown in the VIX has me the most convinced that the path of least resistance points upward for stocks for now.
The VIX neatly closed at the critical 20 level, so the move from here is a critical test for the path of least resistance. Granted, the long awaited breakdown below 20 that started December’s trading followed a big fakeout for the buyers and bulls.
The Short-Term Trading Call With the Path of Least Resistance
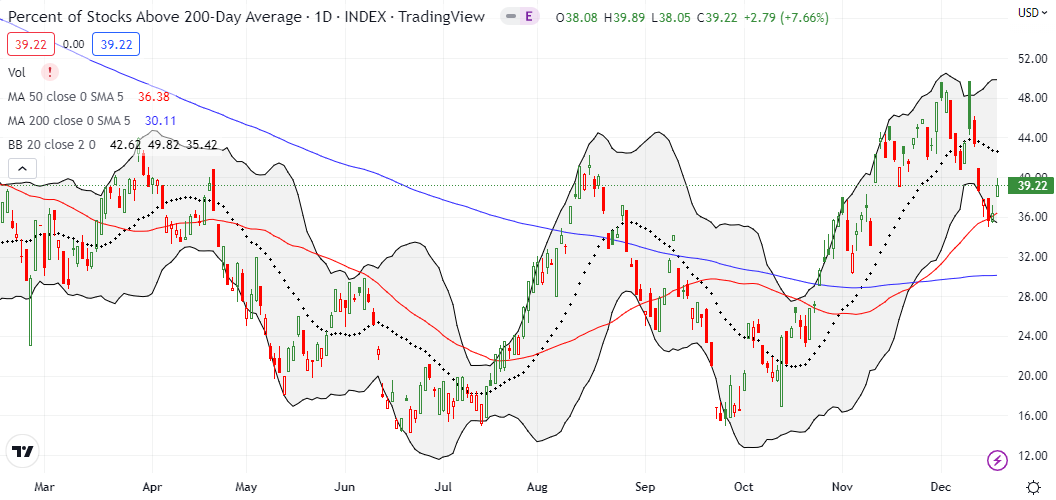
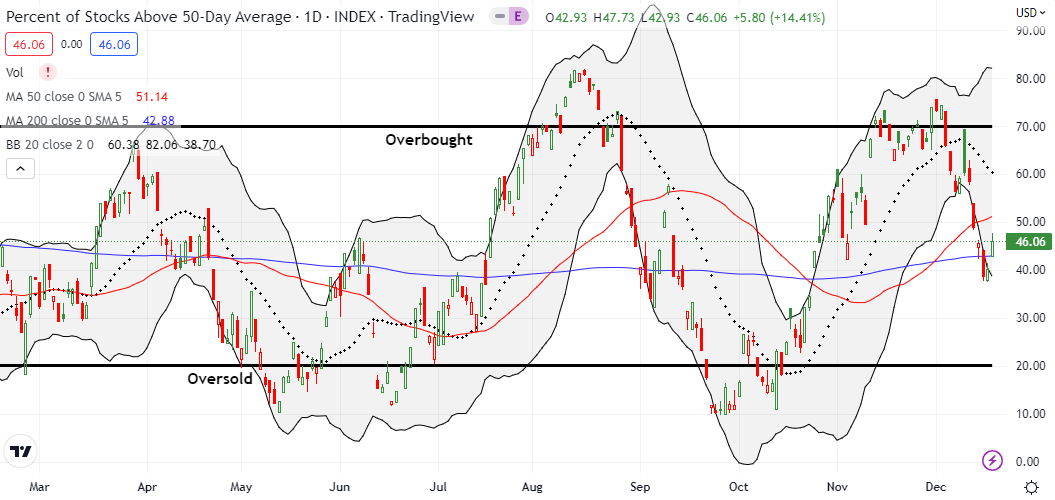
- AT50 (MMFI) = 46.1% of stocks are trading above their respective 50-day moving averages
- AT200 (MMTH) = 39.2% of stocks are trading above their respective 200-day moving averages
- Short-term Trading Call: cautiously bearish
AT50 (MMFI), the percentage of stocks trading above their respective 50DMAs, fell to a 6-week low last week. My favorite technical indicator almost reached a 2-month low to start the week. AT50 closed below the 40% level which is when I start to think about the market being “oversold enough.” I had little time to think as Tuesday’s trading delivered a kind of bullish divergence. AT50 gained 1.5 percentage points despite the post-yen selling in the stock market. AT50 looks ready for a rest from a near 3-week decline. I ALMOST switched the short-term trading call into neutral, but I decided to leave it unchanged to keep myself ready to fade this rally by early January.
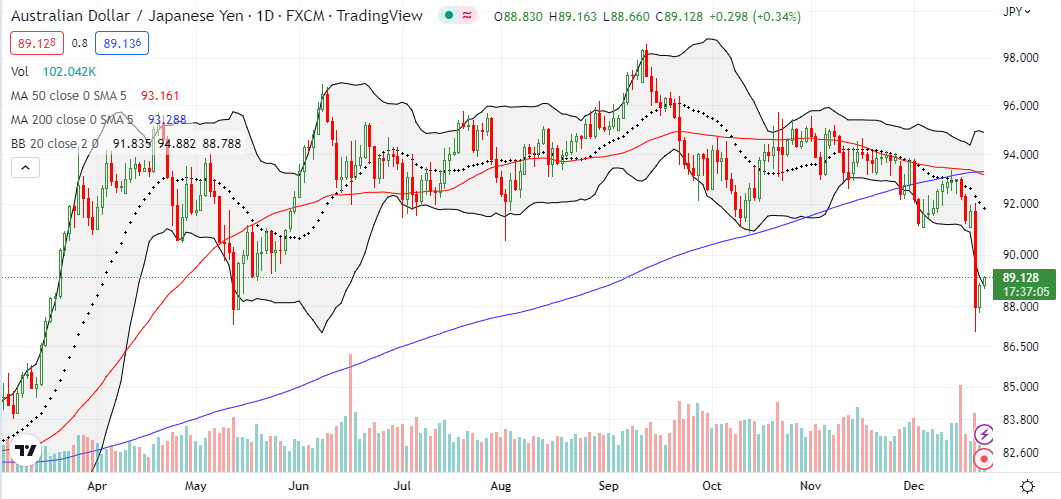
The Australian dollar versus the Japanese yen (AUD/JPY) confirmed the launch of a relief rally. AUD/JPY incredibly plunged 4.1% in the wake of the yen’s surge; the currency pair was even down 5.1% at one point. Such a move is very extreme in the currency market. Given the distance from the lower Bollinger Band (BB), I expected to see a relief bounce. I’ve already flipped AUD/JPY once playing this bounce. Earlier, I happened to profit from a substantial short position in place ahead of Tuesday’s plunge given my bearishness about AUD/JPY’s setup.
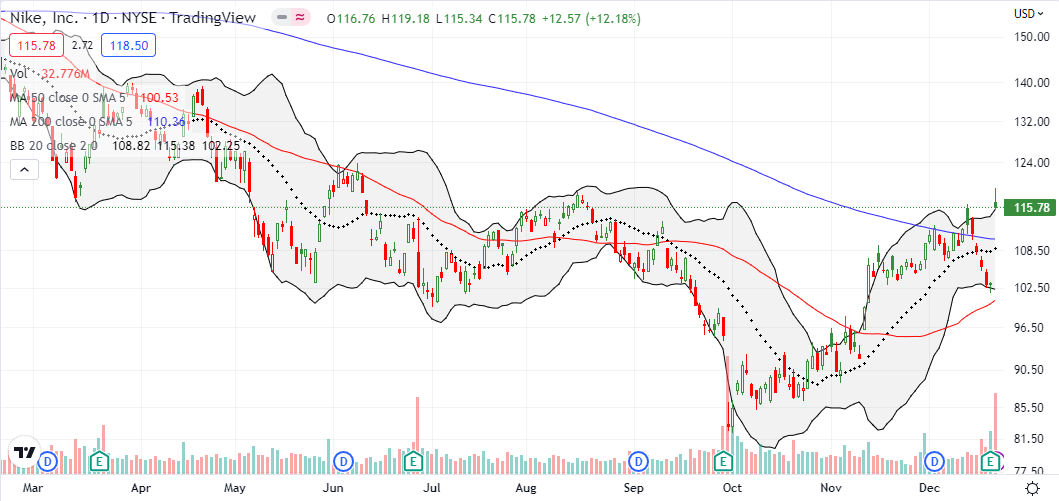
The extremely positive reaction to earnings from Nike, Inc (NKE) may have helped the mood in the stock market. NKE held a 12.2% gain and a major breakout despite a late fade from intraday highs. While NKE now looks ready to fade back to 200DMA support, this setup looks bullish for the stock.
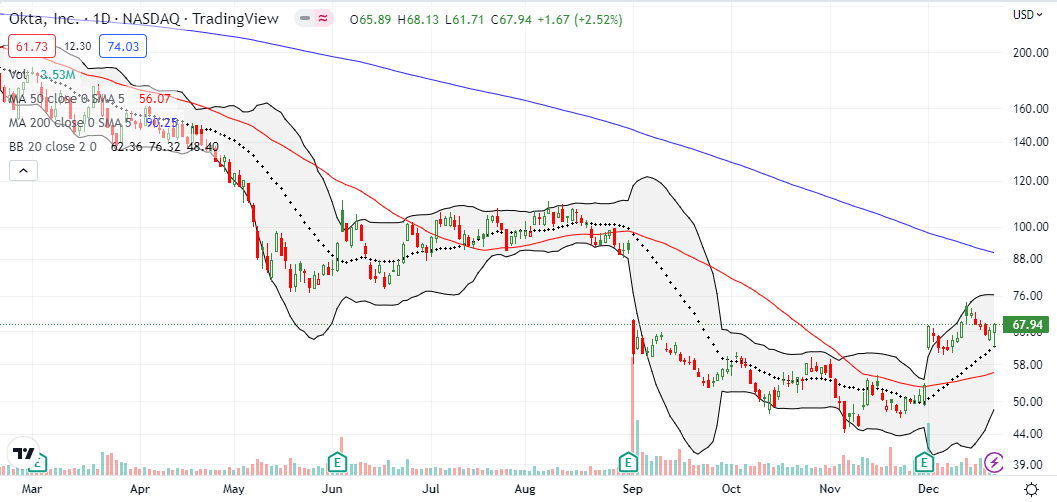
Okta, Inc. (OKTA) benefited from the market’s good mood. The stock initially dropped down to its 20DMA after news of theft of source code. The rebound from there was picture-perfect and set OKTA up for more gains along the path of least resistance. Of course, the downtrending 200DMA looms overhead as resistance.
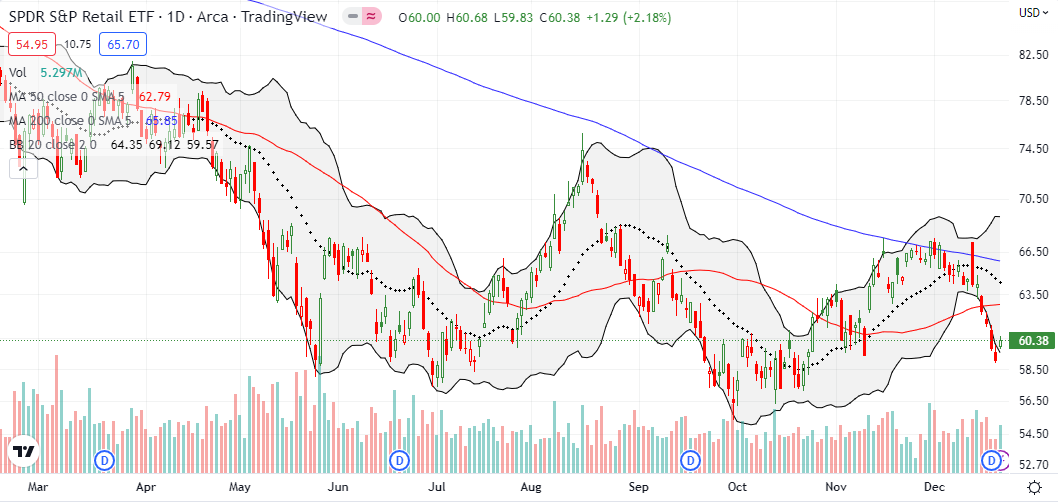
I will be watching the SPDR S&P Retail ETF (XRT) closely as a walk up the path of least resistance unfolds. While NKE is not a component of XRT, NKE’s surge likely exerted a strong psychological pull on XRT. XRT is also a perfect stock for a late attempt to revive the prospects for a Santa rally. I will put a pause on my bearishness long enough to buy into XRT on follow-through buying. My profit target would be overhead 50DMA resistance. Note how the day’s 2.2% gain created a kind of abandoned baby bottom.
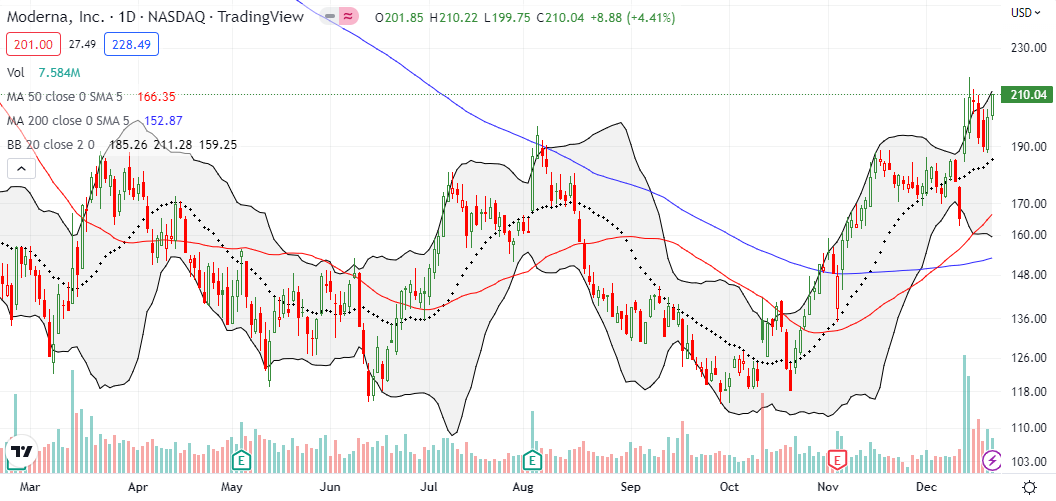
I made a follow-up case for Moderna, Inc (MRNA) back in July. Last week, this mRNA vaccine platform company delivered with news of progress on a cancer vaccine. I decided to take profits there with MRNA trading to an 11-month high. Profits in this market are hard to come by, and I wanted to lock these in.
MRNA is still a buy on the dips. The company represents part of an important future for vaccines. At 4x sales and 4x trailing earnings, MRNA is actually reasonably priced in this bearish market that punishes rich valuations.
Be careful out there!
Footnotes
“Above the 50” (AT50) uses the percentage of stocks trading above their respective 50-day moving averages (DMAs) to measure breadth in the stock market. Breadth defines the distribution of participation in a rally or sell-off. As a result, AT50 identifies extremes in market sentiment that are likely to reverse. Above the 50 is my alternative name for “MMFI” which is a symbol TradingView.com and other chart vendors use for this breadth indicator. Learn more about AT50 on my Market Breadth Resource Page. AT200, or MMTH, measures the percentage of stocks trading above their respective 200DMAs.
Active AT50 (MMFI) periods: Day #47 over 20%, Day #43 over 30%, Day #2 over 40% (overperiod), Day #5 under 50% (underperiod), Day #11 under 60%, Day #13 under 70%
Source for charts unless otherwise noted: TradingView.com
Full disclosure: long IWM calendar put spread, long SPY calendar call spread, long QQQ put spread, long BBY
FOLLOW Dr. Duru’s commentary on financial markets via StockTwits, Twitter, and even Instagram!
*Charting notes: Stock prices are not adjusted for dividends. Candlestick charts use hollow bodies: open candles indicate a close higher than the open, filled candles indicate an open higher than the close.


OKTA: interesting test of the open-source vs. proprietary-source dichotomy.
OKTA stated that stealing their source code doesn’t mean anyone thereby gained access to anything. Well… that’s not true if in reading the source code the thieves find a security bug.
Which is why (IMO) open source is the way to go with security code: friendly eyes have an opportunity to find your bugs before unfriendly eyes do.
Yep. Makes sense!
The “path of least resistance” lasted a LOT shorter than I could have expected! Just one day. S&P 500 resistance held neatly as GDP was revised upward. I do not think of GDP revisions as significant economic events. But clearly we’re in a zone where every bit of good economic news is considered awful by Wall Street!
IMO, because stock still over valued…..so the only way up is looser monetary policy….