

Stock Market Commentary:
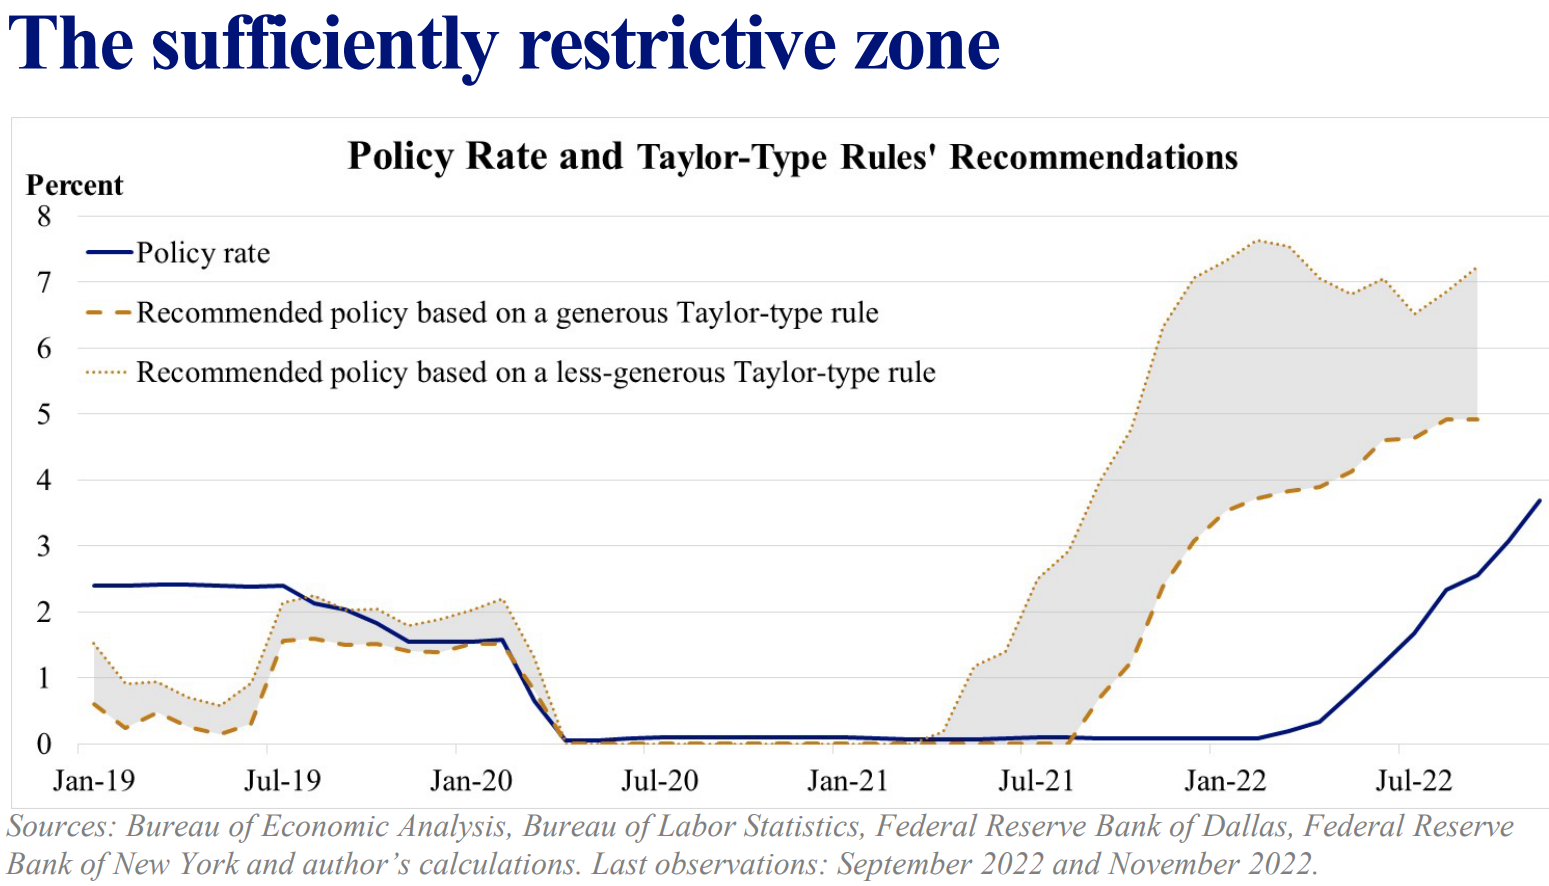
Federal Reserve Bank of St. Louis President James Bullard did his best to dissuade financial markets from optimistic interpretations of recent softish inflation reports. The press release summarizing recent remarks was enough to send chills in the Fed pause/plateau/pivot theorists: “the policy rate is not yet in a zone that may be considered sufficiently restrictive.” Bullard fed honey to the bears, and the trigger fingers promptly gapped down the stock market at the open. While buyers stepped in to defend the lows and important support on the NASDAQ and IWM, the day still closed with a confirmed bearish signal from market breadth. With seasonal tailwinds continuing to work in the market’s favor, short-term trading just got even trickier.
The Stock Market Indices
The S&P 500 (SPY) once again delayed its schedule to challenge overhead resistance at its 200-day moving average (DMA) (the bluish line below). A small jump two days ago made the index look ready to challenge the now converging resistance from the 200DMA and the important May, 2021 low. Today’s gap down suggested instead that the index may have gotten “close enough” to a failure at resistance. The potential good news in the short-term is that sellers and bears may not be able to press the issue much further than the uptrending support at the 20DMA or even 50DMA support.
")
The NASDAQ (COMPQ) tested key support at the morning’s gap down open. Buyers rushed in to defend 50DMA support (the red line). A converging 20DMA (the dotted line) makes this line look more solid for now. A close over the week’s high could set the tech-laden index hurtling toward converging resistance at the 200DMA and September, 2020 high.
")
The iShares Russell 2000 ETF (IWM) created its own unique mix of bearish and bullish signals. IWM has been the most consistent performer since the September lows with 20DMA support holding since the October breakout. That support held firm one more time on today’s gap down. Yet, the closing loss left a confirmed 200DMA breakdown in its wake, a bearish development. So now the ETF of small caps is caught in a tight push and pull. I assume the resolution will have impressive follow-through.
")
Stock Market Volatility
The volatility index (VIX) has essentially churned since hitting last week’s low. This week’s trading includes two fades suggesting a bullish bias lingers. The VIX still needs to make new lows to keep the bullish tidings alive.
")
The Short-Term Trading Call With the Bullard Bearish Trading Signal
- AT50 (MMFI) = 65.2% of stocks are trading above their respective 50-day moving averages
- AT200 (MMTH) = 41.0% of stocks are trading above their respective 200-day moving averages
- Short-term Trading Call: cautiously bearish
AT50 (MMFI), the percentage of stocks trading above their respective 50DMAs, put me in a tricky trading spot. My favorite technical indicator started the week falling right out of overbought conditions. That move forced me to a neutral short-term trading call. Tuesday’s rebound gave me hope I would not have to further downgrade the short-term trading call. My hopes were dashed as the stock market chopped its way right out of overbought conditions a second time. Today’s trading confirmed that breakdown with a second close below the overbought threshold at 70%. Per my AT50 trading rules, I switched to a (cautiously) bearish short-term outlook.
On the other hand, the market was impressive at the intraday lows. Without AT50, I might be tempted to refresh a bullish outlook. So I am prepared to flip right back to neutral if buyers gain enough strength to put AT50 right back into overbought territory. I will not go back to bullish until the next oversold trading conditions. In other words, I am braced for churn ahead.
Per my caution, I earlier took profits on my remaining options expiring this week and other swing trades. My only new short-term bullish position was in SLV call options. I added a fresh hedge with SMH and TLT put options. I will look for fades into the next rally. In other words, this is a time for small bets and low expectations.
")
")
Be careful out there!
Footnotes
“Above the 50” (AT50) uses the percentage of stocks trading above their respective 50-day moving averages (DMAs) to measure breadth in the stock market. Breadth defines the distribution of participation in a rally or sell-off. As a result, AT50 identifies extremes in market sentiment that are likely to reverse. Above the 50 is my alternative name for “MMFI” which is a symbol TradingView.com and other chart vendors use for this breadth indicator. Learn more about AT50 on my Market Breadth Resource Page. AT200, or MMTH, measures the percentage of stocks trading above their respective 200DMAs.
Active AT50 (MMFI) periods: Day #24 over 20%, Day #20 over 30%, Day #18 over 40%, Day #6 over 50%, Day #6 over 60% (overperiod), Day #2 under 70% (underperiod)
Source for charts unless otherwise noted: TradingView.com
Full disclosure: long IWM calendar call spread, short IWM put spread, long SPY calendar call spread and vertical spread, long QQQ call spread
FOLLOW Dr. Duru’s commentary on financial markets via StockTwits, Twitter, and even Instagram!
*Charting notes: Stock prices are not adjusted for dividends. Candlestick charts use hollow bodies: open candles indicate a close higher than the open, filled candles indicate an open higher than the close.