
Stock Market Commentary
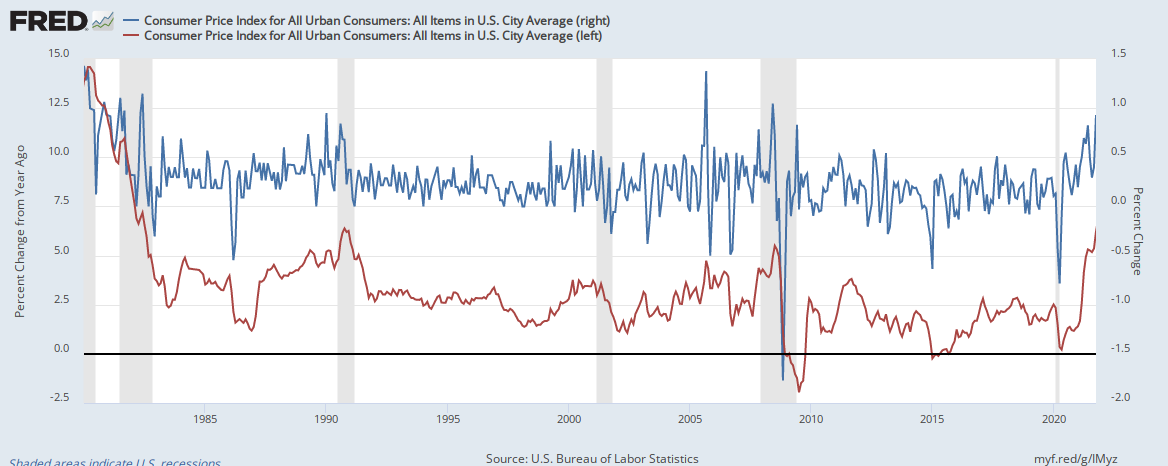
And just like that, the bullish expansion of market breadth hit a wall…a wall of inflation. The October Consumer Price Index (CPI) for all urban consumers apparently surprised financial markets by soaring 0.9% from September and 6.2% over October, 2020. The chart below shows that both surges are at the high end of ranges in place since 1980. Moreover, these increases follow months of inflation creep. Suddenly, inflation looks very real and more than transitory. (The left vertical axis applies to the year-over-year change in the brownish line. The right vertical axis applies to the month-over-month change in the blue line).
This report was serious enough to garner a quick response from President Biden (was the script prepared in advance?): “…today’s report shows an increase over last month. Inflation hurts Americans pocketbooks, and reversing this trend is a top priority for me.” The emphasis is mine. Unlike the Fed that keeps dismissing rising inflation as transitory, President Biden acknowledged that a trend is underway. A trend means rising now and expected to rise in the future – the very definition of inflation when applied to prices. Biden went on to detail his steps for fighting rising prices:
- Address price gouging and market manipulation in markets for natural gas.
- Pass and implement his Infrastructure Bill as a way to reduce bottlenecks in the supply chain.
- Pass and implement his “Build Back Better” plan to help reduce the costs of childcare, elder care, and health care in general.
Unfortunately, the legislative path will not solve inflation issues anytime soon. Perhaps this reality explains the shout-out in the press release that caught most of my attention: “I want to reemphasize my commitment to the independence of the federal reserve to monitor inflation, and take steps necessary to combat it.” Upon first reading, I thought Biden implicitly gave the Fed a “green light” to get more aggressive in tightening monetary policy. After another reading, I think this statement was part of the elixir to try to instill anti-inflationary confidence in the American people. For the time-being, these reassurances did little to mollify financial markets. It was a wild day as traders and investors scrambled once again to recalibrate expectations for prices and monetary policy. By the close of trading, the current stock market rally looked like it slammed into a wall of inflation concerns.
The Stock Market Indices
Weakness has reappeared for the S&P 500 (SPY) in the form of a 2-day losing streak. The index last dropped 2 days in a row a month ago. The market now needs time to work out its feelings about the renewed threat of inflation and the implication for potential acceleration of monetary tightening.
The NASDAQ (COMPQX) slammed into the wall of inflation more convincingly. The current 2-day loss puts the tech-laden index in immediate danger of testing the 20DMA uptrend. Based on my prior bullish read on the market, I bought a fresh set of QQQ call options. Writing this post has me rethinking that trade.
The iShares Russell 2000 ETF (IWM) fell nearly straight down like the NASDAQ. Its 1.6% loss puts it in imminent danger of testing the former all-time high. That same level served as the top of 2021’s trading range. Like QQQ, I bought IWM call options into this pullback. If my new read on the stock market pans out, IWM will slice through support as quickly as it broke out above that threshold. Accordingly, I am not rushing to add to my position.
Stock Market Volatility
The volatility index (VIX) started rising last week, but I barely registered any signal from it. Now the VIX is on a rare 5-day winning streak. Still, the faders may have already put an end to the rally by pushing back from the 20 level.
The Short-Term Trading Call While Facing a Wall of Inflation
- AT50 (MMFI) = 62.7% of stocks are trading above their respective 50-day moving averages
- AT200 (MMTH) 54.7% of stocks are trading above their respective 200-day moving averages
- Short-term Trading Call: neutral
Just like that, I need to retreat from my (cautiously) bullish trading call. AT50 (MMFI), the percentage of stocks trading above their respective 50DMAs, fell from Monday’s peak at 68.3% and closed at 62.7%. Per my AT50 trading rules, this reversal just under the overbought threshold of 71% is a bearish signal. However, I am not ready to flip bearish so quickly. The bullish momentum was strong going into this wall of inflation. So, I am conceding defeat by dropping down one notch to neutral. If the market turns on a dime, I will stay neutral to avoid whiplash in the trading call.
AT200 (MMTH), the percentage of stocks trading above their respective 200DMAs, is feeling the same pressure as AT50.
Message from AUD/JPY
Ironically, the currency market was warning about trouble ahead. The Australian dollar versus the Japanese yen (AUD/JPY) topped out in late October and tumbled into this week.Despite the importance of AUD/JPY to gauging risk appetites, I chose to discount the implications given all the other bullish signals from market breadth. Now I am watching the coming test of 50 and 200DMA support like a hawk.
I am also watching the U.S. dollar index (DXY) more closely. The greenback broke out to a 16-month high. The path here has been choppy, but, increasingly, it looks like the dollar is on an extended uptrend cycle. At some point, the stock market is going to complain bitterly about the stronger dollar. However, the path to tighter monetary policy should provide an ever more important tailwind to the dollar.
Stock Chart Reviews – Below the 50DMA
Restaurant Brands International Inc (QSR)
I have been looking for an entry to return to Restaurant Brands International (QSR). QSR is part of the “chicken trade” with its Popeye’s Louisiana Kitchen franchise. In bullish mode, I took a nibble on today’s confirmed pullback from 20DMA resistance. I am currently expecting the recent low to hold as support from the 2021 lows. However, QSR will hurt in the face of an inflation problem.
Purple Innovation (PRPL)
Suddenly long-standing downtrends are providing meaningful earnings signals. Bedding company Purple Innovation (PRPL) is the latest of many notable stocks to suffer a massive post-earnings blow-up on the heels of very poor technicals. The 24.4% loss took PRPL to a 17-month low.
Stock Chart Reviews – Above the 50DMA
iShares 20+ Year Treasury Bond ETF (TLT)
I was early with a January put spread in iShares 20+ Year Treasury Bond ETF (TLT). However, the wall of inflation created a sudden change in trading in TLT. The ETF of long-term bonds lost 1.8% and all but confirmed a top at the resistance of the summer’s highs. TLT should provide first clues on how much the market really cares about inflation risks.
iShares Expanded Tech Software Sector ETF (IGV)
If inflation forces interest rates up, the proposition for very expensive tech stocks gets shaky – recall the “growth scare” in March when inflation fears were last salient. The iShares Expanded Tech Software Sector ETF (IGV) is full of expensive stocks with sky high valuations. Accordingly, IGV fell hard by 2.9%. A test of 50DMA support seems likely soon. A 50DMA breakdown could be an early warning for the rest of the market.
Tesla (TSLA)
In an earlier post, I noted my concerns for the parabolic run-up in Tesla (TSLA). I was content to wait out the frenzy. Sure enough, TSLA provided yet one more example of he dangers of parabolic run-ups. The pullback was even more dramatic than the run-up. The 12.0% loss unfolded in the wake of Elon Musk announcing his desire to sell stock to cover taxes on stock options. A gap down the day before setup the tumble. Since such a flush reduced the odds of more deep selling (right away), I bought a calendar call spread. The subsequent 4.3% rebound in TSLA allowed me to take my targeted profit well ahead of schedule. Now I am waiting for the dust to settle and the technicals to demonstrate some stabilization.
Be careful out there!
Footnotes
“Above the 50” (AT50) uses the percentage of stocks trading above their respective 50-day moving averages (DMAs) to measure breadth in the stock market. Breadth defines the distribution of participation in a rally or sell-off. As a result, AT50 identifies extremes in market sentiment that are likely to reverse. Above the 50 is my alternative name for “MMFI” which is a symbol TradingView.com and other chart vendors use for this breadth indicator. Learn more about AT50 on my Market Breadth Resource Page. AT200, or MMTH, measures the percentage of stocks trading above their respective 200DMAs.
Active AT50 (MMFI) periods: Day #396 over 21%, Day #59 over 31%, Day #31 over 41%, Day #11 over 51%, Day #8 over 60% (overperiod), Day #176 under 72% (underperiod)
Source for charts unless otherwise noted: TradingView.com
Grammar checked by Grammar Coach from Thesaurus.com
Full disclosure: long TLT put spread, long QQQ calls, long IWM calls, long QSR
FOLLOW Dr. Duru’s commentary on financial markets via StockTwits, Twitter, and even Instagram!
*Charting notes: Stock prices are not adjusted for dividends. Candlestick charts use hollow bodies: open candles indicate a close higher than the open, filled candles indicate an open higher than the close.
Thanks for your work, and best wishes.
And thank you for reading!