
Stock Market Statistics
- AT40 = 48.2% of stocks are trading above their respective 40-day moving averages (DMAs)
- AT200 = 51.5% of stocks are trading above their respective 200DMAs (8-month high)
- VIX = 29.6. (a plunge of 16.8%)
- Short-term Trading Call: neutral (downgrade from cautiously bullish)
Stock Market Commentary
At the time of writing, the U.S. Presidential election has yet to produce a winner. No matter the outcome, ensuing legal fights should keep the political drama at high pitch. The prospects did not worry the general stock market as the S&P 500 (SPY) and NASDAQ rallied with a vengeance. These indices completely flipped the script on the gathering storm of 50DMA breakdowns that brought the stock market close to oversold trading conditions. Yet, on balance, I see this as a time to retreat to neutral on the stock market as the breadth of today’s rally was extremely suspect.
The Stock Market Indices
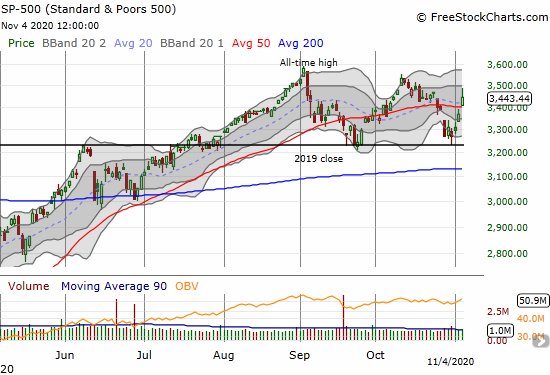
The S&P 500 (SPY) broke out above its 50-day moving average (DMA) for a 2.2% gain. This move is technically bullish where buyers can get in and place stops under the 50DMA. At current levels, the S&P 500 (SPY) has essentially gone nowhere and barely trades above its pre-pandemic all-time high. Going neutral on the stock market helps me see this churn for what it is: a call to buy the lower part of the range – conveniently defined by the 2019 close – and sell the higher part (conditioned on other technical indicators of course – see below).
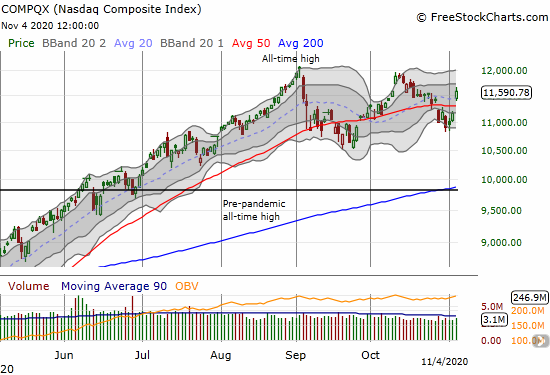
The NASDAQ (COMPQX) put on an even stronger show with a breakout above BOTH its 20 and 50DMAs. The resulting 3.9% gain took the tech-laden index close to a 3-week high. The NASDAQ never tested its September lows like the S&P 500 did. Accordingly, I give the NASDAQ slightly better odds of defying the trading range and breaking out in coming weeks or months.
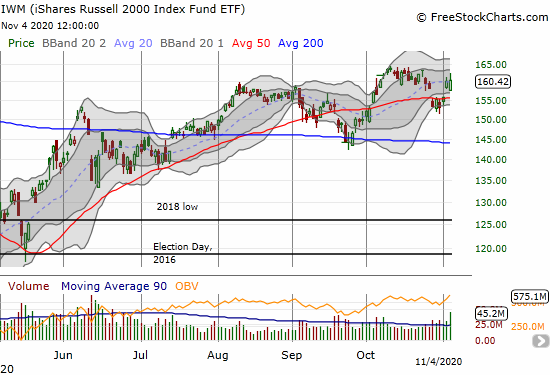
The iShares Russell 2000 Index Fund ETF (IWM) did not participate in the day’s celebrations. In fact, buyers had to lift IWM from a gap down just to close near to flat. This trading action contributed to my desire to retreat to neutral on the stock market. Note there is no need to sell the IWM while it looks comfortable with the previous day’s gap over its 50DMA,
Stock Market Volatility
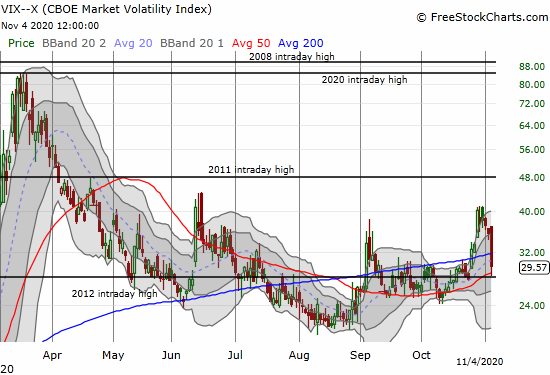
The inability of the volatility index (VIX) to follow-through on last week’s surge was a glimmer of bullishness heading into the election. Today’s post-election plunge of 16.8% makes me a lot more interested in bets on higher volatility. For example, I accumulated more shares of the ProShares Ultra VIX Short-Term Futures ETF (UVXY); I bought some shares the day before “just in case.” The VIX is considered elevated when it trades above 20. The VIX has yet to decline below 20 the entire pandemic; the VIX came closest to 20 in August. The volatility index has spent the last two months above 25 and has spent roughly 4 of the last 5 months above 25.
The Short-Term Trading Call
AT40 (T2108), the percentage of stocks trading above their respective 40DMAs, went nowhere despite the day’s rally on the major indices. This lack of confirmation and signs of narrowing participation in the upside clinched my desire to retreat to neutral on the stock market despite the bullish 50DMA breakouts. This change mentally prepares me to flip bearish when the stock market wrestles with overbought levels (above 70%).
I am also more wary because the market called the election completely wrong. “Blue wave” plays, like alternative energy and infrastructure, sold off and traders rushed back into big cap tech names in a big way. Until today’s rally, I thought I may have moved too early to nibble on big cap tech names on Friday. I took profits on all but one of those trades (see below).
Being contrary, I am now looking to buy into the industrial names that got slammed. I think the prospects for generous government spending remain relatively good as the economy will need a lot more help no matter who controls the purse strings. For example, I added a call to a Caterpillar (CAT) calendar spread. CAT lost a whopping 7.4% on the day. The stock closed at its lows and stopped just short of 50DMA support. United Rentals (URI) plunged 11.1% on the day. These kinds of 1-day losses look extreme and are likely the result of herding into the pre-election narratives.
Stock Chart Reviews – Below the 50DMA
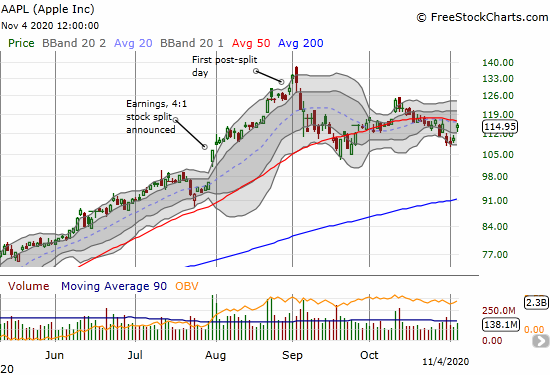
Apple (AAPL)
Until today, Apple (AAPL) was stuck in a downtrend that confirmed a bearish 50DMA breakdown. By rule, I plowed into weekly call options on Friday and gritted my teeth waiting through Monday’s rare weakness and Tuesday’s tepid rally. Today’s 4.1% rally was all the pop I needed to take profits. AAPL is now testing important overhead resistance at its 50DMA.
Shopify (SHOP)
Shopify (SHOP) looks like it is waiting for its uptrending 200DMA to catch up. SHOP has churned for 4 months. The stock has also pivoted around its 50DMA for the last two months. Earnings last week took SHOP below its 50DMA. A fresh close above the 50DMA will get me considering a buy of call options.

Stock Chart Reviews – Above the 50DMA
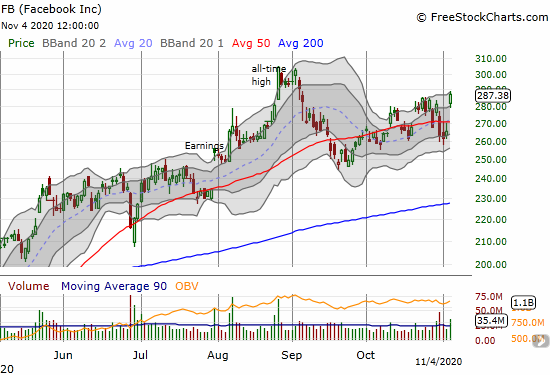
Facebook (FB)
Facebook (FB) sold off 6.3% on earnings last week as part of a rush out of big cap tech. I thought I was properly measured in buying a weekly $275 calendar call spread targeted just above 50DMA resistance. FB’s 8.3% surge made me directionally correct but incorrectly positioned. I am even likely to lose a little on this position unless FB suddenly corrects about half of the day’s gains.
Lyft (LYFT) and Uber Technologies (UBER)
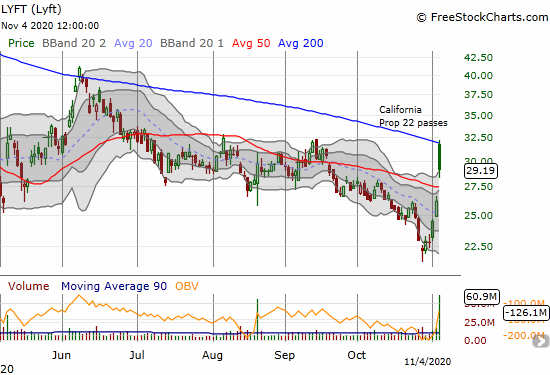
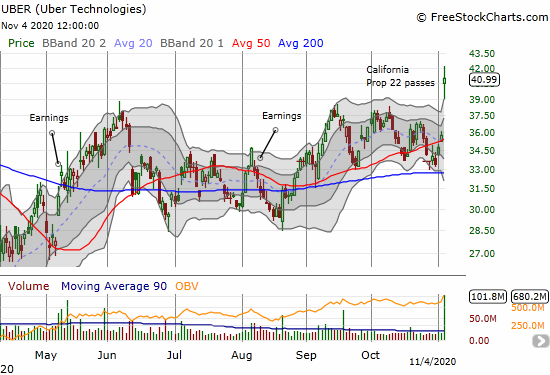
California’s Proposition 22 passed and delivered relief to the rideshare companies. Lyft (LYFT) and Uber Technologies (UBER) can continue operating in California with drivers employed as independent contractors. The corporate-sponsored ballot measured tossed in some sweeteners like minimum wages and benefits. However, the stocks of Lyft (LYFT) and Uber (UBER) celebrated the results quite differently.
LYFT gapped up right to 200DMA resistance but next proceeded to fade to an 11.3% gain. The stock did hold its 50DMA breakout. LYFT now needs to prove itself with a 200DMA breakout. The stock is a short under its 50DMA. UBER gapped up and closed near where it opened. The stock gained 14.6% and held its own well above its upper-Bollinger Band (BB). UBER’s move is a bullish breakout above two months of churn.
I am not interested in buying (or shorting) either stock, but I am glad I did not apply my skepticism on the ballot measures to short positions. A LOT of money went into the Prop 22 campaign, and the spending clearly did the trick!
— – —
FOLLOW Dr. Duru’s commentary on financial markets via email, StockTwits, Twitter, and even Instagram!
“Above the 40” uses the percentage of stocks trading above their respective 40-day moving averages (DMAs) to assess the technical health of the stock market and to identify extremes in market sentiment that are likely to reverse. Abbreviated as AT40, Above the 40 is an alternative label for “T2108” which was created by Worden. Learn more about T2108 on my T2108 Resource Page. AT200, or T2107, measures the percentage of stocks trading above their respective 200DMAs.
Active AT40 (T2108) periods: Day #28 over 20%, Day #3 above 30%, Day #2 over 40% (overperiod), Day #8 under 50%, Day #17 under 60%, Day #46 under 70%
Daily AT40 (T2108)
")
Black line: AT40 (T2108) (% measured on the right)
Red line: Overbought threshold (70%); Blue line: Oversold threshold (20%)
Weekly AT40 (T2108)

*All charts created using FreeStockCharts unless otherwise stated
The T2108 charts above are my LATEST updates independent of the date of this given AT40 post. For my latest AT40 post click here.
Be careful out there!
Full disclosure: long FB calendar call spread, long UVXY
*Charting notes: FreeStockCharts stock prices are not adjusted for dividends. TradingView.com charts for currencies use Tokyo time as the start of the forex trading day. FreeStockCharts currency charts are based on Eastern U.S. time to define the trading day.
My old friend…I acquired positions in IIVI in the 20s… You might want to keep an eye on it in your daily travels.
Wow! I also bought some in September I believe. But I took profits last week!