
Stock Market Statistics
- AT40 = 56.5% of stocks are trading above their respective 40-day moving averages (DMAs)
- AT200 = 53.1% of stocks are trading above their respective 200DMAs
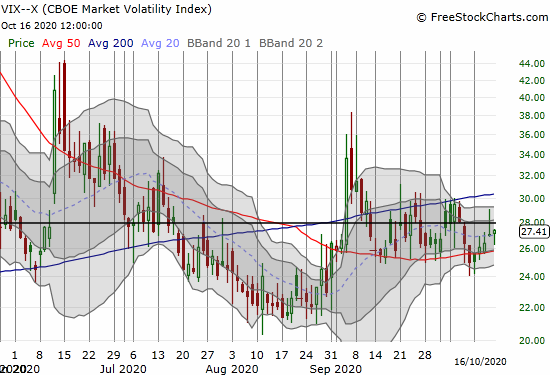
- VIX = 27.4
- Short-term Trading Call: cautiously bullish
Stock Market Commentary
The stock market made a bullish move last week as financials broke out, but I noted signs pointing to a cooling. The stock market cooling started the very next day. Buyers stepped back in on Thursday’s gap down, but they were unable to hold the Friday intraday high. Overall, the cooling was likely just the refreshment the stock market needed to prepare for the next push higher.
The Stock Market Indices
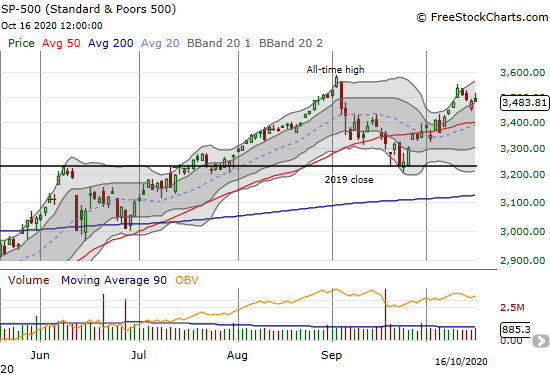
The S&P 500 (SPY) is trying to hold onto the bottom of its upper Bollinger Band (BB). This support could provide the launchpad for the next move higher. Still, a fade into the close made the effort more tenuous. The index closed the day flat. The stakes are high since the S&P 500 conveniently began this cooling just short of its all-time high.
The NASDAQ (COMPQX) lost 0.4%. Like the S&P 500, the tech-laden index is trying to hold onto the bottom of its upper-BB. The NASDAQ has high stakes in this cooling process as it also stopped just short of its all-time high.

The iShares Russell 2000 Index Fund ETF (IWM) is also at the bottom of its upper-BB, but the index of small caps is better positioned than the bigger indices. IWM ended a week of churn near the top of the consolidation range and still looks ready for a fresh breakout. I am primed to buy over $164.

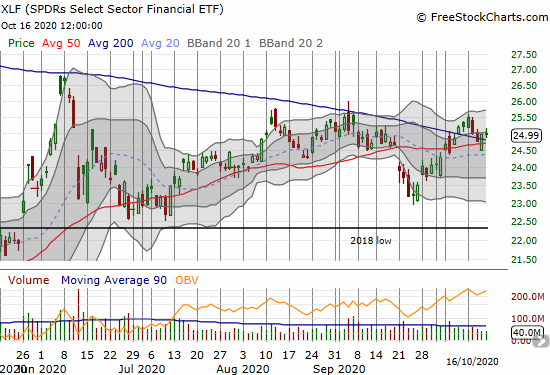
The SPDRs Select Sector Financial (XLF) provided a new piece to the puzzle for the bullish case at the beginning of the week. Yet, XLF could not escape the cooling process that wafted over much of the stock market. XLF is now fighting to hang onto converged support at its 50 and 200DMAs.
Stock Market Volatility
The volatility index (VIX) is floundering around with no direction. I have stared and stared looking for direction. Taking a big step back, I see an index that has gone absolutely nowhere in over a month. Nothing to do here but wait.
The Short-Term Trading Call for the Cooling Process
With the stock marketing cooling, the short-term trading call stays at cautiously bullish. Big risks definitely lay ahead, but I see no point in trying to overthink them. AT40 (T2108), the percentage of stocks trading above their respective 40DMAs, closed the week at 56.5%. The cooling from the low 60s instead of from the high 60s narrowly averted a rating downgrade on the short-term trading call (to neutral).
Stock Chart Reviews – Video Summary
Stock Chart Reviews – Below the 50DMA
DraftKings (DKNG)
Since identifying the breakout, I looked for a buyable dip in fantasy sports leader DraftKings (DKNG). The dip is finally here. However, the dip is not yet buyable because the stock slipped by 50DMA support. I am a buyer on a close above Friday’s intraday high. Further selling could take DKNG right back to middle of the summer’s consolidation zone.

Fastly Inc. (FSLY)
I have successfully traded in and out of FSLY numerous times. The plunge in Fastly (FSLY) last week woke me up bigtime.
I got caught with my hand in the cookie jar after overplaying my hand in the wake of a calendar call spread from the previous week. FSLY blew right through my strike price. Instead of just accepting the small loss, I covered the short side of the spread and initiated a new short call. The adjustment created a vertical spread expiring last Friday and left a lot of risk in the deep in-the-money call. In these cases, I sometimes buy a put option as a protective backstop. (Upon further thought, an even better, risk-appropriate move, is replacing the calendar spread with a new call spread at higher strikes.)
The plunge on Thursday completely blew out my position. The wake-up call forced me to review risks throughout my portfolios. I proceeded to do some major pruning. I am still bullish on the stock market, but I am a LOT more comfortable with the level of risk I am carrying. In retrospect, I can see how success made me dangerously complacent about risk.
On Friday, FSLY failed at 50DMA resistance. I bought a put option as a play on a return to the bottom of the summer’s trading range. Given insiders are dumping 6.4 million shares of stock in the wake of the revenue warning, I think FSLY is at risk of a test of 200DMA support in due time. For context, FSLY averages about 10.7M shares traded daily. Insiders are dumping the equivalent of almost 10% of FSLY’s float.

Stock Chart Reviews – Above the 50DMA
Caterpillar Inc (CAT)
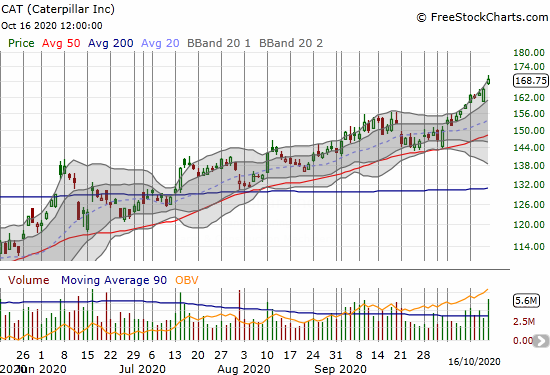
The bullish streak continues for Caterpillar (CAT). CAT gained 2.3% on the heels of a bullish analyst report. CAT’s all-time high sits tantalizingly close around $173. CAT’s bullish behavior is telling – one more indicator of strength in industrial plays.
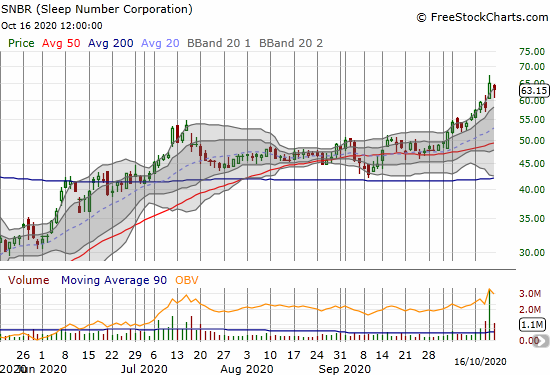
Sleep Number Corporation (SNBR)
Sleep Number Corporation (SNBR) broke out two Fridays ago. The stock hit an all-time high on Friday on high volume in the wake of a strong earnings report. SNBR is one of many household or housing-related stocks charging to greater heights. I am looking for a dip to buy.
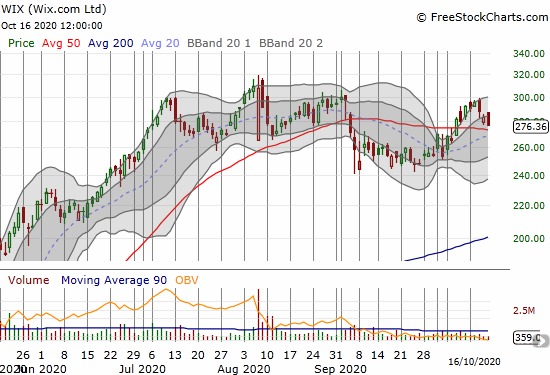
Wix.com Ltd (WIX)
Wix.com Ltd (WIX) is part of the large crew of new digital economy stocks. After a blistering streak to all-time highs in July and August, WIX has gone nowhere. Friday’s 2.5% loss reminds me that WIX is losing momentum despite a valiant recovery from September’s 50DMA breakdown. I do not see a new trade here, but I continue to monitor for one.
— – —
FOLLOW Dr. Duru’s commentary on financial markets via email, StockTwits, Twitter, and even Instagram!
“Above the 40” uses the percentage of stocks trading above their respective 40-day moving averages (DMAs) to assess the technical health of the stock market and to identify extremes in market sentiment that are likely to reverse. Abbreviated as AT40, Above the 40 is an alternative label for “T2108” which was created by Worden. Learn more about T2108 on my T2108 Resource Page. AT200, or T2107, measures the percentage of stocks trading above their respective 200DMAs.
Active AT40 (T2108) periods: Day #15 over 20%, Day #14 over 30%, Day #11 over 40%, Day #8 over 50% (overperiod), Day #4 under 60% (underperiod), Day #33 under 70%
Daily AT40 (T2108)
")
Black line: AT40 (T2108) (% measured on the right)
Red line: Overbought threshold (70%); Blue line: Oversold threshold (20%)
Weekly AT40 (T2108)

*All charts created using FreeStockCharts unless otherwise stated
The T2108 charts above are my LATEST updates independent of the date of this given AT40 post. For my latest AT40 post click here.
Be careful out there!
Full disclosure: long FSLY puts, long UVXY
*Charting notes: FreeStockCharts stock prices are not adjusted for dividends. TradingView.com charts for currencies use Tokyo time as the start of the forex trading day. FreeStockCharts currency charts are based on Eastern U.S. time to define the trading day.