
Given the mix of warning and promising signs in the stock market, I am more tuned than usual to collecting confirming signals or signs of invalidation. My radar perked up when I saw the potentially bearish chart pattern in Amazon.com (AMZN): the dreaded shooting star on June 10th.
Source: FreeStockCharts
According to swingtradebot.com, a shooting star “is made up of one candlestick (white or black) with a small body, long upper shadow and small or nonexistent lower shadow.”
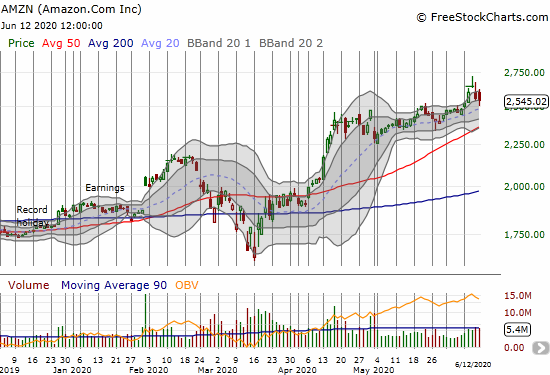
On June 10th, AMZN gapped higher and traded up as high as 2722 before fading to a close near the open for a net 1.8%. The next day, sellers gapped AMZN off this all-time high. AMZN lost 3.4% in the middle of a sharp sell-off in the stock market. AMZN suddenly left behind not just the dreaded shooting star but the even more dreaded abandoned baby top.
According to Steve Nison’s Candlecharts.com, the abandoned baby top is “a very rare Japanese candlestick top or bottom reversal signal. It is comprised of a doji star that gaps away (including shadows) from the prior and following sessions’ candlesticks.” In other words, Amazon.com’s stock doubled down on a topping pattern.
Friday’s 0.5% loss marginally confirmed the topping pattern. Closes below the 20-day moving average (DMA), and especially the 50DMA, would seal the deal. Note that AMZN last traded below its 20DMA on March 20th (I am not counting a marginal violation on May 12th). AMZN last closed below its 50DMA 2 months ago. Given how well these moving averages have supported AMZN’s rebound rallies, breakdowns below these levels would be definitively bearish.
This topping pattern is important and presents AMZN with its biggest test since the stock market crash in March. AMZN has been a clear stock market leader, and its e-commerce business model is perfectly suited for the contactless commerce of the era of the coronavirus pandemic. Amazon.com symbolizes what is working economically. During the March stock market crash, AMZN “only” reached a 52-week low while the S&P 500 (SPY) nearly erased its entire post Presidential election run-up. On the rebound from the lows, AMZN broke out to a new all-time high on April 14th well ahead of the NASDAQ’s breakout to an all-time high last week. The S&P 500 has yet to set a new all-time high. Amazon.com symbolizes resiliency.
So if AMZN continues to weaken as part of a topping pattern, I will find it hard to resist flipping bearish on the entire stock market. Similarly, if AMZN invalidates the topping pattern with a close above the intraday all-time high, I will have a fresh reason to stay bullish on the stock market.
My bearish trade on AMZN would involve calendar spreads given the expense of the options. For example, if AMZN closed lower again, I would pick a weekly calendar spread with a strike around $2440, the last launching pad for the stock price. Presumably, the stock will spend a bit of time working through that support to the downside. Selling a short call for the first week gives more time for the trade to unfold and at the same time bring down the cost of the bearish trade.
My bullish trade on AMZN would have to wait a considerable amount of time. First, the stock has to invalidate the topping pattern. Next, the stock has to rally and then settle into some kind of tradaeble support level. For the bullish scenario, I might as well wait to see what happens after July earnings.
Be careful out there!
Full disclosure: no positions