
Airline stocks were on a tear during a week of panic buying and catch-up trades. From worst to first, in less than a month airline stocks went from setting fresh multi-year lows to 3+ month highs on the heels of parabolic moves. The U.S. Global Jets ETF (JETS) summarizes the contours of the moves. From May 14th to Monday’s close, JETS gained 80.6%.
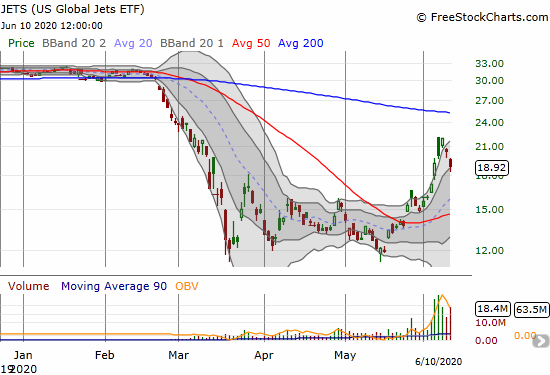
JETS was a buy on the breakout above resistance at its 50-day moving average (DMA) last month. The ETF has traded within its upper Bollinger Band (BB) channel since then – a confirmation of strong buyer interest. JETS transitioned quickly from a bullish breakout to a parabolic run-up. Trading volume also surged along with price as a further confirmation of buyer interest. The current two-day cooling off period represents the next buy setup.
JETS is a buy on a trade above the intraday high and a stop-loss candidate below today’s intraday low. In the former case, the move confirms fresh buyer interest. In the latter case, the bullish run through the upper-BB channel comes to an end and thus increases the risk of a larger pullback to the next level of support like the 20 or even the 50DMA.
Individual airline stocks have similar charts to JETS, but there are nuances.
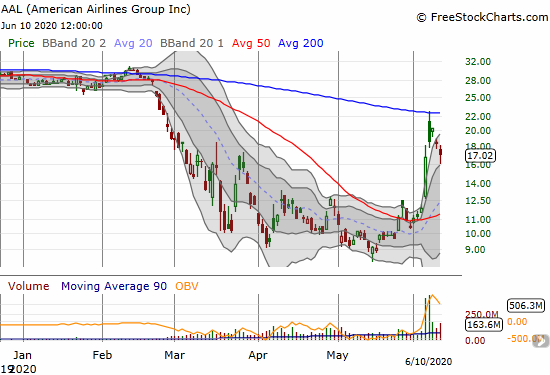
American Airlines (AAL)
American Airlines (AAL) wasted no time with a build-up. The stock flipped the switch straight into a 2-day parabolic run-up. On June 4th, AAL soared an incredible 41.1%. The next day, AAL gapped and crapped under 200DMA resistance. Sellers have now returned AAL to its closing price on June 4th’s incredible day. The stock bounced off the bottom of its upper-BB trading channel in an attempt to hold onto critical support.
Note that just a month ago, AAL was trading at an 8-year low.
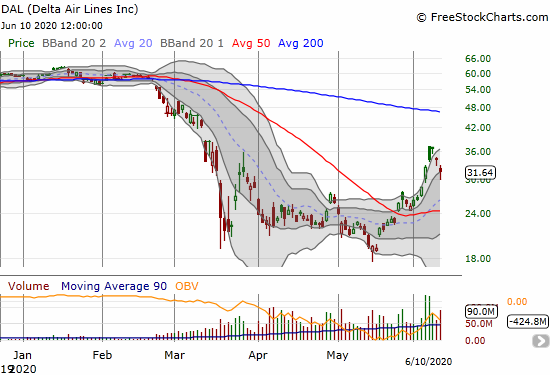
Delta Airlines (DAL)
Delta Airlines (DAL) struggled to hold on to support at the bottom of its upper-BB channel. Given the shakiness of the rebound, I am content to wait for a higher close as a confirmation of fresh buying interest. DAL is also a stock I feel comfortable shorting (put options) on a trade below the day’s intraday low.
Last month, DAL hit a 7-year low.
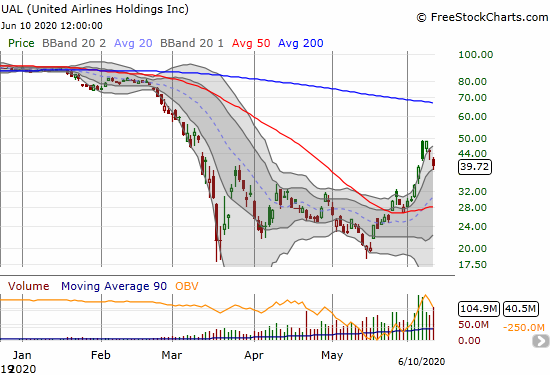
United Airlines (UAL)
I have written before about United Airlines (UAL) being my favorite airline stock of the bunch. While UAL hit a new 8-year closing low last month, the stock avoided trading below its intraday lows from the March collapse. This supportive bottoming pattern makes the current setup even more attractive. The hold on support at the bottom of the upper-BB trading channel also looks the most convincing. Still, the same rules on a buying (and selling) trigger apply to UAL as with the other airline stocks.
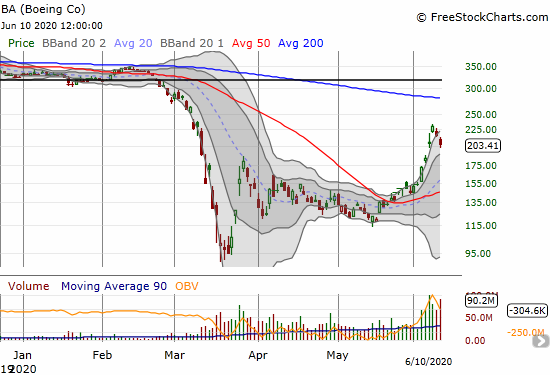
Boeing (BA)
I started the week warning about the parabolic move in the stock of Boeing (BA). BA countered my skepticism with another gap up and 12.2% gain. However, Boeing was not spared the selling of the past two days in these catch-up/panic buying stocks. The stock is right back to its closing price from the time of my post. This is a critical juncture for the stock. The winner of the bear/bull battle will likely be able to ride the momentum for quite some time. A rebound could take BA all the way to 200DMA resistance. A continued slide will likely take BA all the way to support at its 20 or 50DMA.
Source for charts: FreeStockCharts
Trading Summary
I am looking to do a combination of trades in this sector. On the bullish entry signal, I want to buy shares in JETS and call options in individual stocks. For example, the UAL June $45/50 call spread is a low risk, high reward play on a quick resumption of upside. Note that the options are not pricing in a return to run-up behavior. UAL topped out at $50 this week and the June $50 call option expiring next Friday only costs about $0.63. The June $33 put option costs the same price. So the market is also not pricing in a rapid reversal of last week’s run-up. I want to buy the options when they are cheap.
Boeing options also look “reasonably” priced. I am interested in a June/July $230 calendar call spread as a way of paying for a month-long hold on a run for 200DMA resistance (assuming BA will not surpass this week’s high for at least another week). To the downside I am fine swinging for the fence like buying a June $180 put. Call and put spreads are particularly attractive, but I do not want to cap upside potential.
Be careful out there!
Full disclosure: no positions
Thank you very much for this beautiful article. This is really great & informative. I really appreciate your thoughts. Well done.