
Purists in the financial markets often decry the “voodoo” of technical analysis. The U.S. jobs report for May, 2020 is an extreme version of how the fundamentals can also fail to provide sufficient guidance for trading and investing in financial markets. Economists and other sooth-sayers in consensus expected the U.S. economy to lose 8.3 million more jobs. Instead, the U.S. gained 2.5 million, perhaps the most historic miss by consensus ever? From the U.S. Bureau of Labor Statistics:
“Total nonfarm payroll employment rose by 2.5 million in May, and the unemployment rate declined to 13.3 percent, the U.S. Bureau of Labor Statistics reported today. These improvements in the labor market reflected a limited resumption of economic activity that had been curtailed in March and April due to the coronavirus (COVID-19) pandemic and efforts to contain it. In May, employment rose sharply in leisure and hospitality, construction, education and health services, and retail trade. By contrast, employment in government continued to decline sharply.”
The S&P 500 (SPY) has been in rally mode since the March 23rd bottom, including a bullish breakout above its 200-day moving average (DMA) on May 27th. While economic data piled on bad news after bad news during the coronavirus pandemic and associated health crisis, the stock market was already looking ahead to better days: first an end to the worsening of the news and next actual improvement. Yet the jobs news was enough of a surprise to push the index even higher to a 3+ month high on the heels of a 2.6% gain. The S&P 500 is almost flat for the year.
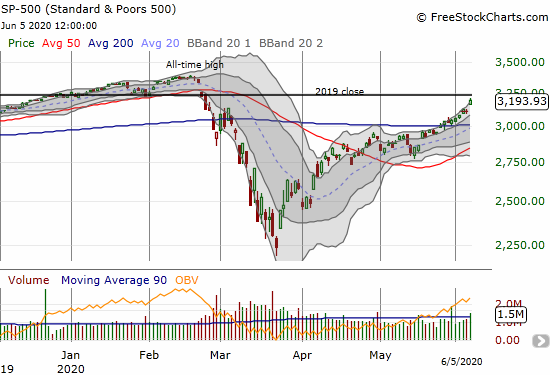
Source: FreeStockCharts
This jolt provides a timely backdrop to a brief review of the S&P 500’s behavior around the last period of massive job losses, the financial crisis.
During the financial crisis, weekly initial claims for unemployment benefits rose steeply starting in June, 2008. This leading indicator of unemployment did not peak until late March of the following year.
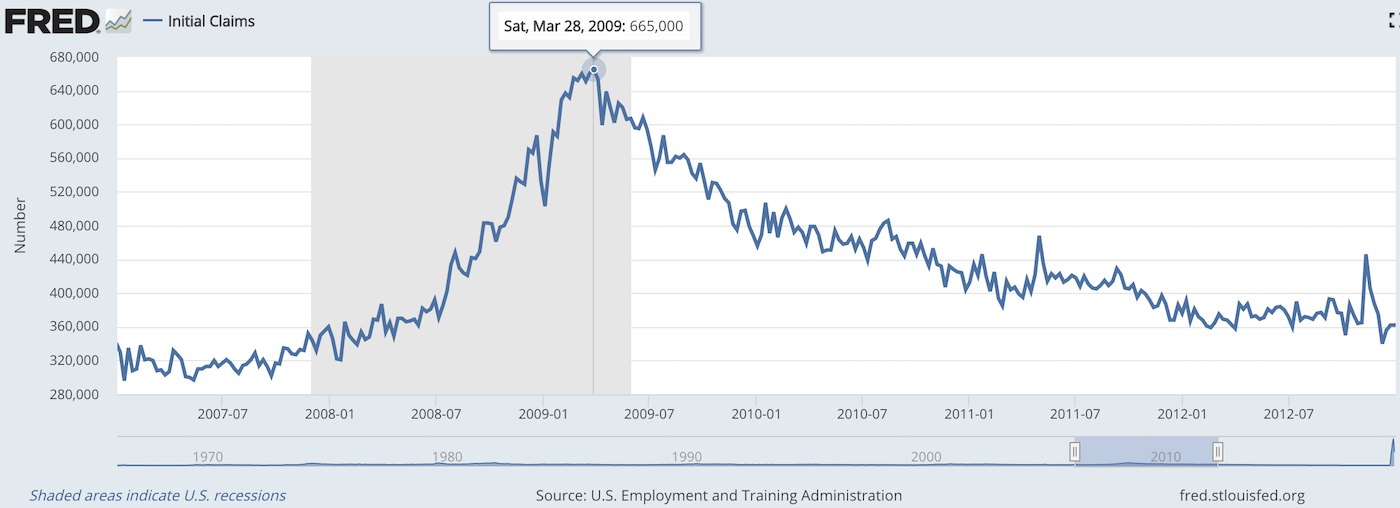
Source: U.S. Employment and Training Administration, Initial Claims [ICSA], retrieved from FRED, Federal Reserve Bank of St. Louis, June 3, 2020.
The timing of the peak in initial claims was essentially impossible to predict beyond the faith that at some point it had to peak. The stock market made its final bet on this peak with the historic bottom on March 9, 2009. After the index broke out above its 50DMA on March 23rd and successfully tested that moving average on March 30th, the stock market never looked back again. In other words, the stock market bottomed just ahead of the worst of the unemployment news and achieved a key technical milestone right around that same time. We could not know at the time, but the stock market appeared to announce that job losses would not get worse and would even soon begin improving.
The stock chart below of the S&P 500 (SPY) provides additional technical context.
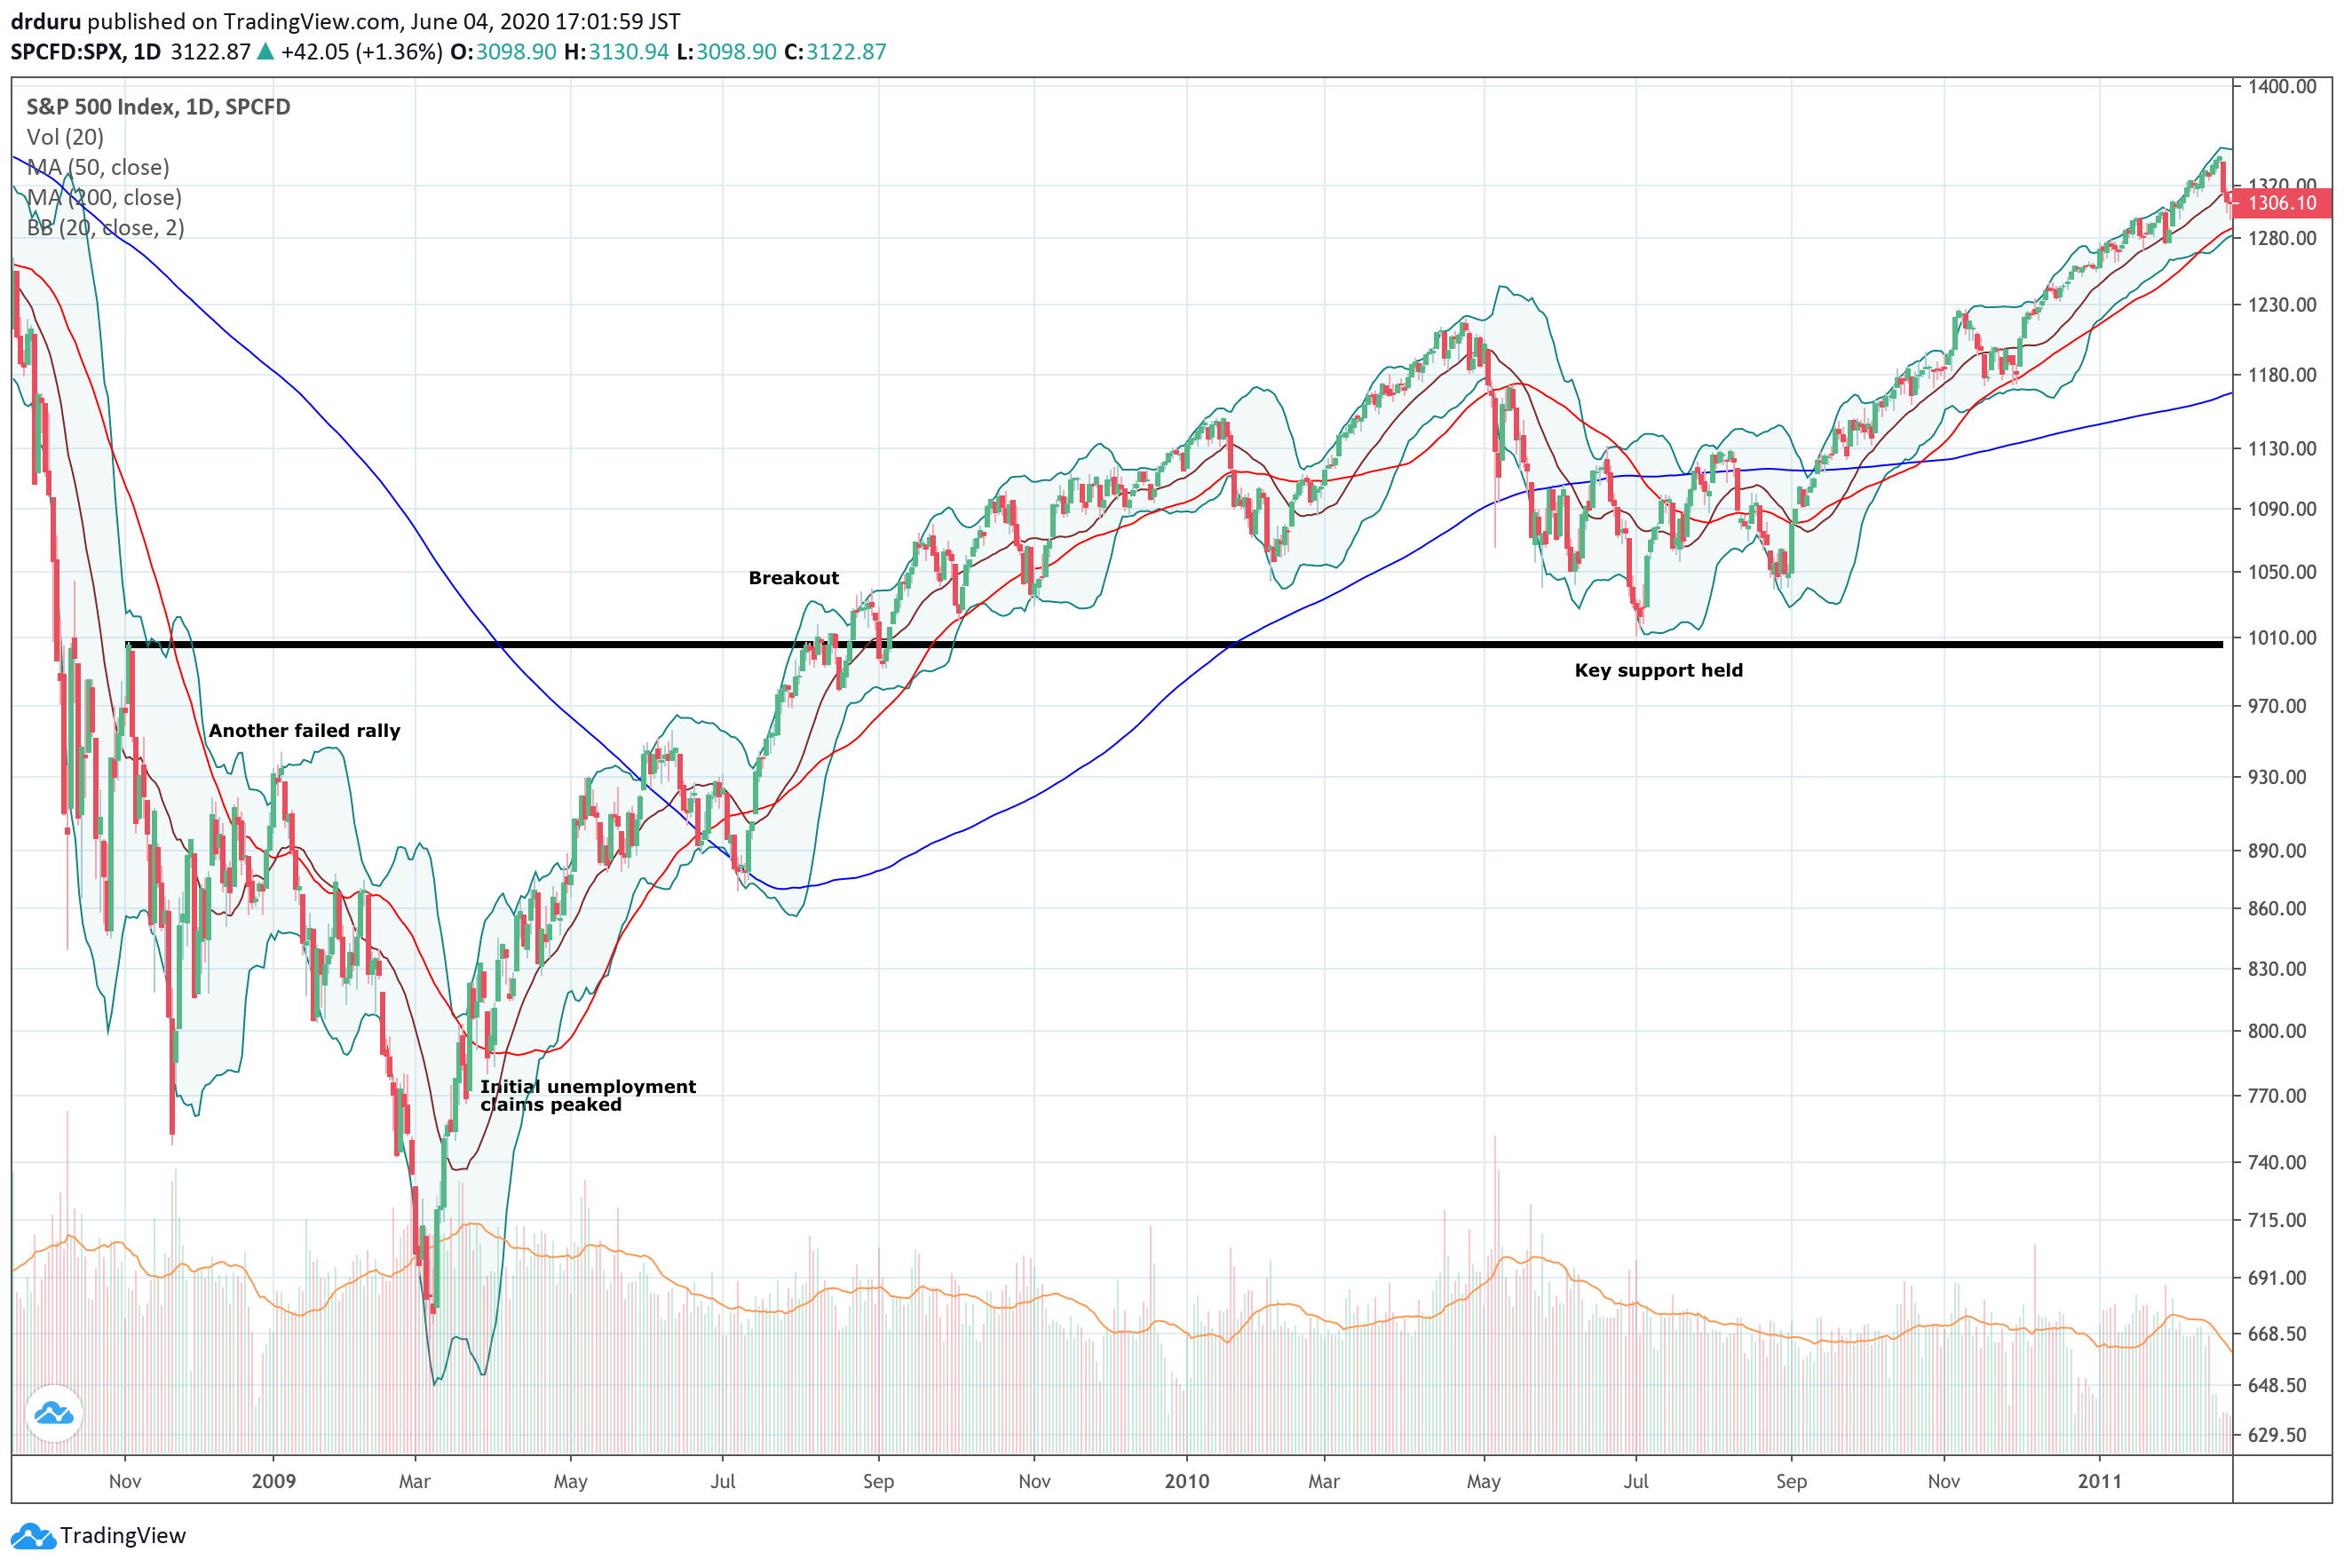
Source: TradingView.com
Fast forward to today. The relationship between extremes in the S&P 500 and extremes in initial claims reveals a fascinating parallel to the financial crisis.
In late March, 2020, initial claims surged all at once to almost 7 million. While enough time has not yet passed to conclude that this was THE bottom in initial claims, the sharp decline since then and the May upside jobs surprise suggest that initial claims will not return to that historically awful level during this economic cycle.

Source: U.S. Employment and Training Administration, Initial Claims [ICSA], retrieved from FRED, Federal Reserve Bank of St. Louis, June 3, 2020.
The S&P 500 effectively made the same conclusion about the worst of the initial claims data when it crashed into its final low on March 23rd, right around the time of the surge and likely peak in initial claims. Maybe in another year or two, we can look back to confirm the “wisdom” of the stock market and the technicals surrounding its bottoming.
While the on-going economic news remains awful in aggregate, the stock market made a bet that the worst is behind us. The path forward is uncertain as ever, but this episode of extremes reminds me of the importance of thinking contrary at moments of panic and deep negativity. Now, the S&P 500 is closing in on its all-time high, and the NASDAQ is just points away from its all-time high…even though the economic news is so much worse than it was in February at the time of the all-time highs. Fundamentals certainly cast doubt and aspersions on these levels in the stock market. However, the lesson remains…the price action, aka the technicals, remain the leading signal in my book.
Be careful out there!
Full disclosure: long SSO