
Housing Market Intro and Summary
Something surprising is happening in the middle of the current downturn in the housing market: buyers keep coming and home builders are staying resilient and resolute. A series of earnings reports from publicly traded home builders do not reflect the historic plunge in builder sentiment from April (see below). The latest and best example is the earnings report from LGI Homes (LGIH). The company described a relatively robust business and plans to continue growing.
In my last Housing Market Review, I described shelving the momentum from the previous Spring selling season. Apparently, plenty of people are stretching for the goods on the shelves. The data from April’s reports do not show the new momentum, so the reports from May will be very important for cross-checking the early assessments from the publicly traded home builders. The latest home sales data from Redfin shows a significant setback at the end of April after an initial jump. The initial jump got at least one researcher excited about a recovery in the middle of the coronavirus pandemic. Pending sales are maintaining a recovery. I tend to ignore pending sales out of a preference for making assessments from actual sales data. However, the fast-changing dynamics in the market make me more interested in tracking a higher number of data points and signals.
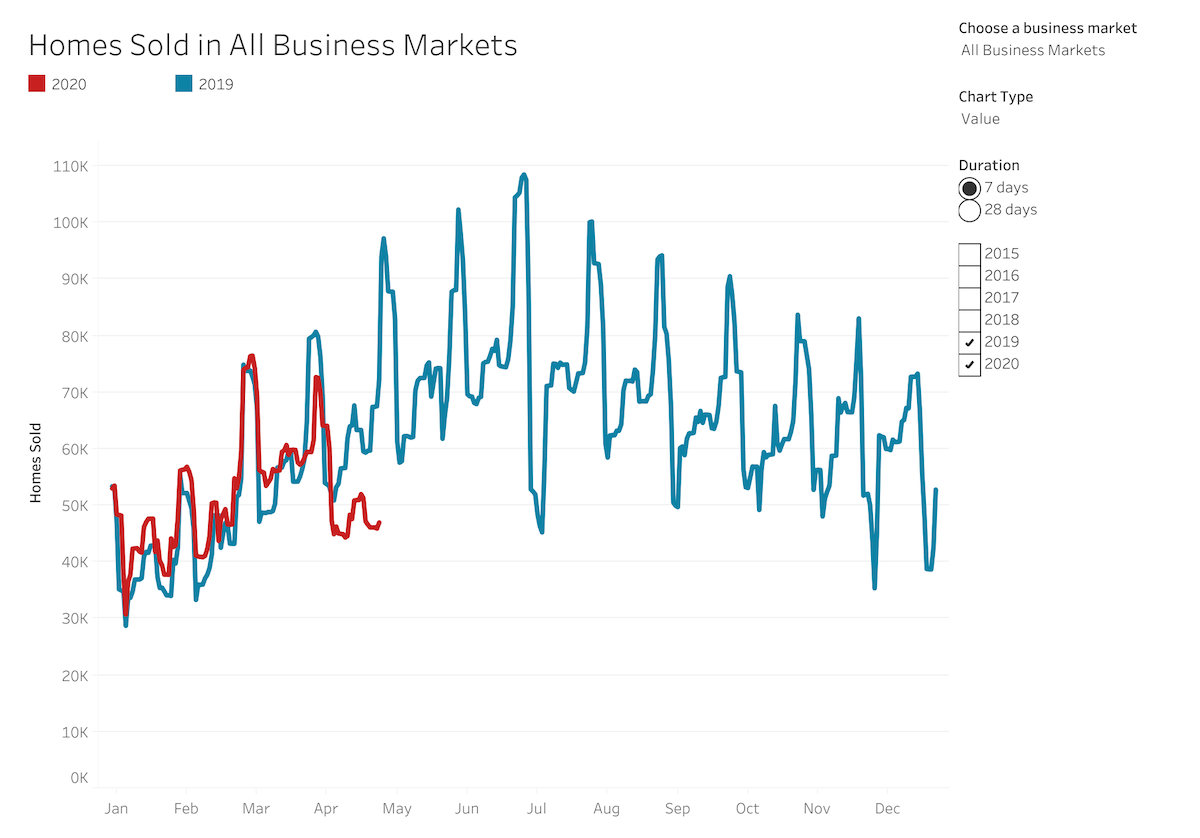
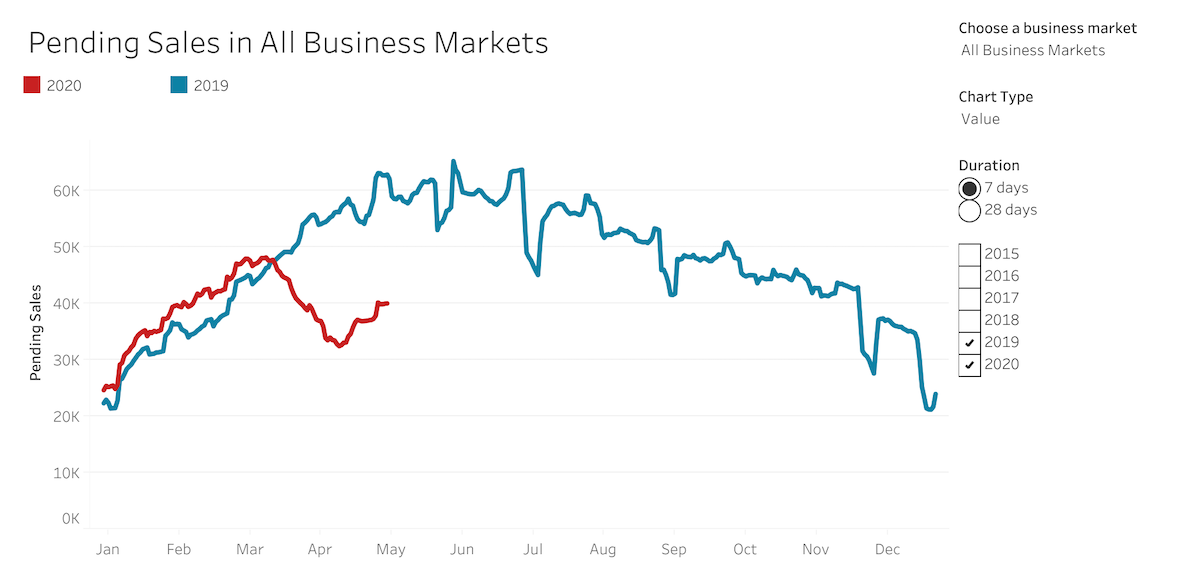
Source for charts: Redfin
The charts of home builders also suggest a bottom is already in the market place. The iShares Dow Jones US Home Construction Index (ITB) closed last week at a 2-month high. ITB confirmed a breakout above its 50-day moving average (DMA), and the test of the 2016 low already looks like a distant memory.
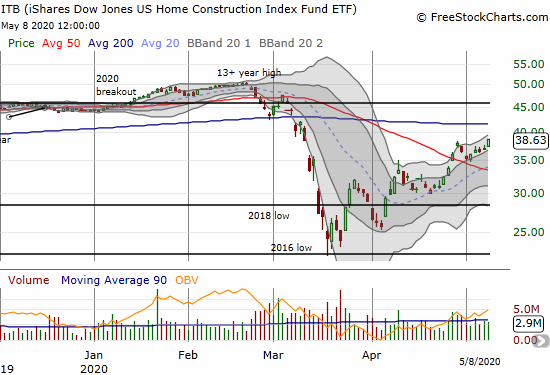
The stocks of individual home builders are in various stages of recovery similar to ITB.
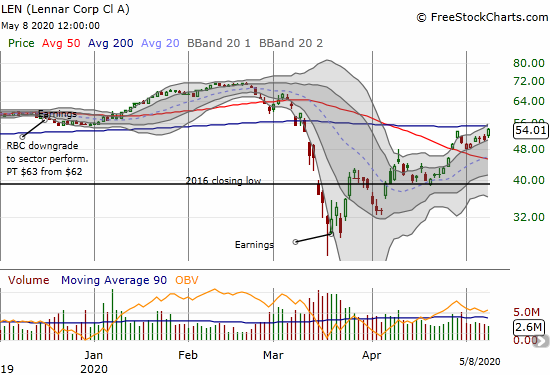
Lennar (LEN) is close to challenging its 200DMA resistance. LEN is up 84% from the closing March low.
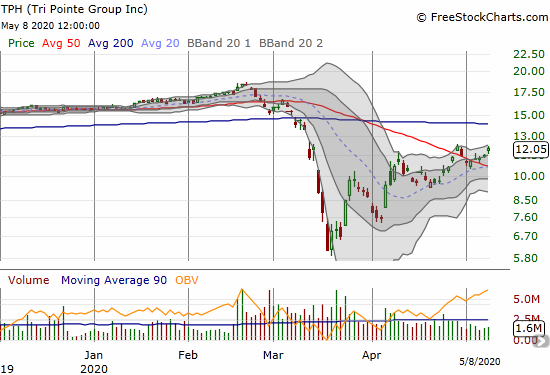
Tri Pointe Group (TPH) recently reported a relatively bullish earnings report that I will post soon. The stock confirmed a 50DMA breakout and trades 96% above its March closing low. The stock is already up 25% since reporting earnings on April 23rd.
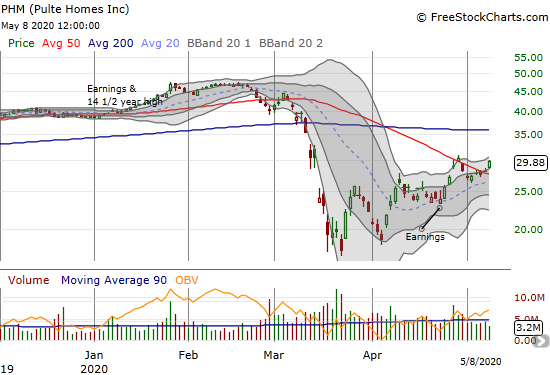
Pulte Homes (PHM) gained 6.0% on Friday and confirmed a 50DMA breakout. PHM is up 68% from its March low and trades with a gain of 25% since reporting earnings.
While builders have sported impressive post-recovery gains, the housing services players have delivered even more astounding results. I previously assumed that diminishing or relinquishing altogether the business of transacting homes would make investors less excited about growth prospects. Instead, both Zillow Group (ZG) and Redfin (RDFN) experienced tremendous acceleration last week.
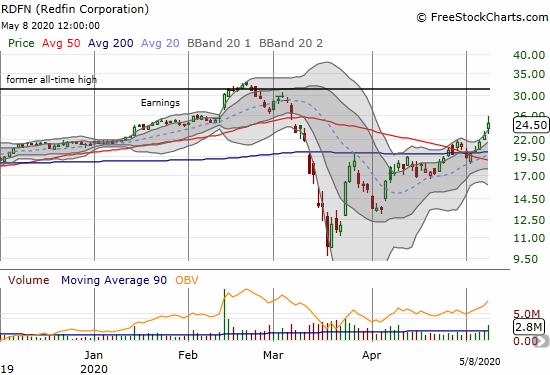
RDFN is up 137% from its March low. Friday’s 8.1% post-earnings gain confirmed the bullish shift in sentiment and further emphasized the recent 50/200DMA breakout.
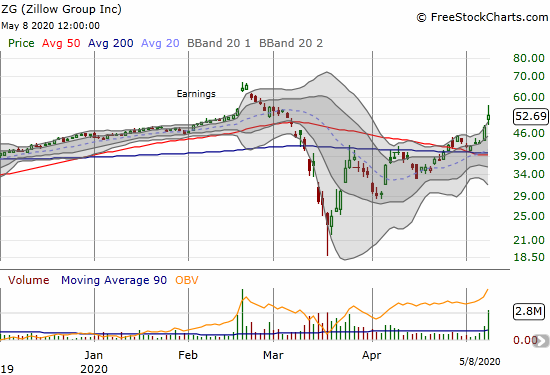
Zillow Group broke out with a 12% gain ahead of earnings and still had enough juice left for a 9.3% post-earnings gain. ZG now trades at a 2+ month high and has cleared the 50MDA breakdown from March.
While things are looking a lot better for housing-related stocks, I still used last week’s extended rally to take more profits on various plays. I sold shares of RDFN and call options in ZG. I also finally took profits on long-term holding Invitation Homes (INVH). I failed to sell INVH ahead of the March crash, and then I failed to add more shares during the sell-off. So I sold at much lower profits than I held in February.
Overall, I believe a LOT of, and perhaps most of, the coming housing recovery is priced into the related stocks. Current stock prices are reflecting optimism ahead of the data and the results. It is very possible that current housing demand is pulling forward from future demand. Extremely high unemployment (14.7% in April) and economic uncertainty usually tank the housing market. While the market likely priced in the calamity in the middle of March’s panic, economic realities will almost certainly place tight ceilings over the coming recovery. Stubbornly low supplies and high prices of homes should dampen demand or at least sales totals. Moreover, the seasonal trade for home builders is essentially over, meaning I am a lot less inclined to buy new shares in home builders. I am keeping my shares in ITB, but I will only jump back into additional home builders on pullbacks.
Housing Data
New Residential Construction (Single-Family Housing Starts) – March, 2020
The drop in housing starts was so bad that the Census Bureau felt compelled to provide the following reassurance about the estimates:
“Many governments and businesses are operating in a limited capacity or have ceased operations. As a result, their ability to provide accurate, timely information to Census may be limited.
For the March 2020 New Residential Construction Report, processing and data quality were monitored throughout the month and quality metrics, including response rates, fell within normal ranges for these surveys…
The reliability of the estimates as measured by the coefficient of variation for monthly totals and the standard error for month‐to‐month change has not changed substantially.
Housing starts hit a post-recession high in December, 2019. Given that level of activity, I am not surprised that the March starts fell precipitously, and I expect an even further drop in April. Builders will not feel compelled to build homes under such high amounts of pandemic uncertainty. Builders are consistently reporting a pullback in land investments and construction activity in their earnings reports.
March single-family home starts decreased 17.5% below February’s 1,037,000 starts but still managed a 2.8% year-over-year gain. Most likely, the bulk of March’s starts occurred before shelter in place orders descended upon the country in mid-March.
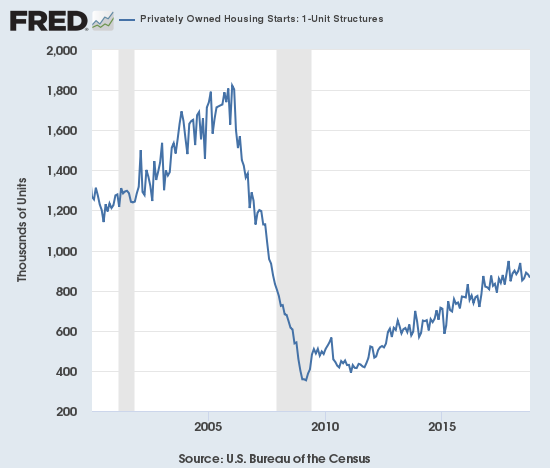
Source: US. Bureau of the Census, Privately Owned Housing Starts: 1-Unit Structures [HOUST1F], retrieved from FRED, Federal Reserve Bank of St. Louis, May 3, 2020.
For March, the regional changes were mixed with the West leading the way yet again. Builders have been adding to inventory in the West at a furious pace in the past several months. The West will likely see the biggest slowdown in activity in coming months given the economic shutdowns. The Northeast, Midwest, South, and West each changed -8.8%, +4.9%, -5.4%, and +25.3% respectively. The furious construction activity in the South cooled off again.
Existing Home Sales – March, 2020
The February report from the National Association of Realtors (NAR) cautioned that the numbers did not reflect the impact from the coronavirus crisis. Those numbers were quite strong. The March existing sales numbers definitely reflect impacts from the pandemic with a very strong divergence between declining sales and soaring prices.
The seasonally adjusted annualized sales in March of 5.27M were down 8.5% month-over-month from the slightly downward revised 5.76M in sales for February (previously 5.77M in sales). February was a 13-year high in sales. Year-over-year sales eked out a 0.8% gain.

(As of the March, 2018 data, the NAR further reduced historical data to just 13 months. For historical data from 1999 to 2014, click here. For historical data from 2014 to 2018, click here) Source for chart: National Association of Realtors, Existing Home Sales© [EXHOSLUSM495S], retrieved from FRED, Federal Reserve Bank of St. Louis, May 4, 2020.

Inventory levels continued their year-over-year decline. Absolute inventory levels of 1.50M homes increased 2.7% from February, but inventory was still down a whopping 10.2% from a year ago (compare to February’s 9.8%, January’s 10.7% and December’s 8.5% year-over-year declines, unrevised). “Unsold inventory sits at a 3.4-month supply at the current sales pace, up from three months in February and down from the 3.8-month figure recorded in March 2019.” The on-going year-over-year decline in inventory is now at ten straight months. The limited inventory continues to support higher home prices.
The median price of an existing home hit $282,500, yet one more large year-over-year increase of 8.0% and the 97th straight month of a year-over-year gain. Prices last peaked at $285,400 in June, 2019. As the prospect draws near for ending this stubborn streak, I am not so sure anymore that the market will avoid new highs in price. Sales activity still seem strong enough to drive prices ever higher of the ever more limited inventory sellers are willing to put on the market. Home builders are reporting an advantage over existing homes because they can offer virtual tours as well as the prospect of a virus-free home. Sellers of existing homes are surely nervous about the prospect of exposing their homes to many groups of people of unknown infection status. Prospective buyers going on coordinated virtual tours will have an even harder time looking behind the veneer of realtor presentations to understand the flaws of an existing home.
In December, the share of first-time buyers dropped to 31% from November’s 32%. In January the share bumped back up to 32% and stayed there for February. First-timers pushed up their share to 34% as investors clearly stepped away from the market. The average share for first-time homebuyers for 2016 was 35%. The NAR’s 2017 Profile of Home Buyers and Sellers reported an average of 34% for 2017, 33% for 2018, and 33% for 2019. I expected the share of first-time buyers to plunge alongside sales, but I did not consider the prospect of investors stepping away from the market faster than first-timers.
Investors only purchased 13% of homes in March, down from 17% of homes in February, January and December. The share of investors buying existing homes was 18% a year ago. Investor activity may be a key tell on the health of demand in the market.
In December and January all regions achieved strong year-over-year gains with the easy comparables. The regional changes for February were led by the West. March was mixed with the Northeast leading the year-over-year declines: Northeast -3.0%, Midwest +4.2%, South +0.9%, West -0.9%.
Like September through February, all regions experienced notable and robust price jumps in March. The decline in sales did not matter one bit. Here are the regional year-over-year changes in median home prices, amazingly similar as well as strong: Northeast +8.3%, Midwest +9.7%, South +7.5%, West +8.0%. Again, I strongly suspect there are few sellers who feel compelled to sell relative to the few buyers who feel compelled to get into a home in the middle of a pandemic. This imbalance between supply and demand could help drive prices to new all-time highs in coming months.
Single-family home sales decreased 8.1% from February and increased on a yearly basis by 1.3%. The median price of $282,500 was up a healthy 8.0% year-over-year and up from February’s $272,400 (unrevised).
California Existing Home Sales – March, 2020
Sellers moved a lot faster than buyers in California in March. A plunge in inventory was the main story as sellers sheltered in place and left the buyers to look elsewhere. The results of the monthly poll conducted by the California Realtors Association (CAR) says a LOT about the resulting supply and demand imbalance:
“Reflecting the dramatic change in market conditions, a monthly Google poll conducted by C.A.R. in early April found just one in four (26 percent) consumers said it is a good time to sell, down from 59 percent a month ago, and down from 48 percent a year ago. The market uncertainty has not curbed the optimism for homebuying as much; 28 percent of the consumers who responded to the poll believe that now is a good time to buy a home, slightly less than last year (22 percent), when interest rates were 82 basis points higher.” [note I believe the 22 percent is incorrectly reported]
The market for existing homes in California benefited from the first half of March which was relatively strong. The second half of the month was clouded by the shelter-in-place, lockdown orders. The C.A.R. reported existing sales of 373,070 homes, down 11.5% from February’s 421,670. Sales also declined 6.1% year-over-year and ended an 8-month streak of year-over-year gains.
The C.A.R. warned that the data will get worse in coming months: “The relatively moderate sales decrease that occurred in March is only a prelude to what we’ll see in April and May because sales were still modestly strong during the first two weeks of March before stay-in-place orders were implemented throughout the state.” The organization went on to point out that a 25% decline in pending sales at the end of the month portended an extended slowdown in housing market activity.
The slowdown did not dampen upward price pressures. March’s median price of $612,440 was up 5.6% from February’s $579,770 and up 8.3% year-over-year. March delivered the sixth straight month with a year-over-year price increase above 6%. The C.A.R. suggested that these price gains are not sustainable given they largely reflect deals closed in late February and early March. Still, I am not expecting a significant reversal of the price gains given buyers seem a lot more motivated than sellers.
Accordingly, the inventory situation worsened in March. The C.A.R.’s Unsold Inventory Index fell from 3.6 months in February to 2.7 in March. The index was also at 3.6 a year ago and sat at 2.5 months of sales in December.
New Residential Sales (Single-Family) – March, 2020
In the last Housing Market Review, I predicted that new home sales had reached a (short-term) peak at a 13-year high in January. I could not of course anticipate the pandemic-related implosion in the housing market, but I was looking at sentiment being so stretched. February’s downwardly revised sales of new single-family homes of 741,000 (previously 765,000) was down 4.6% from January’s significantly re-revised (downward this time) sales of 777,000. March’s 627,000 in sales were down 15.4% from February and down 9.5% year-over-year.
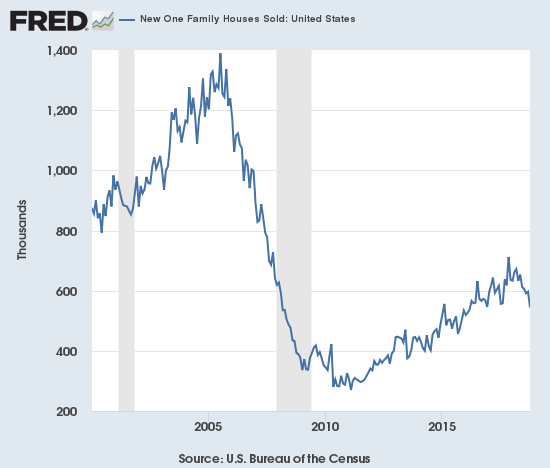
Source: US. Bureau of the Census, New One Family Houses Sold: United States [HSN1F], retrieved from FRED, Federal Reserve Bank of St. Louis, May 5, 2020.
Since hitting a peak in November and December, 2017, the median price of a new single-family home trended slightly downward largely from a ramp in entry-level and lower-priced new homes. Revisions significantly reduced February’s median from an all-time high of $345,900 all the way down to $330,100. The downtrend from 2017’s peak now looks intact. March’s median of $321,400 is another drop of 2.6% from February and a year-over-year increase of 3.5%.
October’s slight shift toward more expensive homes accelerated in November, but the shift was mixed in December and January (revised). In February, the mid tier of $200,000 to $299,999 fell back to a 10-month low. In March the share rebounded to the multi-year highs seen last summer. Buyers in the upper tiers, like in the West, and lowest tier pulled back.
Unlike with existing homes, the inventory of new homes surged from 5.0 to 6.4 months of sales. I expect inventory to grow further before coming back down as home builders scramble to sell down the inventory created by the robust housing starts from previous months.
On a regional basis the West suffered the largest and most dramatic decline, even larger than February’s pullback of 17.2%. March sales in the Northeast fell 4.0%, the Midwest dropped 9.2%, the South actually eked out a 1.3% gain, and the West plunged 30.8%.
Home Builder Confidence: The Housing Market Index – April, 2020
The plunge in the HMI was so dramatic, I had to write about it right after the report. In that piece I used the historic plunge in the HMI to claim that Freddie Mac’s forecast for the housing market was too optimistic. I also pointed to the halt in sales in the housing market and a massive plunge in pending sales at the time.
Fast-forward to today and the publicly traded builders are uniformly optimistic all things considered. They are confident in their virtual sales operations. They are reassuring about their strong financial positions. In some cases, they are pointing to “green shoots” of housing demand, especially with first-time home buyers. I am looking for the HMI to improve substantially in May based on these early pandemic-impacted builder reports. Yet, I am left wondering whether it is the private builders that are most pessimistic.
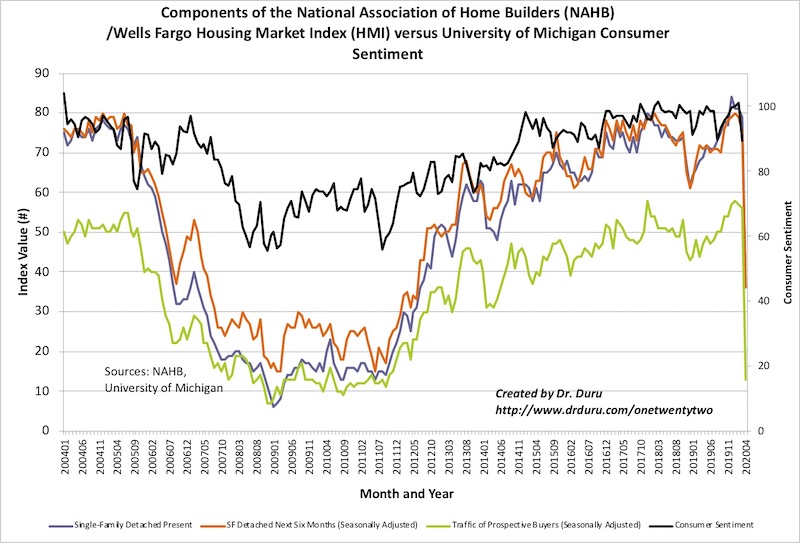
Source: NAHB
On a regional basis, HMI’s plunged in unison. The Northeast dropped to 19, an 8 1/2-year low; Midwest to 25, an 8-year low; the South to 34, an 8-year low; and the West to 32, an 8-year low..
Home closing thoughts
Mortgage Constraints
Uninterested sellers may not be the only obstacle facing enthusiastic post–pandemic buyers. Wary bankers are lifting credit requirements enough to send mortgage credit availability to a 5-year low. The contraction is understandable given the increased risks banks are now taking to help underwrite a growing list of economic survival plans for individuals and businesses.

Marketplace broadcast a 3-minute segment on the credit contraction…
Green Shoots?
At the end of April, CNBC published a report that described the changing mood in the last two weeks of April titled “Homebuilders suddenly see sales jump as renters flee small urban apartments.” The article relied on the research of a real estate group that showed housing demand coming off the bottom and getting back to end of March levels on a seasonal basis.
Buyers are showing preferences for new homes given more available inventory and sellers in the builders more able to handle the required virtual and socially distant process. Two-income renting households are ready to buy after lockdowns showed them the limitations of living in small apartments in dense urban areas. Most surprising was one private builder who expressed interest in building more spec homes given the recent success they had in getting a few spec homes off their books (see also the earnings report from LGI Homes). Overall, this article was packed full of surprises which make me even more eager to cross-reference with the data for April.
Even Landlords Need Some Love
While a lot of attention has focused on keeping a roof over the head of renters, landlords have had their share of troubles trying to make sure their mortgages are covered during this downturn. NPR’s Planet Money podcast did a segment on one fascinating landlord who is doing his best to help his renters and keep his own bills paid.
Be careful out there!
Full disclosure: long ITB shares