
Stock Market Statistics
AT40 = 82.3% of stocks are trading above their respective 40-day moving averages (DMAs) (overbought day #2)
AT200 = 16.5% of stocks are trading above their respective 200DMAs
VIX = 28.0
Short-term Trading Call: neutral
Stock Market Commentary
Winners and losers are becoming more and more distinct in the stock market. While skeptics and bears wring their collective hands about the aggregate indices, individual stocks in winning industries are enjoying remarkable recoveries and gains. A week and a half after first launching deeply into overbought territory, the aggregate stock market is deep in overbought territory again. Along the way, overbought conditions ended in an ominous way. The rebound from that point left behind some stocks who fulfilled the ominous outlook. While those stocks may represent latent bargains, the current winners look like the stocks with staying power for the new economy ahead.
The Stock Market Indices
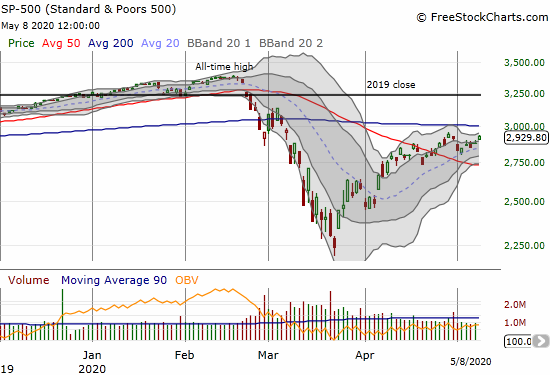
The S&P 500 (SPY) is on the edge of a major move as it trickles its way into progress. The index ended the week right at the high for April. Overhead resistance from the 200-day moving average (DMA) looms directly overhead.
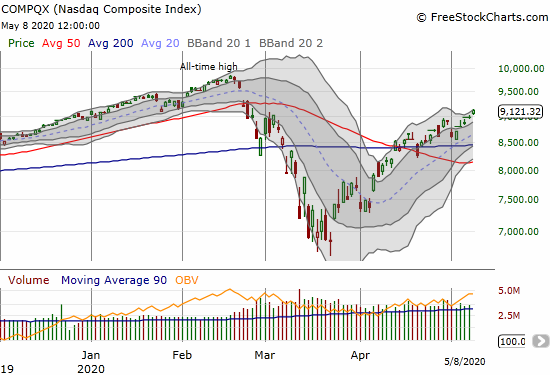
The NASDAQ (COMPQX) is racing ahead of the S&P 500 on a relative basis. The tech-laden index confirmed a 200DMA breakout almost a month ago. With a complete reversal of February’s 50DMA breakdown in sight, a new all-time high suddenly looks within reach well “ahead of schedule.”
Volatility
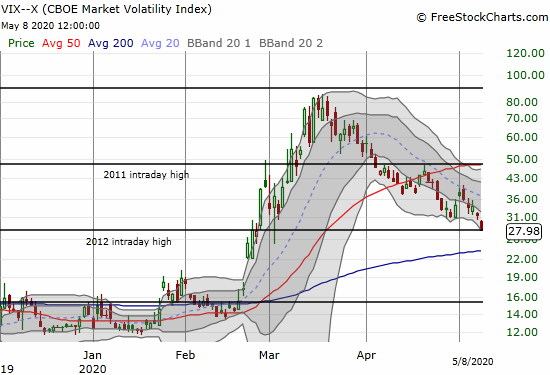
The volatility index (VIX) has returned to its downtrend. The fear gauge lost 11.0% on Friday and closed right at the 2012 intraday high. A breakdown below this important historical level immediately puts the 20 level and a complete reversal of the February breakout into play.
Overbought

The stock market is right back to overbought conditions.
AT40 (T2108), the percentage of stocks trading above their respective 40DMAs, surged deep into overbought territory by closing at 82.3%. I am impressed given just a week before AT40 slipped out of overbought conditions in an ominous way. The chances for an extended overbought rally are better than the last time since weaker stocks have been left behind. Traders should continue crowding into the winners. With AT40 so high, AT200 (T2107), the percentage of stocks trading above their respective 200DMAs, is a more important indicator. AT200 only closed at 16.5%, so there are a LOT of stocks that have plenty of upside recovery potential.
One small yellow flag is the S&P 500 trading slightly lower than it did the last time AT40 got this high. The divergence is not big enough for me to get bearish on the market but just enough to make me even more cautious.
The Short-Term Trading Call
The stocks already above their 200DMAs should be some of the best trades for buying the dips. They have proven their resilience through turbulent times. With the VIX imploding and a potential extended overbought period underway, 200DMA breakouts become particularly attractive.
All that being said, my short-term trading call stays at neutral. By rule, I cannot be bullish when the market is in an upside extreme. I also see no reason to get bearish until/unless the major indices break down below their 50DMAs. In the case of the NASDAQ, I might consider switching bearish if the NASDAQ fails a test at its all-time high, especially if the S&P 500 remains below its 200DMA at the time.
In the meantime, I am building cash by selling more and more of my long positions. This move is consistent with my AT40 trading rules. On Friday, I finally took profits on some of my shares in ProShares Ultra S&P500 (SSO) through the assignment of a covered call.
Stock Chart Reviews – Below the 50DMA
ShotSpotter (SSTI)
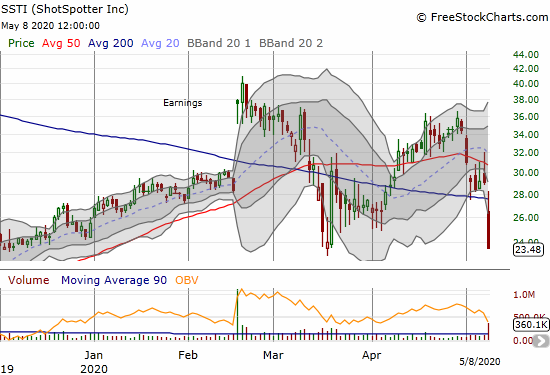
ShotSpotter cratered post-earnings and returned to the March lows. The company’s business is hampered by the inability or limited ability to travel for sales calls and local government budgets which are under severe stress. However, I am encouraged that the company still provided guidance, and that guidance was just slightly lower:
“The company now forecasts revenue to range between $43 million and $46 million (previously $46 million to $48 million), representing an increase of 9% at the midpoint compared to fiscal year 2019. The company continues to expect to remain GAAP profitable on an annual basis.”
ShotSpotter is also highlighting its strong balance sheet: “Financially, the quarter was marked by moderate revenue growth, solid gross margins, positive net income, and an improvement in our cash position by approximately $4 million from the end of last year.”
Because I am riding the “houses’s money” with my current position, I was less inclined to get out of the way of earnings that could not deliver great news. Now I am hoping SSTI can stay on course to make it to the other side of this recession.
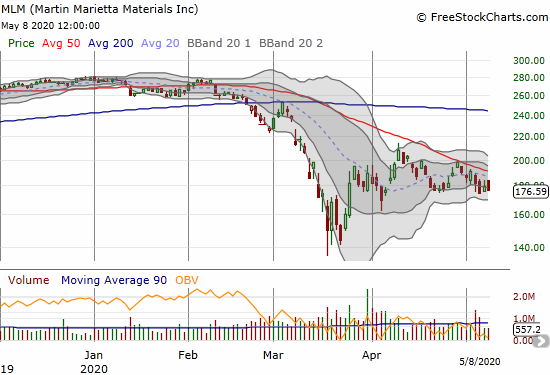
Martin Marietta Materials (MLM)
Martin Marietta Materials (MLM) is one of many stocks struggling to make the next bullish move. For a month, MLM has struggled to challenge downtrending 50DMA resistance. This failure means that the next big move should be particularly meaningful. A break below $174 would be a moment to short the stock. A 50DMA breakout would be a moment to chase the stock higher to 200DMA resistance. Note that sellers stepped in after MLM reported earnings last week.
Stock Chart Reviews – Above the 50DMA
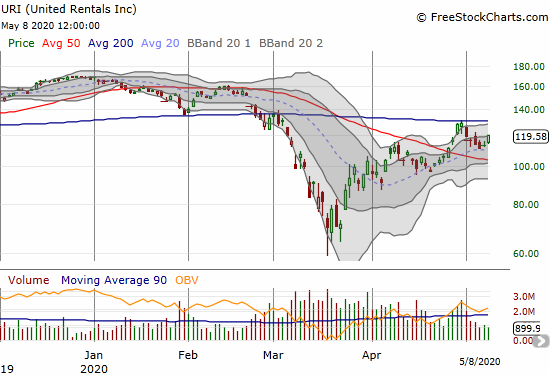
United Rentals (URI)
United rentals (URI) is in limbo between its 50 and 200DMAs. It is one of many stocks on the edge of its next big bullish move with the 200DMA providing the current ceiling. The company reported earnings on April 29th and stalled right at 200DMA resistance. While the stock found support at its uptrending 20DMA, URI only becomes interesting to me on a 200DMA breakout.
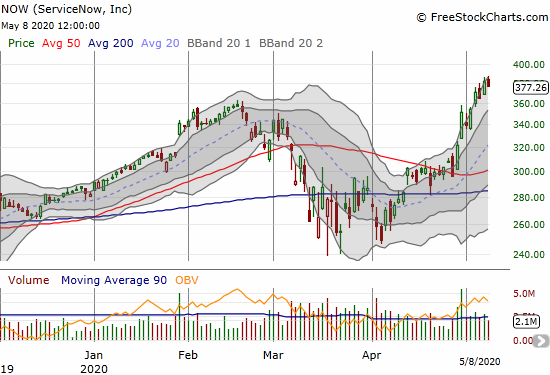
Servicenow (NOW)
Servicenow (NOW) got on my radar thanks to a trader’s note on activity in the weekly $350 call options. I was too cute in buying a calendar call spread with the $350 strike. NOW soared straight through $350 and on Thursday I switched the position to a $350/$370 call spread expiring this Friday. At all-time highs, NOW has secured/confirmed itself as a winner in the new digital economy.
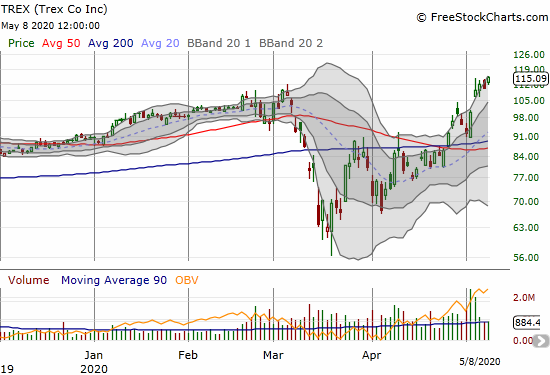
Trex Company (TREX)
While building materials companies like Martin Marietta Materials languish, Trex Company shines at all-time highs. The company “manufactures and distributes wood and plastic composite products, and related accessories for residential and commercial decking, and railing applications in the United States.” I guess a lot of people have been working on their decks while sheltering in place! For those who can still afford decks, spending time getting these set up makes sense. The good weather of Spring through Fall will provide a good respite from the confines of home while working from home (WFH) waiting for a vaccine for coronavirus (COVID-19).
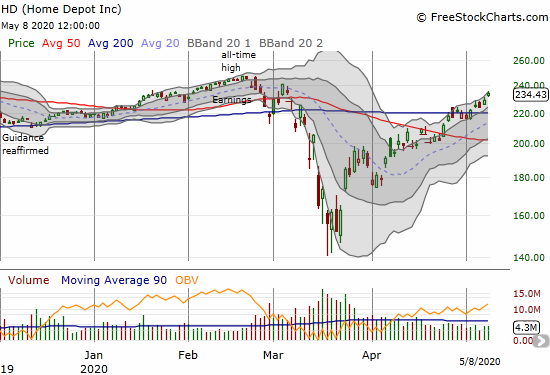
Home Depot (HD)
Speaking of home projects, Home Depot (HD) is another winner for these times. Last week, HD confirmed a 200DMA breakout. I never understood why the stock sold off so hard in March (besides the forced selling of panicked investors), so I think trading back towards its all-time high makes a lot of sense with the country starting to open up again.
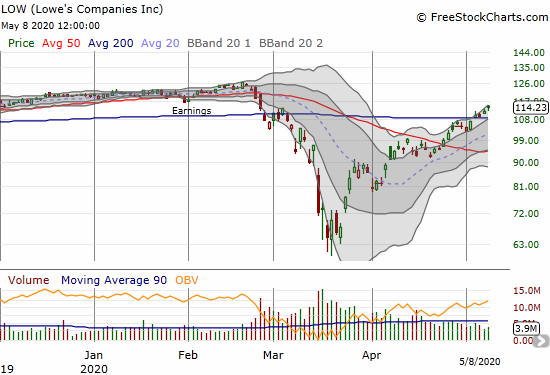
Lowe’s Companies (LOW)
Lowe’s Companies (LOW) is the home project retailer I decided to buy during the stock market crash. However, I sold at 50DMA resistance and have been waiting for the next dip ever since! I clearly should have just sat on my thesis and stuck with it. Like HD, LOW confirmed a 200DMA breakout last week.
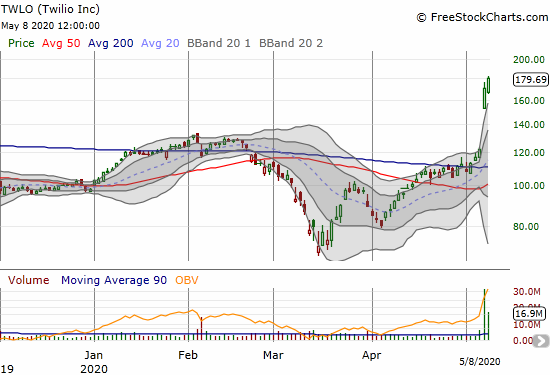
Twilio (TWLO)
I have had a hate/love relationship with Twilio (TWLO). I currently hate it just because I was not nimble enough to buy back in ahead of earnings. TWLO is yet another example of the power of buying a stock on a 200DMA breakout. TWLO trades at an all-time high and is one more winner for the new digital economy.
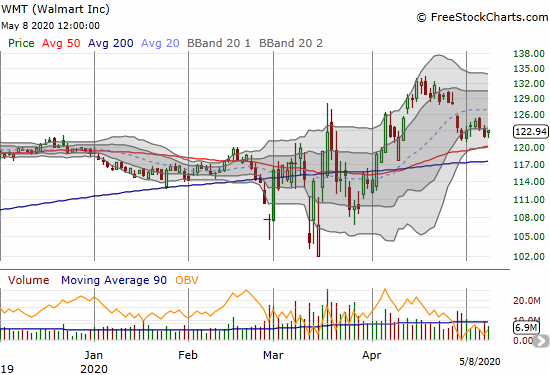
Walmart (WMT)
I am close to buying Walmart (WMT) as a long-term play. The stock is drifting toward 50DMA support. I like WMT because it is a favorite shopping destination and Federal government support checks will help fuel retail spending on the necessities.
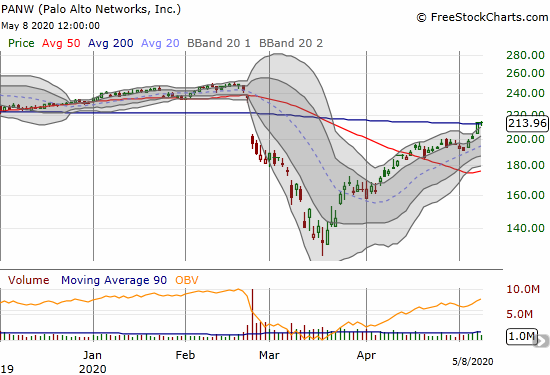
Palo Alto Networks (PANW)
Cybersecurity stocks have not been the slam dunks I would expect during these times of increasing cyber threats. With so many more people working from home, cybersecurity takes on an extra element of necessity. Palo Alto Networks (PANW) joined the small group of stocks trading above their 200DMAs. The company reports earnings on May 21st, so I am looking for a convincing confirmation of the 200DMA breakout before buying in. My choice will likely be a call spread ahead of earnings and shares after earnings.
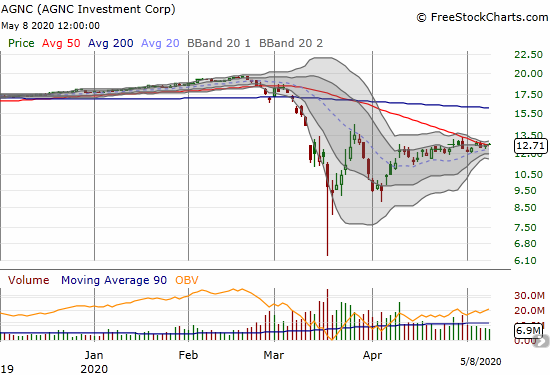
AGNC Investment Corp (AGNC)
AGNC Investment Corp (AGNC) is an example of a stock that gets little credit for a breakout. AGNC has been drifting along for a month, and its declining 50DMA finally caught up with price. This mortgage REIT is still interesting given the steep discount alongside the Federal Reserve’s vigorous rescue efforts. A Bollinger Band (BB) squeeze is starting to form, so I want to buy on a breakout above the current consolidation pattern.
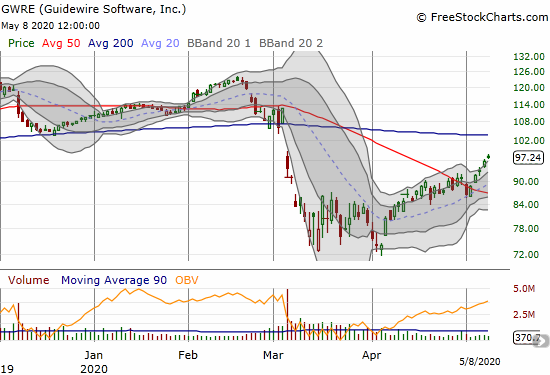
Guidewire Software (GWRE)
My position in Guidewire Software (GWRE) was going well into February. When the stock weakened below its 50DMA, I put the stock on my sell list given my bearish assessment of the stock market at the time. I was too slow and earnings took the stock down ahead of the stock market crash. Last week the stock picked up momentum on low trading volume. I decided to use the rally as an opportunity to preserve the profits I have left. I am still interested in this software provider for the property and casualty insurance industry, but I will wait to see what happens with the next earnings event to decide on a next move.
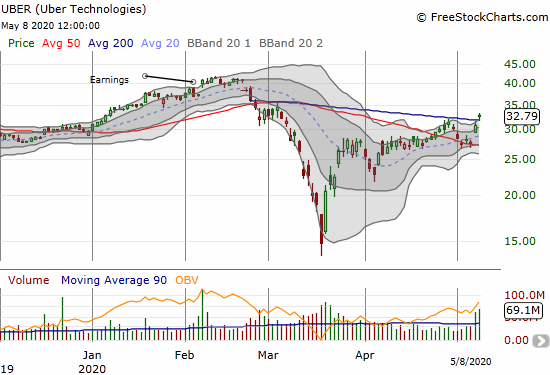
Uber Technologies (UBER)
I am scratching my head on Uber Technologies (UBER). People are less likely to move around for quite some time, and the company is still bleeding major amounts of money. According to the latest earnings report, GAAP net loss attributable to Uber Technologies, Inc. almost tripled from Q1 2019 to Q1 2020 at -$2.9B. UBER postponed profitability until next year, but I am skeptical of even that timeline. Yet, the technicals favor UBER with the stock managing a post-earnings 200DMA breakout. All UBER needs now is a confirmation in the form of a higher close. If UBER trades below its 200DMA again, I will be rushing to short the stock.
— – —
FOLLOW Dr. Duru’s commentary on financial markets via email, StockTwits, Twitter, and even Instagram!
“Above the 40” uses the percentage of stocks trading above their respective 40-day moving averages (DMAs) to assess the technical health of the stock market and to identify extremes in market sentiment that are likely to reverse. Abbreviated as AT40, Above the 40 is an alternative label for “T2108” which was created by Worden. Learn more about T2108 on my T2108 Resource Page. AT200, or T2107, measures the percentage of stocks trading above their respective 200DMAs.
Active AT40 (T2108) periods: Day #19 over 20%, Day #13 over 30%, Day #11 over 40%, Day #10 over 50%, Day #9 over 60%, Day #2 over 70% (overbought)
Daily AT40 (T2108)
")
Black line: AT40 (T2108) (% measured on the right)
Red line: Overbought threshold (70%); Blue line: Oversold threshold (20%)
Weekly AT40 (T2108)

*All charts created using FreeStockCharts unless otherwise stated
The T2108 charts above are my LATEST updates independent of the date of this given AT40 post. For my latest AT40 post click here.
Be careful out there!
Full disclosure: long SSO shares, long SSTI
*Charting notes: FreeStockCharts stock prices are not adjusted for dividends. TradingView.com charts for currencies use Tokyo time as the start of the forex trading day. FreeStockCharts currency charts are based on Eastern U.S. time to define the trading day.