Stock Market Statistics
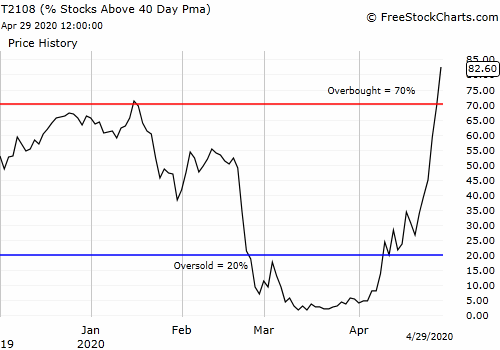
AT40 = 82.6% of stocks are trading above their respective 40-day moving averages (DMAs) (first oversold day)
AT200 = 17.7% of stocks are trading above their respective 200DMAs
VIX = 31.2
Short-term Trading Call: neutral
Stock Market Commentary
On Tuesday, AT40 (T2108), the percentage of stocks trading above their respective 40-day moving averages (DMAs), rallied right to the 70% threshold that defines overbought trading conditions. Today, AT40 smashed through the threshold and closed deep into overbought territory. It was a statement day fit for a Federal Reserve meeting affirming a strong commitment to doing what it takes to support the U.S. economy through the coronavirus pandemic. From Fed Chair Powell’s opening statement (emphasis mine):
“…by serving as a backstop to key credit markets, the programs can improve market functioning by increasing the willingness of private
lenders to extend credit. Many of these programs rely on emergency lending powers that are available only in very unusual circumstances, such as those we find ourselves in today. We are deploying these lending powers to an unprecedented extent, enabled in large part by the financial backing and support from Congress and the Treasury. We will continue to use these powers forcefully, proactively, and aggressively until we are confident that we are solidly on the road to recovery.”
The Stock Market Indices
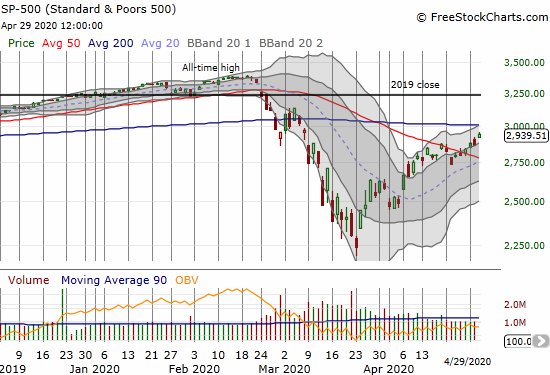
The S&P 500 (SPY) continued to melt up with a 2.7% gain. Overhead resistance at the 200DMA is now in play.
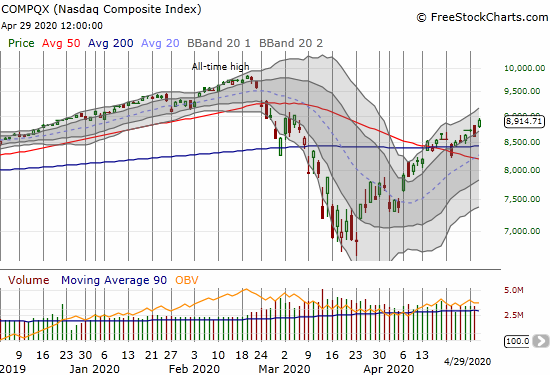
The NASDAQ (COMPQX) is melting upward faster than the S&P 500. The NASDAQ effectively finished reversing its losses from March. The tech-laden index picked a perfect day for such a major milestone. Now in play is reversing all the losses from the 50DMA breakdown that officially marked the beginning of the market’s crash.
Volatility
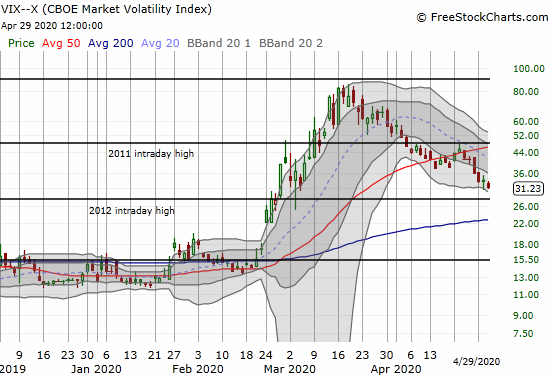
The volatility index (VIX) is back in downtrending mode. The VIX lost another 7.0% and has reversed its gains from March.
Overbought

This is the stock market’s first day in overbought territory. Typically, traders think of overbought as a bearish trading condition. Based on the AT40 trading rules, trading conditions do not turn bearish until AT40 falls OUT of overbought conditions (the other bearish condition is a rejection from the overbought threshold). I put this rule in place after realizing (and accepting) that the market can sustain overbought conditions for quite some time. In fact, the stock market can sustain overbought conditions, which feed on hope and faith, much longer than oversold conditions, which prey on fears and sometimes panic.
The Short-Term Trading Call
As a reminder, the major indices are in bullish positions with their 50DMA breakouts. I am not bullish because AT40 is now overbought. Although a drop from overbought conditions is typically a bearish event, I will not flip bearish until BOTH the S&P 500 and the NASDAQ suffer 50DMA breakouts along with the end of overbought conditions. These rules should prevent me from trying to short or load up on put options prematurely. The neutral short-term trading call keeps my mind open to select bullish setups as I wait to see how overbought conditions get resolved.
With AT40 so high, its day-to-day moves are no longer meaningful. Even the pullback in AT40 that I expect may not mean much. Instead, the duration of the oversold period is the critical metric. AT200, the percentage of stocks trading above their respective 200DMAs, is more important than AT40 here. AT200 is only at 17.7%. Just like a low AT40 suggests the stock market is reaching a bottom, a persistently low AT200 suggests that buyers might enjoy a lot of upside potential before the rally ends. AT200 was at 50.9% at the end of January, a time when I was bearish on the stock market.
Stock Chart Reviews – Below the 50DMA
Dine Brands Global Inc. (DIN)
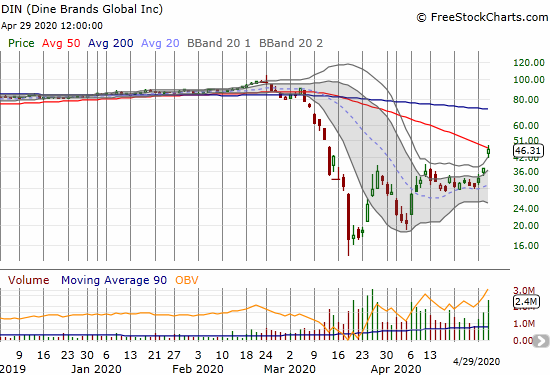
Dine Brands Global Inc. (DIN) jumped 23.7% likely in sympathy to earnings from Brinker International (EAT). DIN closed right at 50DMA resistance although this breakout looks bullish anyway. I took profits at the last rally, so I am unfortunately watching from the sidelines waiting to see a confirmed breakout.
Stock Chart Reviews – Above the 50DMA
Alibaba Group Holding Ltd (BABA)
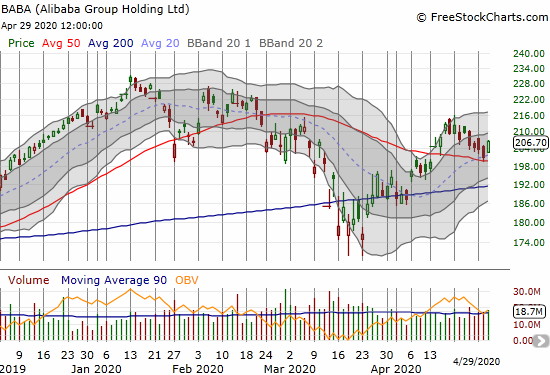
Alibaba Group Holding Ltd (BABA) has drifted downward slowly for 2 weeks. The stock gently tested 50DMA support before today’s 2.8% gain. I bought a call option betting that 50DMA support will continue to hold.
Brinker International (EAT)
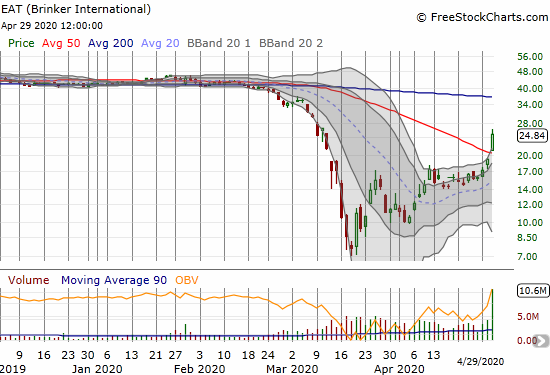
Brinker International (EAT) jumped 29.8% post-earnings and made a bullish 50DMA breakout. I am now watching for a retest of 50DMA support.
Red Robin Gourmet (RRGB)
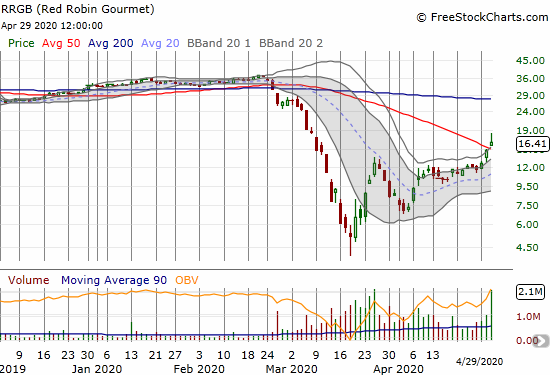
Red Robin Gourmet (RRGB) followed the casual dining sympathy train led by Brinker. RRGB is one of the few stocks I accumulated aggressively all the way to the bottom. I also held throughout this ride back to overbought conditions. While I originally thought RRGB could get back into the low to mid-20s before this cycle ended, I decided to take profits here.
F5 Networks Inc (FFIV)
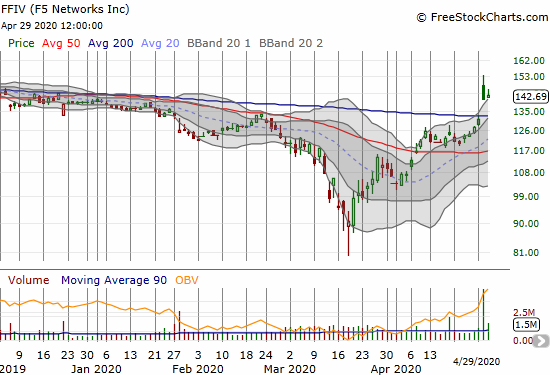
F5 Networks Inc (FFIV) made a bullish 200DMA breakout the day before in the wake of earnings. This is another stock on my list to buy on a dip back to support. The stock is still trading at its high point of the year.
Blue Apron Holdings Inc (APRN)
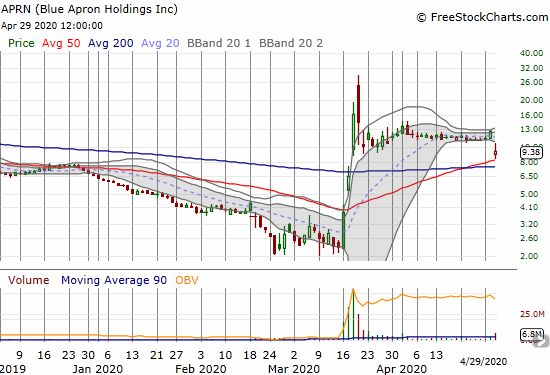
I wrote skeptically about Blue Apron Holdings Inc (APRN) when the stock surged on a 200DMA breakout as speculators turned APRN into a coronavirus play. The stock went higher one more day before fading. APRN drifted from there until earnings delivered a hard dose of reality and a 25.3% loss. APRN is at least holding 50DMA support for now.
Home Depot (HD)
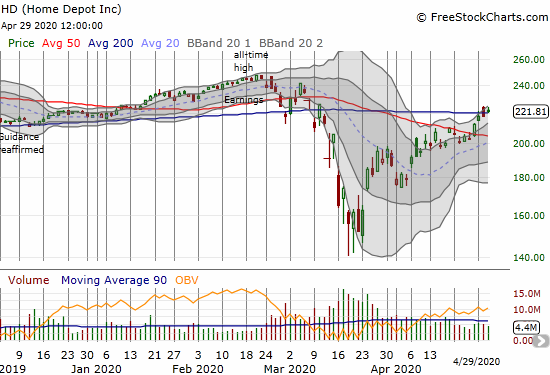
Home Depot (HD) has gained 10% since last week. HD punched through 50 and 200DMA resistance along the way. HD was last this high on March 10th.
Lowe’s Companies Inc (LOW)
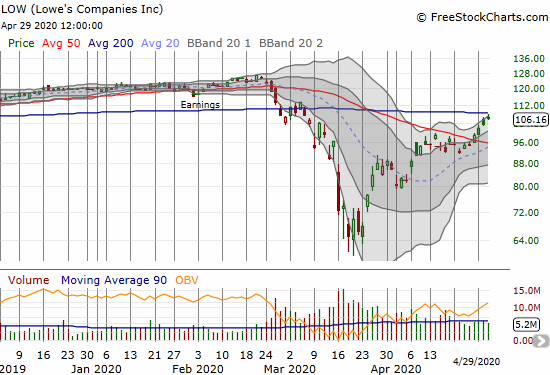
Lowe’s Companies Inc (LOW) has rallied right into 200DMA resistance. I still have LOW on the buy list for the next dip, this time to 50DMA support.
Best Buy Co Inc (BBY)
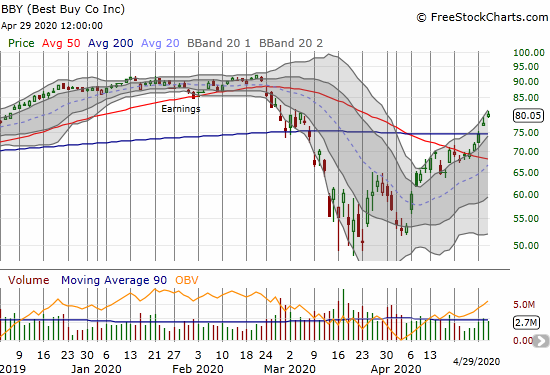
Best Buy Co Inc (BBY) gained 3.2% and closed at its March high. I bought call options on the 200DMA breakout. I am looking to take profits this week.
Spotify Technology (SPOT)
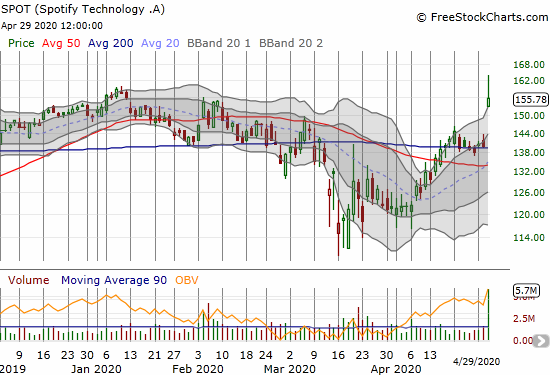
Raymond James downgraded Spotify Technology (SPOT) on April 6th. The thesis was based on lowered interest in streaming music while sheltering in place; video streaming takes over. The stock rallied hard anyway, and I should have taken note since, for me, my music streaming has soared relative to video streaming during this time. That contrary move turned out to be a sign of even bigger things to come. SPOT was up as much as 17.3% before settling for an 11.5% post-earnings gain.
Target Corporation (TGT)
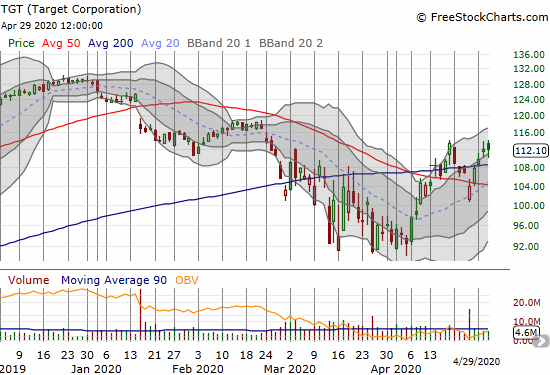
Target Corporation (TGT) is still not where I thought it would be in the wake of government support checks going out to people and businesses across the country. Still, the technicals look good with another 200DMA breakout.
Wayfair (W)
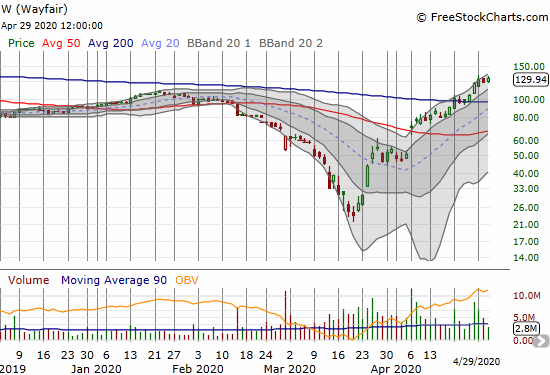
Wayfair (W) has been one of the strongest rebound plays…that I have just watched and watched. Wayfair’s stock is up an incredible 452.4% from the March lows. Wayfair is even at a 7-month high now.
Whirlpool Corp (WHR)
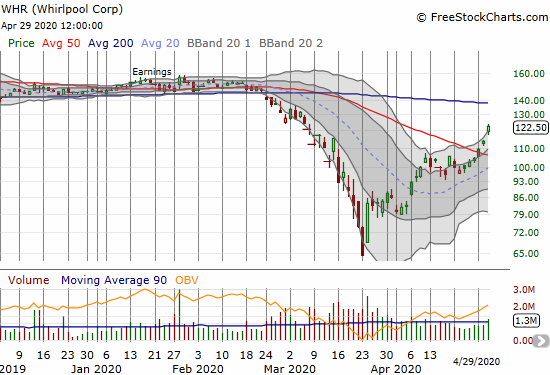
Whirlpool Corp (WHR) soared 7.6% and further confirmed a 50DMA breakout. I missed the previous day’s confirmation as I was too focused on considering puts as a hedge for longs.
SPDR S&P Retail ETF (XRT)
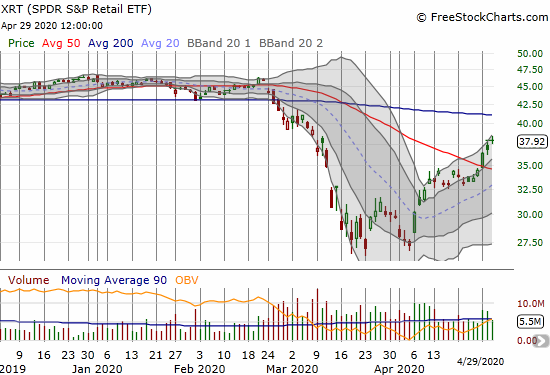
I did not miss the 50DMA breakout for SPDR S&P Retail ETF (XRT). I bought shares the previous day. I plan to sit on these as I now focus on buying dips in individual consumer discretionary plays.
Zillow Group (ZG)
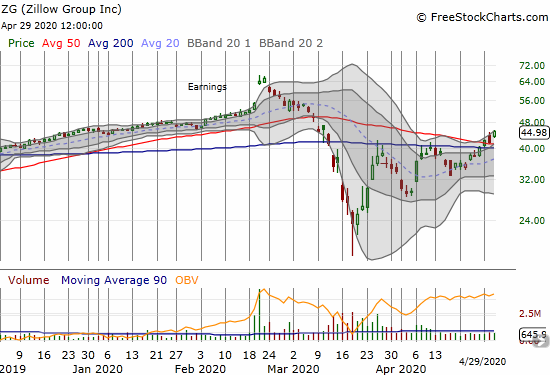
Zillow Group (ZG) is following the new bullish mood in housing-related stocks. ZG printed a very bullish 50 and 200DMA breakout. ZG is a buy with a hard stop below the 200DMA.
— – —
FOLLOW Dr. Duru’s commentary on financial markets via email, StockTwits, Twitter, and even Instagram!
“Above the 40” uses the percentage of stocks trading above their respective 40-day moving averages (DMAs) to assess the technical health of the stock market and to identify extremes in market sentiment that are likely to reverse. Abbreviated as AT40, Above the 40 is an alternative label for “T2108” which was created by Worden. Learn more about T2108 on my T2108 Resource Page. AT200, or T2107, measures the percentage of stocks trading above their respective 200DMAs.
Active AT40 (T2108) periods: Day #12 over 20%, Day #6 over 30%, Day #4 over 40%, Day #3 over 50%, Day #2 over 60%, Day #1 over 70% (first day overbought, ending 69 days under 70%)
Daily AT40 (T2108)

Black line: AT40 (T2108) (% measured on the right)
Red line: Overbought threshold (70%); Blue line: Oversold threshold (20%)
Weekly AT40 (T2108)

*All charts created using FreeStockCharts unless otherwise stated
The T2108 charts above are my LATEST updates independent of the date of this given AT40 post. For my latest AT40 post click here.
Be careful out there!
Full disclosure: long SSO shares, long BBY calls, long BABA calls, long TGT, long XRT
*Charting notes: FreeStockCharts stock prices are not adjusted for dividends. TradingView.com charts for currencies use Tokyo time as the start of the forex trading day. FreeStockCharts currency charts are based on Eastern U.S. time to define the trading day.

