
Stock Market Statistics
AT40 = 69.6% of stocks are trading above their respective 40-day moving averages (DMAs) 3+ month high
AT200 = 14.8% of stocks are trading above their respective 200DMAs
VIX = 33.6
Short-term Trading Call: neutral
Stock Market Commentary
The stakes are ever higher. Right alongside confirmations of major breakouts from the major stock indices, AT40 (T2108), the percentage of stocks trading above their respective 40-day moving averages (DMAs), rushed toward overbought levels. Is this finally a topping process for the stock market or will stocks continue to catch up and ride along the bullish breakouts of the major indices?
The Stock Market Indices
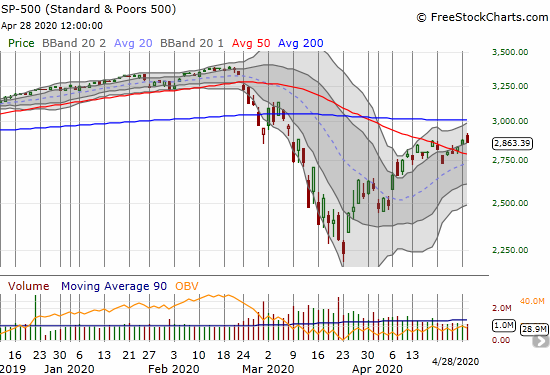
The S&P 500 (SPY) lost 0.5% after trading as high as a 1.5% gain. The fade took the index back to the bottom of its upper Bollinger Band (BB) and under the “double top” formed by the twin rebound highs. The previous day, the S&P 500 bullishly confirmed a 50DMA breakout.
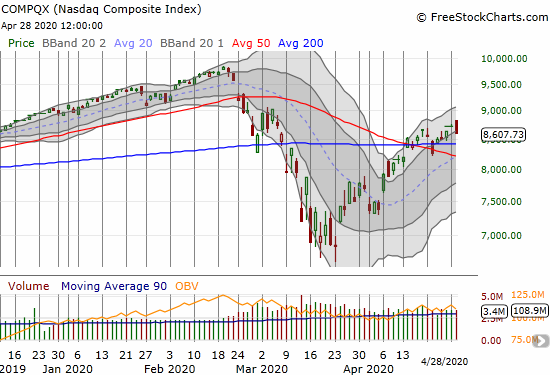
The NASDAQ (COMPQX) lost 1.4% after gapping higher. Like the S&P 500, the tech-laden index closed at the bottom of its upper-BB channel. The NASDAQ reconfirmed both a 50 and 200DMA breakout last Friday. The NASDAQ remains in a very bullish position.
Volatility
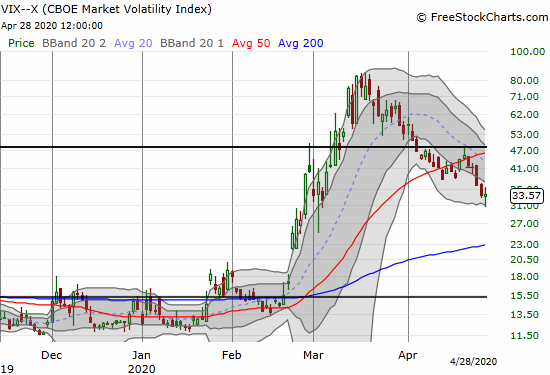
The volatility index (VIX) bounced off a 2-month low to close flat on the day. While the VIX is back in the middle of its downtrend from the March highs, it now looks poised to try for another break from the downtrend.
Overbought (Almost!)

My favorite technical indicator has made a heroic move off the March lows. After languishing for what seemed like an eternity in single digits, AT40 spent much of April soaring. The move to the threshold of overbought trading conditions, where 70% of stocks are trading above their respective 40DMAs, looks parabolic.
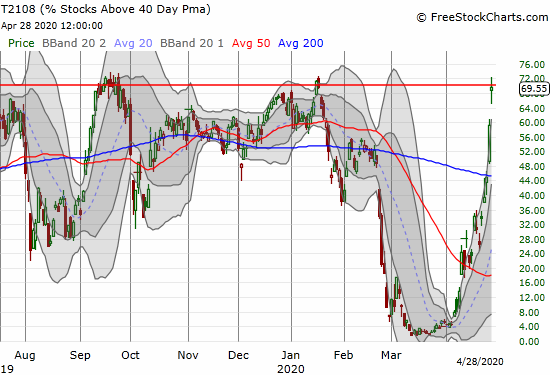
The rush of this move increases the odds that AT40 will suffer a notable setback in coming days. So if AT40 somehow manages to push higher, I will be bracing for one of those historic, extended overbought periods.
The Short-Term Trading Call
The major indices are in bullish positions even with the S&P 500 (SPY) yet to break out above its 200DMA resistance. AT40 is providing a counterpoint with its rush to the overbought threshold. By rule, I switched my trading call to neutral and came off my cautiously bullish stance. AT40 is close enough to the 70% overbought threshold, and there is no reason for me to wait to flip my trading call given my buying interest is now focused on looking for dips. Still, given the bullish positioning of the major indices, I have absolutely no reason to or interest in shorting the market at these levels. A switch to a bearish short-term trading call will require at least a 50DMA breakdown from the S&P 500. Even then, I would be reluctant to switch until/unless the NASDAQ followed up with its own breakdown.
Stock Chart Reviews – Below the 50DMA
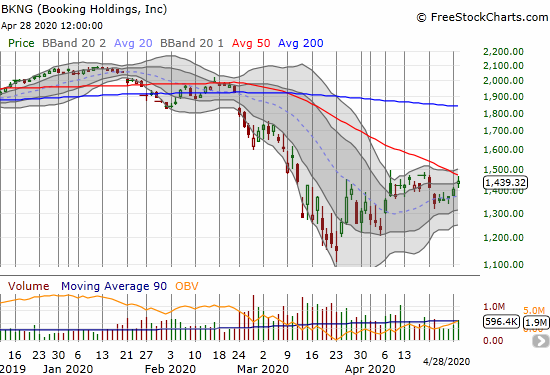
Booking Holdings (BKNG)
Booking Holdings (BKNG) has been drifting for most of this month, reluctant to give its 50DMA a good push and challenge. The declining 50DMA is now forcing the issue. I am watching closely to see whether BKNG can join the ranks of stocks making bullish breakouts above major downtrend lines.
Stock Chart Reviews – Above the 50DMA
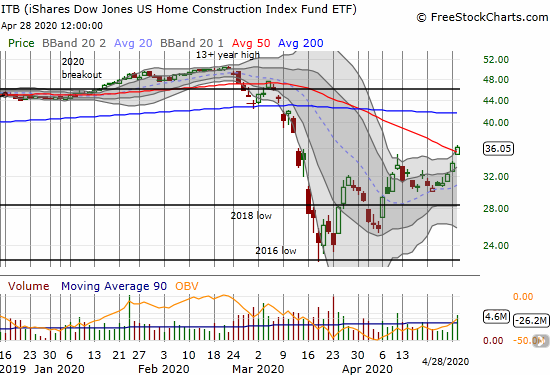
iShares Dow Jones U.S. Home Construction ETF (ITB)
Suddenly, home builders are reporting great news and soaring post-earnings. The results have pushed the iShares Dow Jones U.S. Home Construction ETF (ITB) into a 50DMA breakout. I certainly did not expect such a move for many weeks, perhaps months to come. I am scrambling to read all the earnings reports from builders to cobble together a mosaic of this apparent swing in sentiment. It was just two weeks ago when an historic plunge in home builder sentiment suggested lasting doldrums. Perhaps there is a great divide between the public and the private builders!?
— – —
FOLLOW Dr. Duru’s commentary on financial markets via email, StockTwits, Twitter, and even Instagram!
“Above the 40” uses the percentage of stocks trading above their respective 40-day moving averages (DMAs) to assess the technical health of the stock market and to identify extremes in market sentiment that are likely to reverse. Abbreviated as AT40, Above the 40 is an alternative label for “T2108” which was created by Worden. Learn more about T2108 on my T2108 Resource Page. AT200, or T2107, measures the percentage of stocks trading above their respective 200DMAs.
Active AT40 (T2108) periods: Day #11 over 20%, Day #5 over 30%, Day #3 over 40% (overperiod), Day #2 over 50%, Day #1 over 60% (overperiod ending 64 days under 60%), Day #69 under 70%
Daily AT40 (T2108)
")
Black line: AT40 (T2108) (% measured on the right)
Red line: Overbought threshold (70%); Blue line: Oversold threshold (20%)
Weekly AT40 (T2108)

*All charts created using FreeStockCharts unless otherwise stated
The T2108 charts above are my LATEST updates independent of the date of this given AT40 post. For my latest AT40 post click here.
Be careful out there!
Full disclosure: long SSO shares, long ITB
*Charting notes: FreeStockCharts stock prices are not adjusted for dividends. TradingView.com charts for currencies use Tokyo time as the start of the forex trading day. FreeStockCharts currency charts are based on Eastern U.S. time to define the trading day.