
Historic Bearishness In Apple
Bloomberg published an article on July 8th titled “Wall Street Hasn’t Been This Pessimistic on Apple in Decades.” Out of 57 analyst ratings, 5 were outright sells on AAPL. Amazingly, AAPL has not attracted this many bears since at least 1997.
Of course, 10% of analysts is a small fraction and hardly a reason for excitement. The consensus analyst rating of 3.76 was more intriguing: that rating sat at its lowest level since 2004. Extremes always get me thinking about the potential for a reversal. In this case, I am inclined to look for excuses to get bullish on Apple’s July earnings report. Indeed, even though AAPL’s rebound from the May sell-off failed to generate an all-time high alongside the S&P 500 (SPY) and the NASDAQ (COMPQX), the stock hardly looks preoccupied with bearish analyst opinion. AAPL is up 28% year-to-date vs the NASDAQ’s 23% run-up this year.
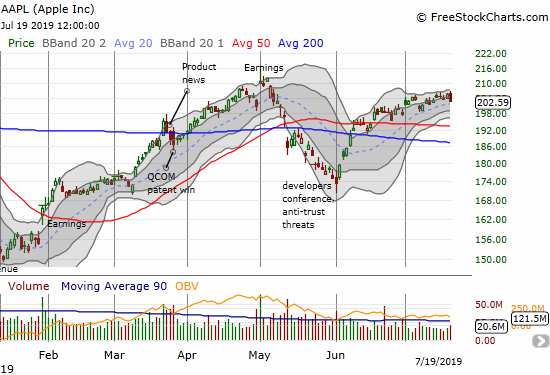
So even with AAPL churning ever so tentatively below its high of the year, the stock’s resilience against so many headwinds makes me inclined to look for excuses to play earnings on July 30th from the bullish camp.
Apple Stands Out Among Big Cap Tech
The post-earnings drubbing for Netflix (NFLX) gave me my final catalyst to construct a bullish pre-earnings trade. The 10.3% post-earnings loss in NFLX was accompanied by selling across all of “FANG”: Facebook (FB) dropped 0.5%, Amazon (AMZN) pulled back 0.7% after an impressive bounce off support at its 20-day moving average (DMA), and Alphabet (GOOG) barely closed flat after its own rebound from as much as a 1% loss. Apple outdid all of FANG by opening with a small gap up at the open and a 1.1% gain at the close, right at its high of the day. The NASDAQ (COMPQX) gapped down at the open and closed with a 0.3% gain.
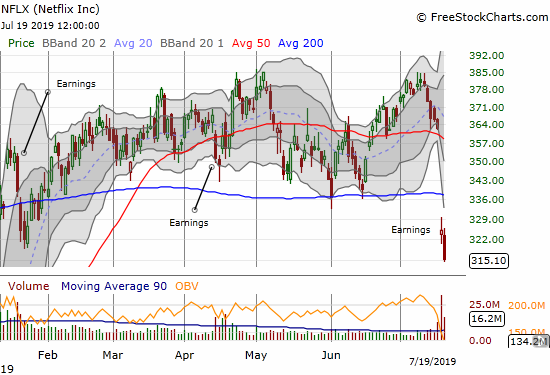
The tables turned on Friday with AAPL performing worse than FANG except NFLX. AAPL lost 1.5% on the day while FB lost 1.2%, AMZN dropped 0.7%, NFLX pulled back another 3.1%, and GOOG wilted 1.4%. Despite the setback, I stuck to the bullish plan.
The Bullish Bias for Apple Earnings
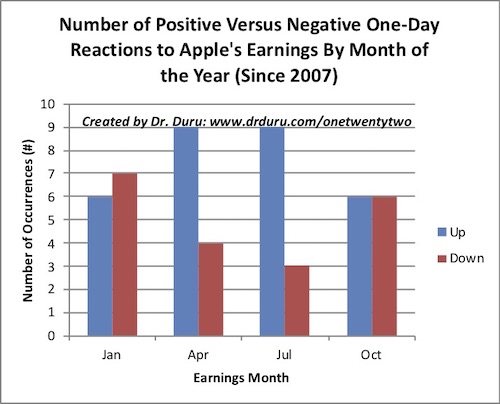
AAPL’s resilience was in full display after the stock’s stellar recovery from the major earnings warning that started the year. Moreover, July (or more specifically the Q3 fiscal earnings report) happens to be Apple’s most bullish time for the post-earnings trade when measured from the previous day’s close. Since 2007, AAPL is up 9 times versus down 3 times the day after reporting Q3 earnings. April is right behind July with one more negative reaction. (Source for price data is Yahoo Finance; source for earnings dates is Briefing.com).
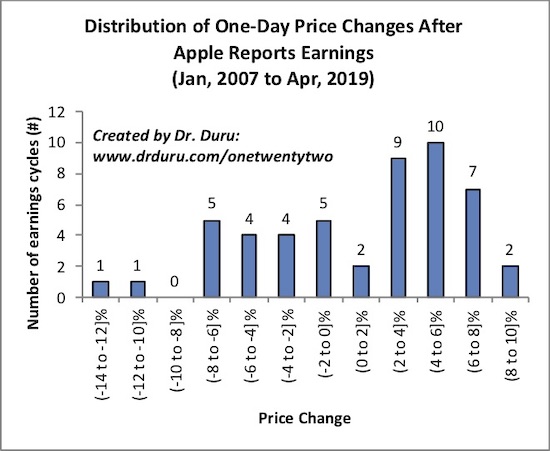
The bullish bias in AAPL earnings can also be seen in a histogram showing the distribution of post-earnings reactions.
The Apple Pre-Earnings Trade
The data suggest waiting until the day of earnings to make a trade. However, with a dovish Federal Reserve on deck in the coming week, I did not want to wait until the day of earnings to make a trade. I went to the options market to help me create a strategy.
At the July 18th close of $205.66, the options market priced in about a 10 point move up or down in Apple (AAPL) at the August 2nd expiration. That date is the first options expiration after earnings. As of Friday’s close at $202.29, the options market is still projecting a 10-point swing, a 5% move. So the theoretical upside potential moved from a little over $215 to a little over $212. I built my trade with the higher priced scenario in mind.
Given AAPL has churned mightily for about a month now, I expect more churn ahead. This projection suggests using a calendar call spread to reduce the cost and risk of a pre-earnings trade. With the higher price scenario in mind, I bought the July 26/Aug 2 $210 calendar call spread. The short July 26th calls are likely to expire worthless and help me pay for the long August 2nd calls. The tremendous skew driven by earnings is shown in the wide price disparity between the July 26 $210 call at $0.57/$0.60 and the August 2 $210 call at $2.89/$3.05 (Thursday’s closing prices). At a cost of $2.40 and a $215 projected post-earnings price for AAPL, the calendar call spread had the potential for a double.
Even with my bullishness, I added an August 2nd $200/190 put spread as a hedge given the long wait until earnings. Also, if AAPL earnings fail to deliver to the upside, I am guessing the stock will suffer a major (and rare) pullback to at least support at the stock’s 50-day moving average (DMA).
With AAPL dropping to $202.59 to close the week, I am considering doubling down on this trade using the $207.50 strike for the calendar call spread. The options market is still projecting a 10-point swing at August 2nd and now the odds look high for the July 26 $207.50 call to expire worthless. I will not add to the hedging put spread.
The pricing for a 5% post-earnings price change is well above the median and average post-earnings one-day price changes for AAPL. Since 2007, the median = +2.6% and the average = +1.1%. Since 2014, the median = +2.7% and the average = +1.1%. The frequency of big price moves is about 50/50. Since 2014, AAPL has reported 22 times. Six of those times delivered 5% gains or higher (rounding up), and 4 times 5% losses or worse. So 45% of the time (10 of 22), AAPL hit a 5% post-earnings price change. This trading history means AAPL’s earnings options carry a hefty premium. This premium makes a strategy that includes selling premium back to the market even more attractive.
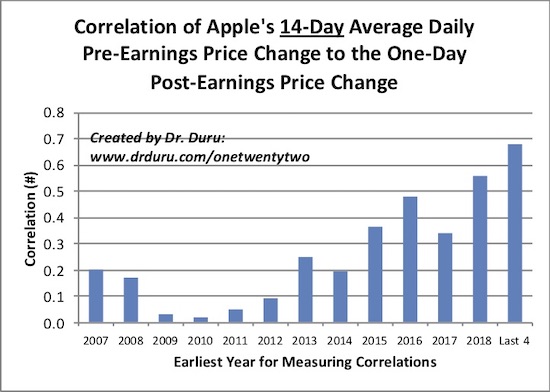
As earnings approach, I will be monitoring some other interesting patterns for AAPL’s earnings price reactions. The most interesting relationship is the correlation between the average price change over the 14 trading days preceding earnings and the first day’s post-earnings move. Over the years, the correlation has grown stronger and stronger.
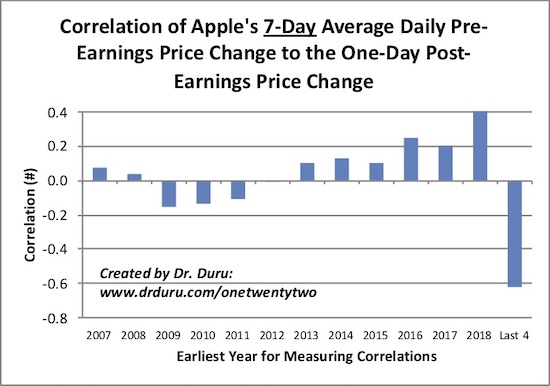
Until the last 4 earnings announcements, the window for 7 trading days has had almost no relationship. Over the last 4 earnings announcements, a notably negative correlation has appeared.
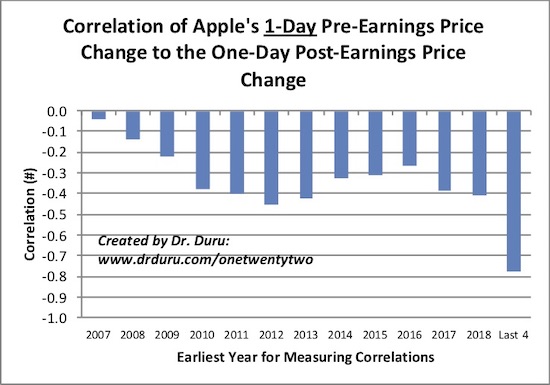
The price change the day before earnings has a negative correlation. Like the 7-day correlation, the 1-day correlation grew significantly stronger the last 4 earnings cycles.
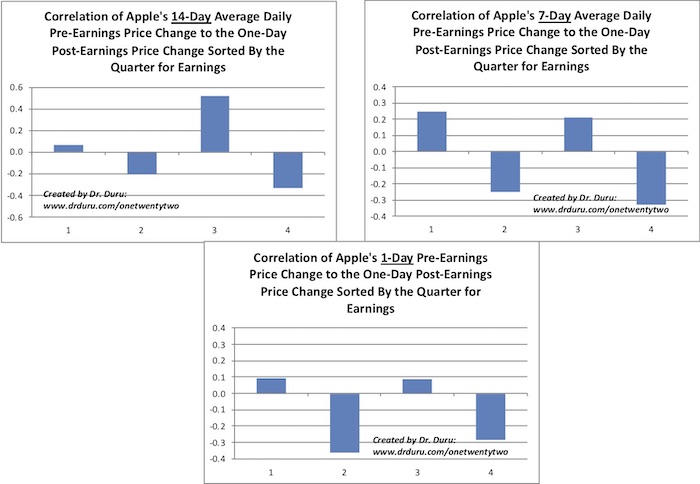
These are the strongest correlations AAPL has for earnings, and they could motivate me to adjust my positioning just ahead of earnings. Interestingly, no patterns exist when looking at the trading windows from a seasonal (quarterly) perspective.
Scenario Planning
For my ideal scenario, AAPL continues to churn in the coming week and rallies into earnings the following week. Such a move would allow me to take profits without holding through the risk of earnings. There is also a small chance I take profits in the coming week if AAPL enjoys an early pre-earnings and Fed-driven rally short of a major breakout. The worst case scenario features AAPL churning along right through earnings. Both sides of my position would expire (near) worthless in this scenario.
Be careful out there!
Full disclosure: long AAPL calendar call spread, AAPL put spread