
AT40 = 16.1% of stocks are trading above their respective 40-day moving averages (DMAs) (as high as 19.95%) – 11th day of oversold period following 4-day oversold period
AT200 = 29.6% of stocks are trading above their respective 200DMAs
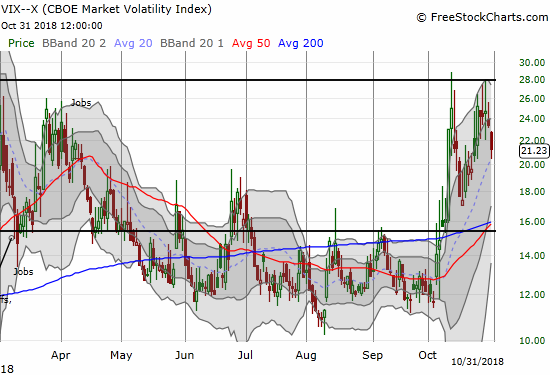
VIX = 21.2
Short-term Trading Call: bullish
Commentary
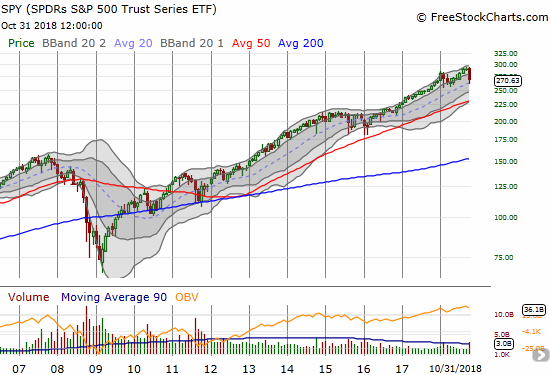
The push out of oversold conditions did not happen today as I had hoped. The rally looked strong enough to accomplish the feat, but AT40 (T2108), the percentage of stocks trading above their respective 40-day moving averages (DMAs), actually declined slightly from 17.3% to 16.1%. The S&P 500 (SPY) gained 1.1% after fading sharply from its intraday high. The bearish divergence between AT40 and the S&P 500 happened right on the heels of a confirmation of BULLISH divergence. On the bullish side, the S&P 500 cleanly broke out from its primary downtrend defined by the downward-trending lower Bollinger Bands (BBs). Also, AT200 (T2107), the percentage of stocks trading above their respective 40DMAs, managed to just barely avoid a negative close.

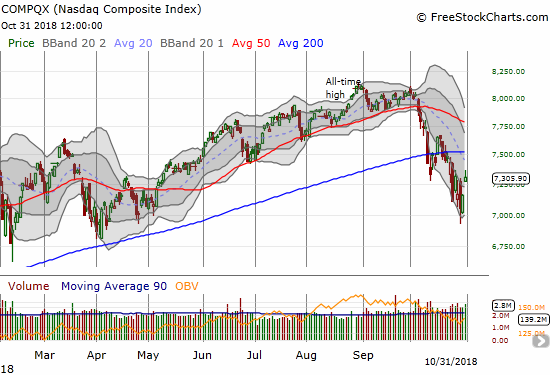
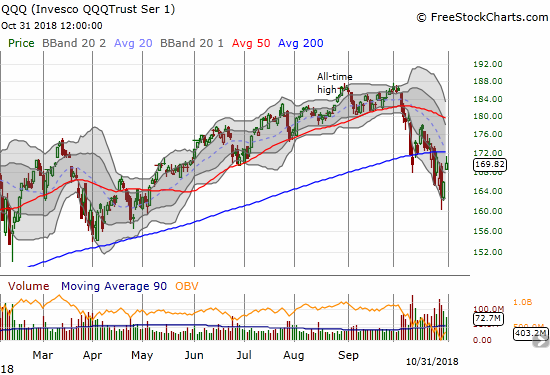
The tech-laden indices had a little more bullish price action than the S&P 500. The NASDAQ gained 2.0% on a bullish gap up that cleared the intraday high of the previous day. The Invesco QQQ Trust (QQQ) did not gap high enough to clear the intraday high of the previous day, but it did close above that hurdle. The QQQ intraday high even approached 200DMA resistance.
The volatility index, the VIX, fell 9.1% and closed at 21.2. It is still at elevated levels (above 20) so the stock market remains very vulnerable to wide swings and sharp selling, but at least the primary uptrend broke down today.
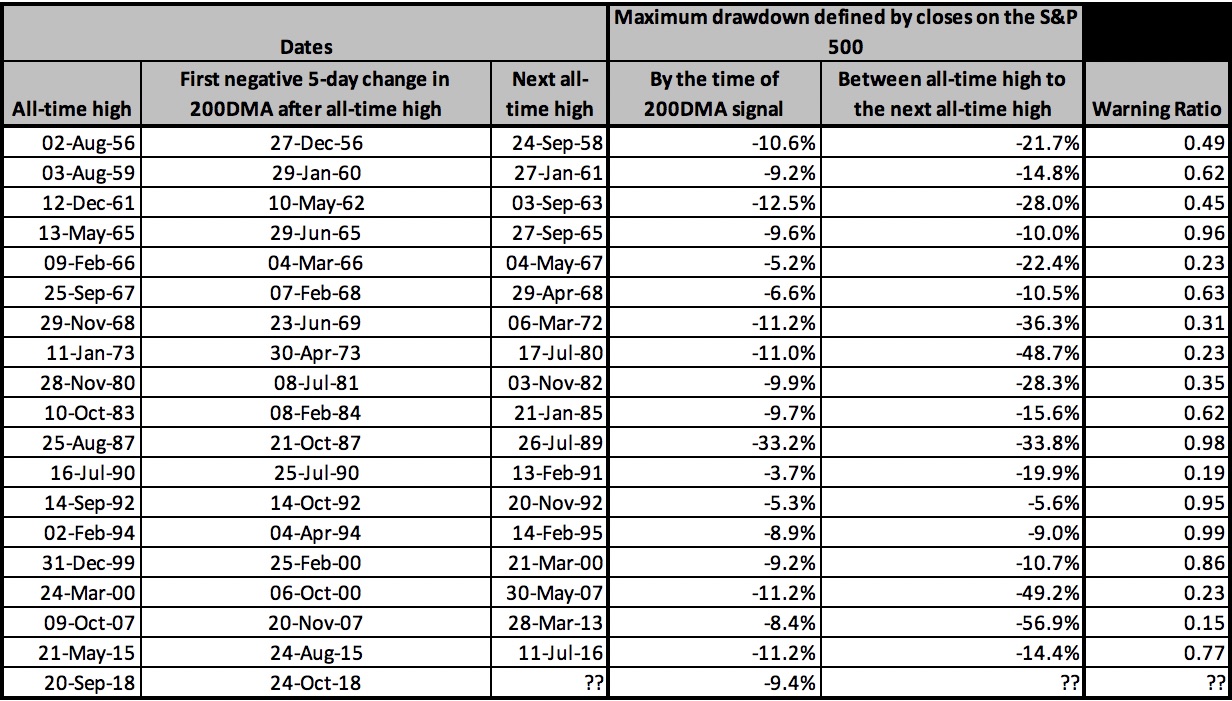
The bearish divergence with AT40 is coming at a critical time with nascent trend breakouts, looming 200DMA resistance, and a U.S. jobs report on Friday. This is also the 6th straight day of a decline for the 200DMA on the S&P 500. In my earlier discussion of my “200DMA Signal” model, I erroneously focused on the number of days of the decline in the S&P 500’s 200DMA after an all-time high. Instead, the trigger is the FIRST day the 200DMA declines after an all-time high (ironically enough, clearly labeled on the table below!). Below I produce an updated table with values I could have provided last week. Note well that the day the 200DMA Signal triggered, the S&P 500 was down 9.4% from its closing all-time high. Thus, the index just missed crossing into the negative 10 to 13% range which in the past flagged the beginning of a much larger sell-off. The lone exception was the last time the 200DMA Signal triggered.
This was a day to mainly focus discipline on holding my long positions and looking for more buying opportunities from the shopping list. I had no hedges to close out. I managed to flip call options on Baidu (BIDU) (finally). I took advantage of the late day fade to buy more call options on Intel (INTC). I took advantage of a large 1-day reversal in Walmart (WMT) to snatch a few call options. Somehow, my limit buy orders for Logitech (LOGI) and ProShares Ultra S&P500 (SSO) did not trigger. I want to start building a position in SSO position as part of a portfolio of oversold trades that I will accumulate in weakness and hold through, presumably, the end of the year at a minimum. I expect the churn and pivots around 200DMA resistance will provide plenty of “moments of truth.”
CHART REVIEWS
Facebook (FB)
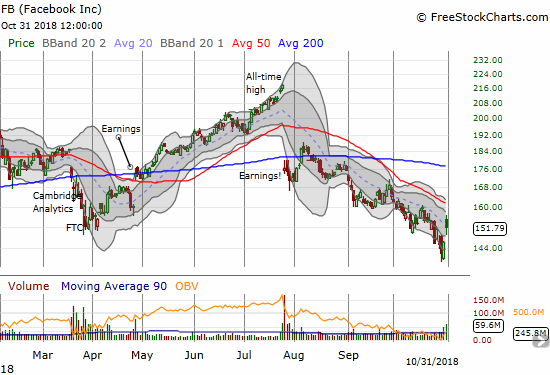
The pre-earnings Facebook trade worked out just as intended. The (options) market was mispricing the odds for the immediate price change in the wake of earnings. Facebook raced out the gate by gapping up and trading up over 6% at one point, but the stock eventually faded with the market and settled for a 3.8% gain. The stock even failed to conquer its downtrending 20DMA. So, I fully expect FB to churn for a while before resuming a climb higher with the downtrending 50DMA as my ultimate target.
Taylor Morrison Home Corporation (TMHC)
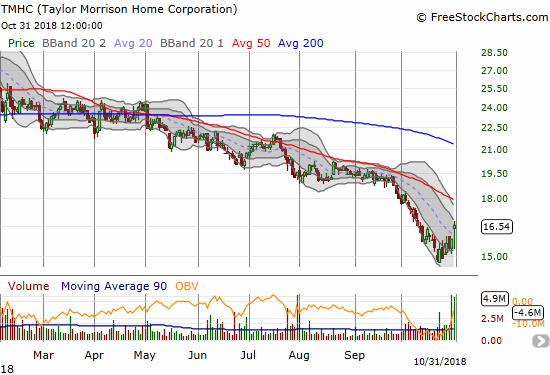
Once again, a home builder received a positive response to earnings. I am taking note. TMHC gained 4.6% post-earnings and even closed above its downtrending 20DMA. As with most home builder stocks, a steeply declining 50DMA will likely provide very stiff resistance in coming weeks.
Pulte Home (PHM)
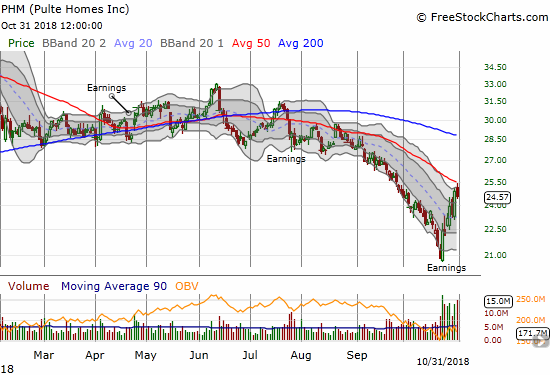
The post-earnings run-up in PHM has already taken the stock to a rendezvous with its steeply declining 50DMA resistance. Surprise, surprise, the stock was soundly (and neatly) rejected from this resistance. PHM is at the top of my list to play the period of seasonal strength for the home builders, so I am looking forward to dips from here.
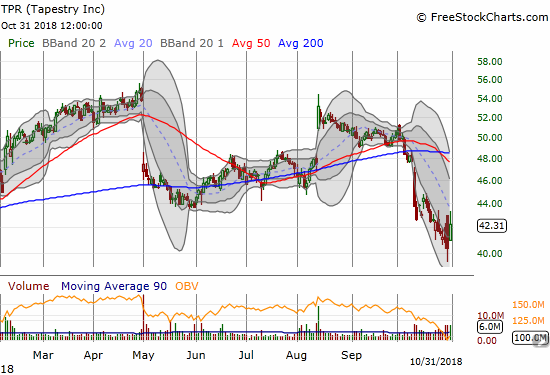
Tapestry (TPR)
TPR caught my eye as a retailer with potential to bounce back from post-earnings trauma. The stock tends to rebound from such calamities…like the last two post-earnings gap downs. I am looking for TPR to close above the previous day’s intraday high (rather than just trade above that high as the stock managed to do at one point during the day).
— – —
FOLLOW Dr. Duru’s commentary on financial markets via email, StockTwits, Twitter, and even Instagram!
“Above the 40” uses the percentage of stocks trading above their respective 40-day moving averages (DMAs) to assess the technical health of the stock market and to identify extremes in market sentiment that are likely to reverse. Abbreviated as AT40, Above the 40 is an alternative label for “T2108” which was created by Worden. Learn more about T2108 on my T2108 Resource Page. AT200, or T2107, measures the percentage of stocks trading above their respective 200DMAs.
Active AT40 (T2108) periods: Day #11 under 20% (oversold), Day #16 under 30%, Day #23 under 40%, Day #28 under 50%, Day #44 under 60%, Day #97 under 70%
Daily AT40 (T2108)
")
Black line: AT40 (T2108) (% measured on the right)
Red line: Overbought threshold (70%); Blue line: Oversold threshold (20%)
Weekly AT40 (T2108)

*All charts created using freestockcharts.com unless otherwise stated
The charts above are my LATEST updates independent of the date of this given AT40 post. For my latest AT40 post click here.
Related links:
The AT40 (T2108) Resource Page
You can follow real-time T2108 commentary on twitter using the #T2108 or #AT40 hashtags. T2108-related trades and other trades are occasionally posted on twitter using the #120trade hashtag.
Be careful out there!
Full disclosure: long UVXY puts, long FB calendar call spreads, other positions mentioned above.
*Charting notes: FreeStockCharts.com stock prices are not adjusted for dividends. TradingView.com charts for currencies use Tokyo time as the start of the forex trading day. FreeStockCharts.com currency charts are based on Eastern U.S. time to define the trading day.