
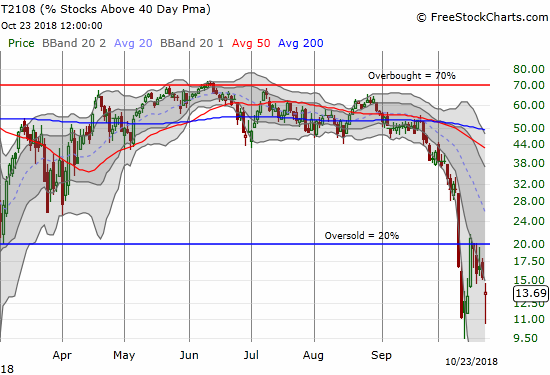
AT40 = 13.7% of stocks are trading above their respective 40-day moving averages (DMAs) – 5th day of oversold period following 4-day oversold period (as low as 10.6%)
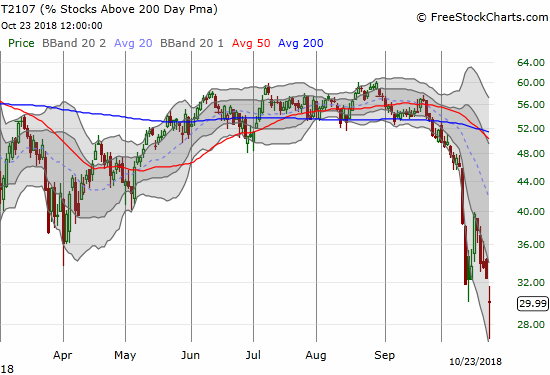
AT200 = 30.0% of stocks are trading above their respective 200DMAs (as low as 26.7%)
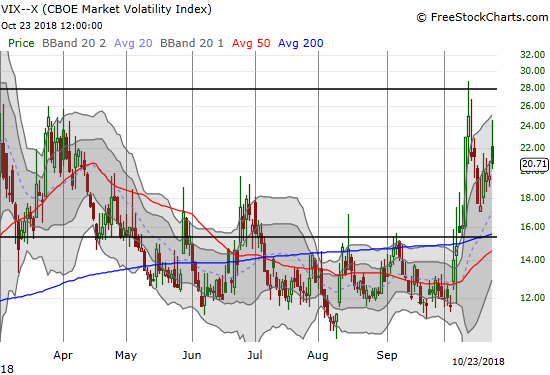
VIX = 20.7 (as high as 24.7)
Short-term Trading Call: bullish
Commentary
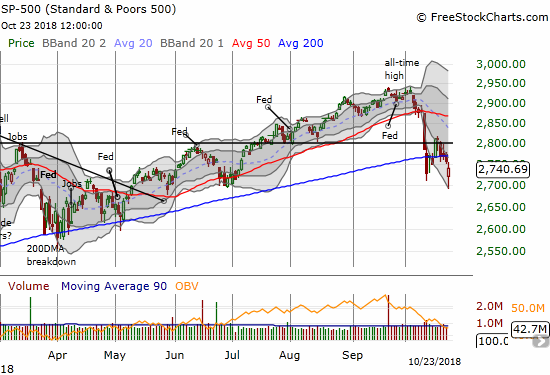
The stock market is at a second derivative moment. That is, the oversold period itself is becoming extreme. As I noted in my previous Above the 40 post, I am considering the one-day respite from oversold conditions to represent noise. So while the current oversold period is technically in its fifth day, I expect the market to behave as if it were oversold for 9 days. Per my previous discussion, this stretch means I expect the S&P 500 to generate a loss, as measured from the close of the first oversold period on October 10th, whenever the index exits this oversold period. The S&P 500 is just 1.6% below that point, so the index could be just one day’s worth of buying from exiting this oversold period.
AT40 (T2108), the percentage of stocks trading above their respective 40DMAs, closed at 13.7% after trading as low as 10.6%. The good news is that the intraday low stopped short of the intraday low of the previous oversold period. That higher low adds a shred of evidence that the current oversold period is coming to an end soon.
AT200 (T2107), the percentage of stocks trading above their respective 200DMAs, is a concern. This longer-term indicator traded as low as 26.7% before closing at 30.0%. AT200 was last this low during the vicious January, 2016 sell-off. AT200’s breakdown also sliced through the lows of the previous oversold period.
At these low levels, pretty much every portfolio and manager is looking at a collection of holdings that have largely broken down and punched below longer-term uptrends. The panicked managers and profit-preservers will sell. The “value” seekers will see bargain signs everywhere. This battle is key to interpreting the churn that likely still lays ahead. With AT40 so low, AT200 now becomes my key field report from the battlefield. I will also be looking for changes in the slopes of the 200DMAs on the major indices. Note that the S&P 500’s 200DMA is flattening out.
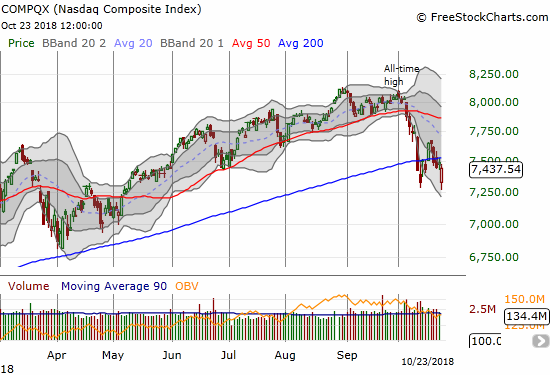
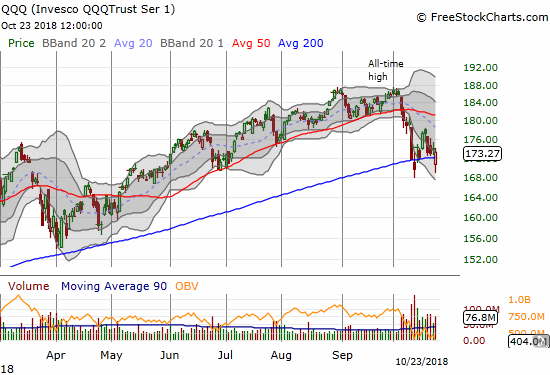
The NASDAQ still has a strong, uptrending 200DMA. The tech-laden index briefly broke to a new intraday low before rallying sharply to close with a 0.4% loss. The Invesco QQQ Trust (QQQ) did two better on the NASDAQ. The QQQ’s intraday low did not break the previous intraday low AND the ETF closed above its 200DMA. This rebound is short-term bullish; a lot of overhead resistance lies above.
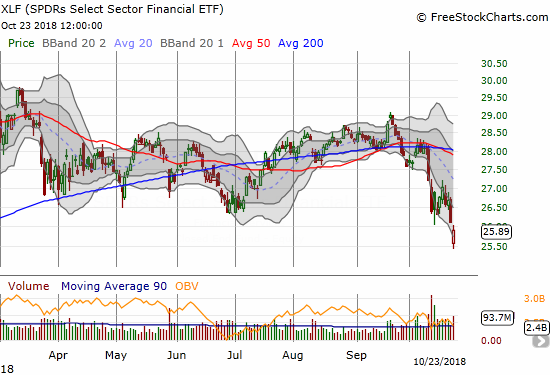
Financials suffered a bearish breakdown and did not recover. The Financial Select Sector SPDR ETF (XLF) gapped down and closed at a 13-month low. Buyers saved XLF from a worse loss, but the index now looks like a broken ETF. I still cannot imagine having healthy rallies going forward with weak and weakening financials.
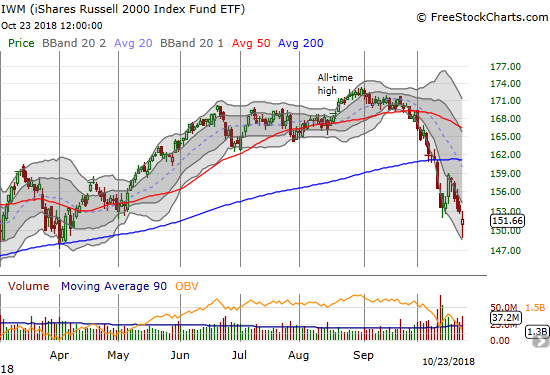
Like financials, small caps gapped down and formed a new low for this selling cycle. Also like XLF, the iShares Russell 2000 ETF (IWM) has a year-to-date loss, but it still has a ways to go to make new 2018 lows.
The volatility index, the VIX, managed to fall short of its intraday high for this selling cycle. That shortfall was quite surprising. It is possible to consider this fade to be a bullish event, but it could also indicate that market players are pre-maturely slowing down their rush for protection (put options on the S&P 500). Still, the fade of the VIX was strong enough to take it from a 18.0% gain all the way down to a mere 5.5% gain.
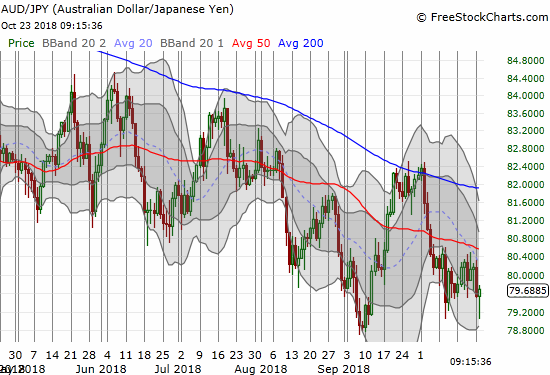
And then there is foreign exchange (the currency markets). The Australian dollar (FXA) versus the Japanese yen (FXY) was my key tell on the day for expecting a bounce back. AUD/JPY was just bouncing away from the previous low when I looked at it. The presumed support was too tempting to pass up. I did not go long AUD/JPY however. I am keeping my forex powder dry on that one for the next fade as a hedge.
With the S&P 500 breaking down to a new intraday low for this selling cycle and the VIX soaring (I assumed it would get to a new intraday high for this cycle), I went back to work with my oversold trading rules. I loaded up on SPY call options and bought a fresh tranche of ProShares Ultra VIX Short-Term Futures (UVXY) put options. The subsequent market rally delivered profits in both positions which I greedily locked in. I stayed put on (losing) positions from the last round of oversold trading. I am also slowly building a shopping list of stocks that have sold off post-earnings.
While my short-term trading call stays firmly on bullish, the on-going technical damage in the market is making me less optimistic about the sustainability of the next rally. Knowing that November and December are two of the stock market’s tamest months as measured by average and median drawdowns will likely be the main thing to keep me from flipping bearish for the rest of the year. I used the same analysis of drawdowns to create a 2681 downside target for the S&P 500 this month. The index hit 2691 at Tuesday’s intraday low…hopefully that was close enough.
CHART REVIEWS
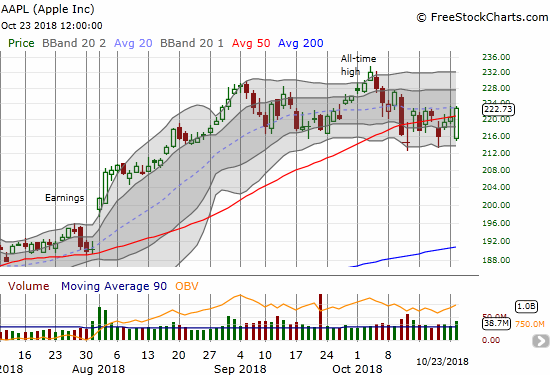
Apple (AAPL)
AAPL delivered impressive out-performance on the day. The stock bounced sharply off the lower reaches of its current consolidation range and managed to record a 0.9% gain with a fresh 50DMA breakout to boot.
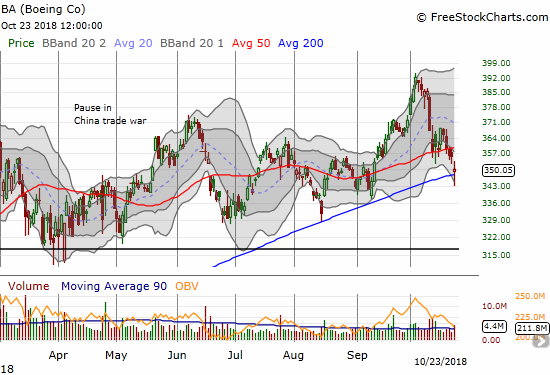
Boeing (BA)
BA reports earnings Wednesday morning. The stock flirted and pivoted around its 200DMA. When the stock first broke down, I decided to go ahead and use BA as a hedge and bought put spreads expiring Friday. BA is a critical stock because investors have given the company a huge “pass” because of an impressive backlog of orders. BA last closed below its 200DMA a little over two years ago!
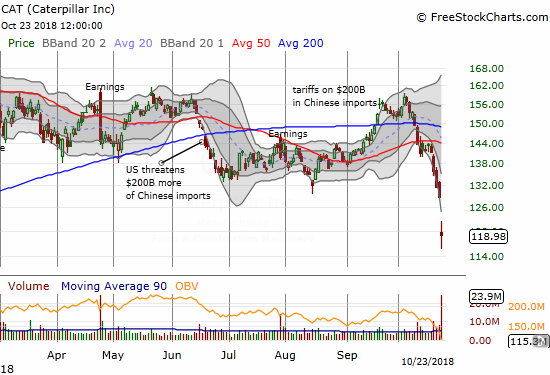
Caterpillar (CAT)
CAT delivered big-time as a hedge…but I sold my position into Thursday’s sell-off. While I appreciated the danger CAT presented, I completely under-estimated the range of possibilities. With Tuesday’s post-earnings 7.6% loss, CAT traded down another 12.4% from my selling point and was several percentage points lower before the stock bounced in obligatory fashion with the market.
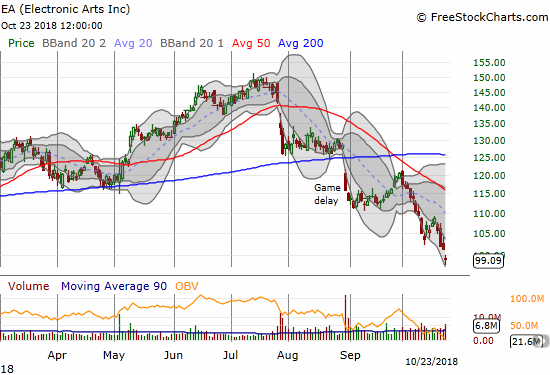
Electronic Arts (EA)
A sustained bounce from oversold conditions will not come in time to put some wind into the sails of EA.
I do not like selling in a panic, so I am still holding onto my pre-earnings position in EA. The stock’s failure to bounce back from its gap down suggests the downside risk has likely grown. I will likely buy a lower strike put expiring Friday to cap any additional losses and then look for the next opportunity to close out the entire trade.
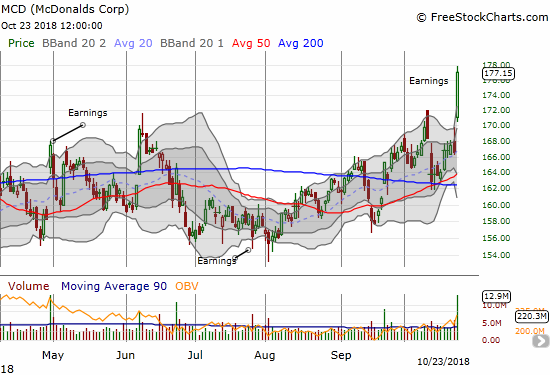
McDonalds (MCD)
MCD put on an even more impressive show of relative out-performance than AAPL. The tremendous pop in the stock likely shows some of the scramble of investors to rotate away from risk and more towards “safer” parts of the market.
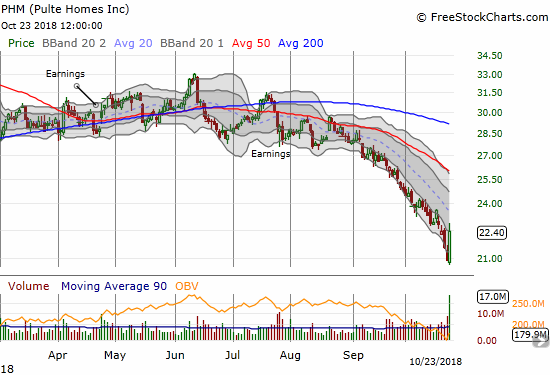
PulteGroup, Inc. (PHM)
After relentless selling in home builders, the investors left standing were finally willing to look for the good news in an earnings report. PHM just happened to be the lucky candidate. PHM delivered an impressive 7.3% gain after first gapping down at the open. A bullish engulfing pattern on a 3-year high in trading volume combined to give PHM a bottoming pattern in desperate need of confirmation.
Ironically, the headline earnings news was nothing new and arguably represented worsening news. So either shorts are finally satisfied with their profits and/or the “it can’t get any worse than this” crowd has finally arrived.
Rising home prices drive PulteGroup Q3 profit beat from CNBC.
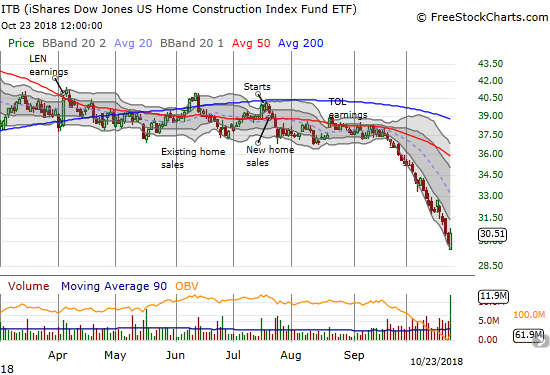
iShares US Home Construction ETF (ITB)
ITB benefited from the pop in PHM and sympathy buying across other builders. Unfortunately, ITB fell just short of a bullish engulfing pattern, so the jury is still frowning upon this case for a bottom.
The trading action caught the attention of CNBC’s Jim Cramer. I found his investing discussion a bit surprising. Cramer interpreted the buying of PHM and other builders as a sign of a bottoming and a bullish sign for the general stock market, BUT he did not recommend his audience even start accumulating home builder stocks. Cramer even called the rally in home builders “the single most important development” in a bullish turn-around in the market.
However, I have become accustomed to Cramer’s mixed signals. Even just 6 months ago he started an interview with the CEO of Taylor Morrison Home Corporation (TMHC) reminding his audience that normally he would hate the home builders at this part of the economic cycle because of higher interest rates. He went on to take refuge from that logic in Lennar’s (LEN) post-earnings bullish assessment and told TMHC CEO Sheryl Palmer that he “liked the cohort.” Cramer concluded that TMHC is “doing quite well.” With the stock now at a 28-month low and a recession level valuation (for example, 0.8 book/value, 0.4 price/sales), Cramer should have used this opportunity to call TMHC a screaming buy!
As it stands, I am ok restarting bullish positions because the period for bullish outperformance for the builders starts in a little over a week…
Cramer: Housing stocks are finally bottoming, but investors might not want to buy just yet from CNBC.
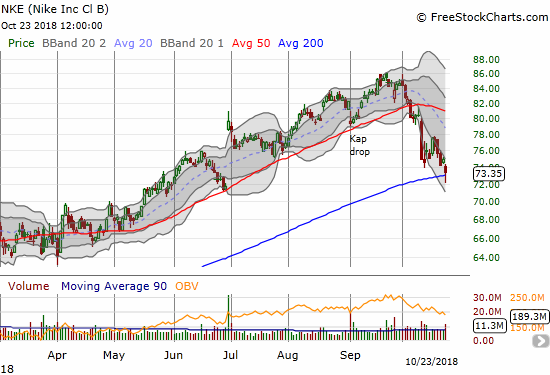
Nike (NKE)
NKE made it to my shopping list. The stock tenuously held onto its 200DMA support here. I like the prospects for a bounce back to 50DMA resistance even after a 200DMA breakdown.
— – —
FOLLOW Dr. Duru’s commentary on financial markets via email, StockTwits, Twitter, and even Instagram!
“Above the 40” uses the percentage of stocks trading above their respective 40-day moving averages (DMAs) to assess the technical health of the stock market and to identify extremes in market sentiment that are likely to reverse. Abbreviated as AT40, Above the 40 is an alternative label for “T2108” which was created by Worden. Learn more about T2108 on my T2108 Resource Page. AT200, or T2107, measures the percentage of stocks trading above their respective 200DMAs.
Active AT40 (T2108) periods: Day #5 under 20% (oversold), Day #10 under 30%, Day #17 under 40%, Day #22 under 50%, Day #38 under 60%, Day #91 under 70%
Daily AT40 (T2108)
")
Black line: AT40 (T2108) (% measured on the right)
Red line: Overbought threshold (70%); Blue line: Oversold threshold (20%)
Weekly AT40 (T2108)

*All charts created using freestockcharts.com unless otherwise stated
The charts above are my LATEST updates independent of the date of this given AT40 post. For my latest AT40 post click here.
Related links:
The AT40 (T2108) Resource Page
You can follow real-time T2108 commentary on twitter using the #T2108 or #AT40 hashtags. T2108-related trades and other trades are occasionally posted on twitter using the #120trade hashtag.
Be careful out there!
Full disclosure: long SPY calls, long UVXY puts, long EA call and short put, long BA put spread, long ITB calls and calendar call spread,
*Charting notes: FreeStockCharts.com stock prices are not adjusted for dividends. TradingView.com charts for currencies use Tokyo time as the start of the forex trading day. FreeStockCharts.com currency charts are based on Eastern U.S. time to define the trading day.