
AT40 = 63.1% ƒof stocks are trading above their respective 40-day moving averages (DMAs)
AT200 = 54.7% of stocks are trading above their respective 200DMAs (a 4-month high)
VIX = 13.8
Short-term Trading Call: bearish
Commentary
In my last Above the 40 post, I described how growing global trade wars are creating widening divergences in the stock market. I pointed out how the S&P 500 (SPY) sat right in the middle of two important market markers. Somehow taking the mantle of “safety trades”, a soaring tech market and a large contingent of small caps sit at the top. At the bottom are economically sensitive stocks like financials, industrials, home builders and others that continue to lag and sell-off. On balance, I thought it made sense to stay short-term bearish. The trading action over the last two days validated my bearish stance as small caps and tech finally sustained a tumble deep enough to matter.
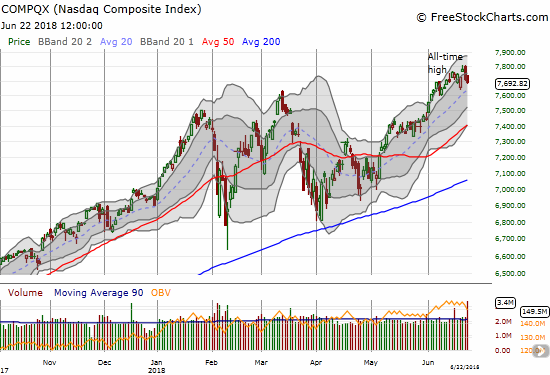
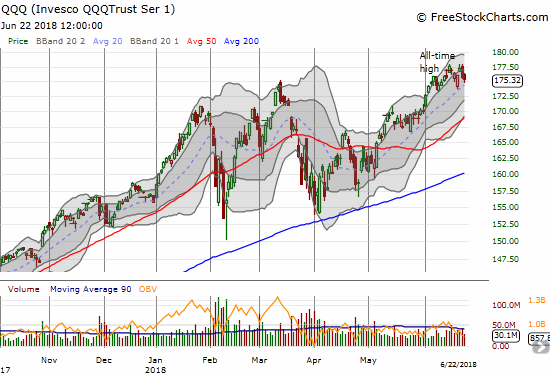
Given the uptrending 20-day moving average (DMA) has held for almost two months for tech, I will treat a break of that trendline as an important confirmation of a deepening bearish shift in the stock market. Still, one step at a time.
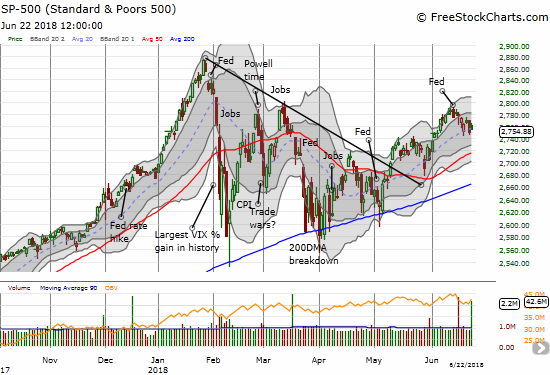
The 20DMA is already critically important for the S&P 500 (SPY). The index struggled to stay above this trendline all last week with two bounces from support, including Friday’s gain that well out-performed tech. A breakdown immediately puts the uptrending 50DMA support in play.
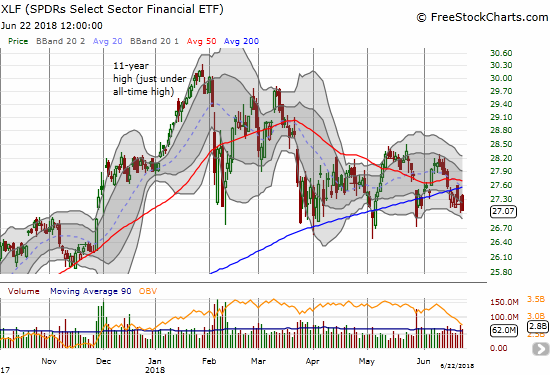
Financials continue to struggle. The Financial Select Sector SPDR ETF (XLF) is clinging to its closing lows for the year.
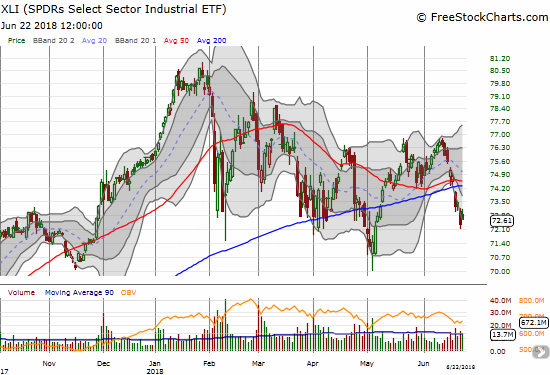
The Industrial Select Sector SPDR ETF (XLI) managed to eke out a gain on Friday in what looks like a relief bounce. Sellers were otherwise persistent for most of the week as a fresh 200DMA breakdown received technical confirmation. A new 2018 low would be particularly bearish. On the flip side. I will treat a new 200DMA breakout as short-term bullish in anticipation of the same kind of relief bounce that occurred last month.
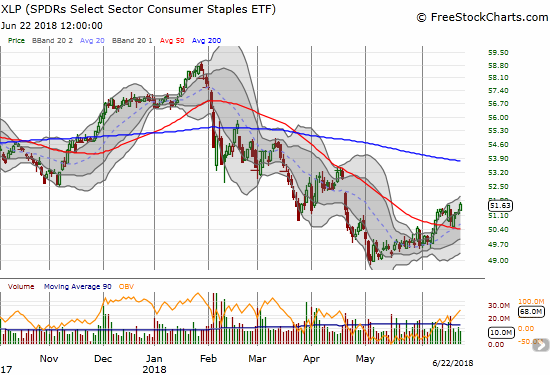
When I was last bullish, I claimed that the broad-based buying of beaten up stocks confirmed a fresh bullish streak in the market. Consumer Staples Select Sector SPDR ETF (XLP) was of prime interest. I dropped my interest once I turned bearish, but XLP surprisingly continues to creep higher. Perhaps a larger rotation is underway that I will only be able to appreciate fully after it has run its course. If I were still bullish, I would consider taking a swing on XLP (or some of its components) with tight stops under key support levels. XLP confirmed 50DMA support and is benefiting from an uptrending 20DMA.
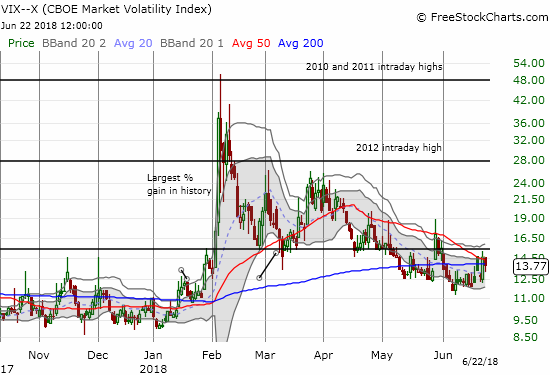
AT40 (T2108), the percentage of stocks trading above their respective 40DMAs, churned all week above the 60% level. It has yet to add further confirmation to my bearish call, but my favorite technical indicator is not helping the bullish case either. On the other hand, the volatility index, the VIX, is adding “reluctant” confirmation to my bearish call. The VIX came to life this week, but Thursday was the only day fear could keep the VIX aloft near its high for the day. The VIX lost 5.8% on Friday (VIX faders back on the case!).
Despite the VIX’s resurgence this week, I did not profit from my tranches of call options on ProShares Ultra VIX Short-Term Futures (UVXY). I made a specific choice to hold them through the end of the week for hedges. For the next round, I will return to selling these calls whenever the VIX spikes higher.

The bears scored a rare weekly victory on balance. Accordingly, I swung my short-term trades more decidedly to the bearish side of the ledger by the end of the week including some key fades.
CHART REVIEWS
Axovant Sciences (AXON)
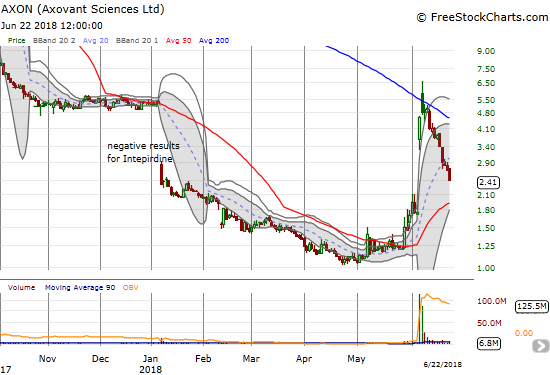
AXON has experienced a wild June. I am glad I sold the first massive pop even though I far from maximized my profits. The stock has sold off nearly non-stop since a gap and crap took it above and then back below its downtrending 200DMA. A presentation at the JMP Life Science Conference on Thursday was clearly not enough to dissuade the sellers.
I continue to check on AXON for a fresh buying signal. The current rate of descent suggests the buyers may not show again until the the big gap up on June 6th fills. Perhaps the 50DMA will serve as a sufficient resting stop.
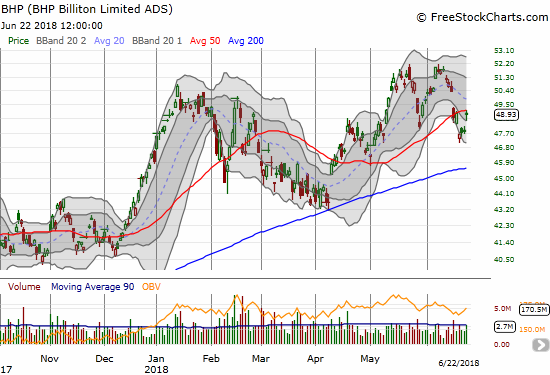
BHP Billiton (BHP)
Fading BHP is paying off again. I faded it again on Friday as it stalled against 50DMA resistance. If I get the opportunity before another swift downdraft, I will increase the position at the downtrending 20DMA. At some point in the next month or two, I am expecting BHP to test uptrending 200DMA support.
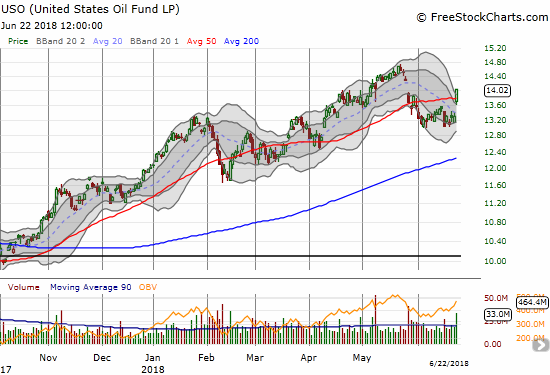
United States Oil (USO)
Oil spiked on Friday despite promises of a supply boost from OPEC. This gain likely helped boost BHP.
This is not the kind of inflation that signals good news for the world economy. In fact, the last thing the economy needs is higher oil prices in the face of rising trade tensions with the U.S.
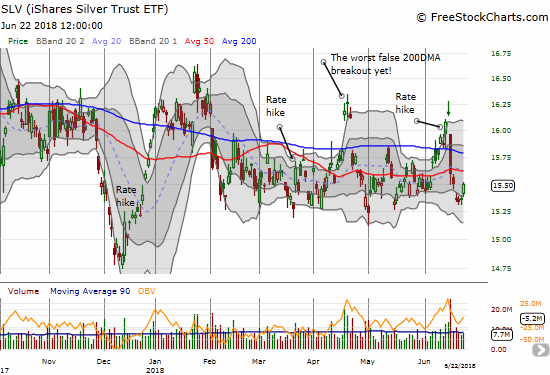
iShares Silver Trust (SLV)
I am not sure whether oil also had an effect on precious metals, but it may have helped SLV defend the lower part of a 4+ month trading range that itself is trapped within a much larger 18-month trading range. With SPDR Gold Shares (GLD) only gaining 0.2% versus SLV’s 0.9% my latest pairs trade with SLV calls and GLD puts got off to a great start.
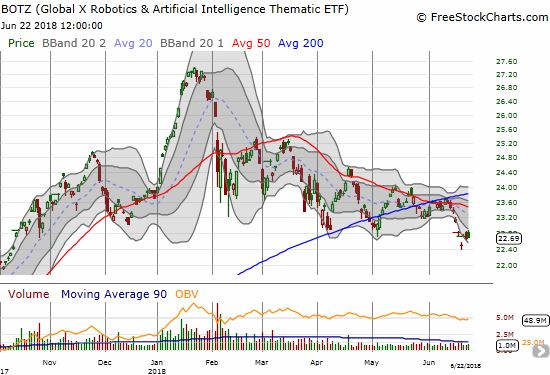
Global X Robotics & Artfcl Intllgnc ETF (BOTZ)
BOTZ is an interesting ETF that includes a host of international tech stocks. BOTZ’s top component is Nvidia (NVDA) (10.2% of the index), a stock I like to trade on the dips. I bought again as NVDA took a hard tumble to end the week along with the general tech sell-off. I was quite surprised to see BOTZ held its ground on Friday, but even MORE surprised to see the ETF is on the edge of a major, and a very bearish, breakdown. BOTZ hit an 8-month low last week before bouncing back sharply. Note how BOTZ has significantly lagged the S&P 500 and especially the NASDAQ.
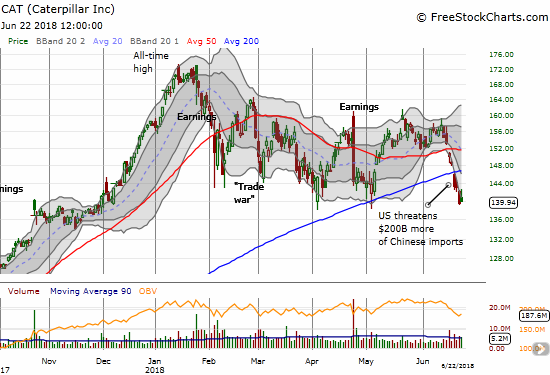
Caterpillar (CAT)
CAT had a rough week that included a 200DMA breakdown and a near 6-month low. Post-earnings weakness is re-established for CAT. I will plan to fade CAT on strength. I should have entered last week already short (put options) on CAT.
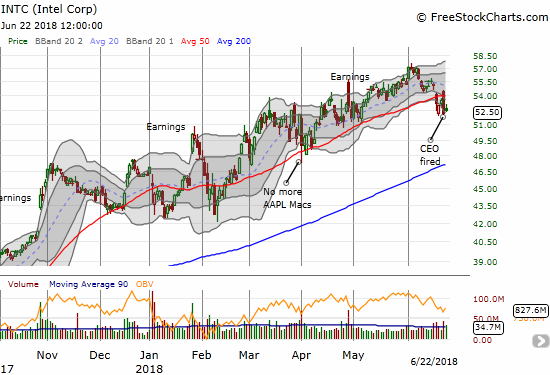
Intel (INTC)
INTC broke down below its 50DMA to start the week and triggered some call option buying on my strategy to buy INTC dips between earnings. The move looked great for a hot minute when INTC broke out above its 50DMA. Sellers ended the breakout quickly after belatedly deciding the resignation of the CEO (more like the company gave him the opportunity to step down = fired) was bad news. The stock looks like it is trying to hold the lows of the week, but I am not optimistic.
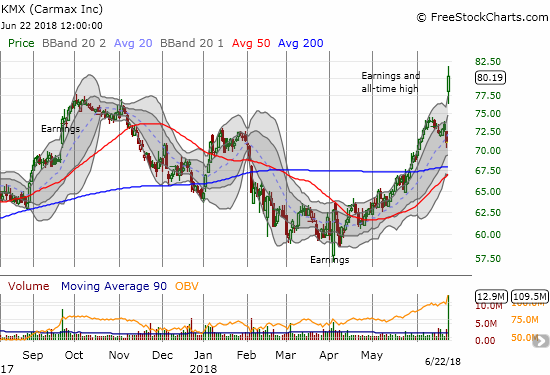
Carmax (KMX)
I would be remiss if I failed to post the incredibly bullish, post-earnings chart of KMX. I have long stood as bearish against the stock and the company. This chart makes me officially stand down! KMX bounced back sharply from an April post-earnings gap down, pulled back again, and then took off with a purpose into this latest earnings report. The stock is of course very extended now, but this pattern is about as bullish as it gets.
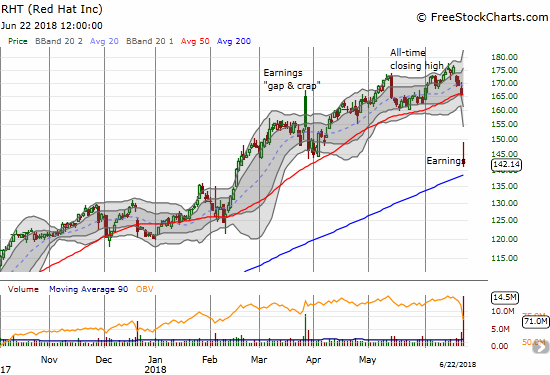
RedHat (RHT)
The poor reaction to RHT’s earnings announcement likely set the tone for tech weakness on Friday. RHT dropped a whopping 14.2% as buyers failed to sustain a comeback from the open. RHT has not traded below its 200DMA since January or February 2017, so I will be watching closely to see how the market, especially for tech, copes with such a bearish development. Jim Cramer of CNBC’s Fast Money took time out to interview the CEO and gave him a chance to explain why this drop is just another buying opportunity.
From a technical standpoint, RHT is a broken stock until proven otherwise. Not only does RHT have a pending rendezvous with 200DMA support, but also the stock now trades below the low from March’s earnings which delivered a bearish gap and crap. Two bearish post-earnings reactions in a row for a high-flying tech stock is bad news and makes RHT a “show me” stock.
Red Hat CEO on earnings-led stock decline from CNBC.
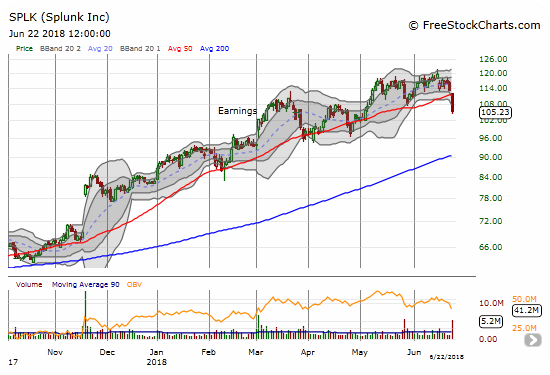
Splunk (SPLK)
SPLK was one of the many casualties in the software space that fell in sympathy with RHT. The stock broke down below 50DMA support with a 7.0% loss on extremely high volume. The selling was surprisingly aggressive – like SPLK itself reported bad earnings news. This is topping action. However, if SPLK manages to reverse Friday’s loss the stock becomes more bullish than it was before Friday. Note that before Friday, SPLK had yet to recover from a sell rating from Citigroup on June 15th.
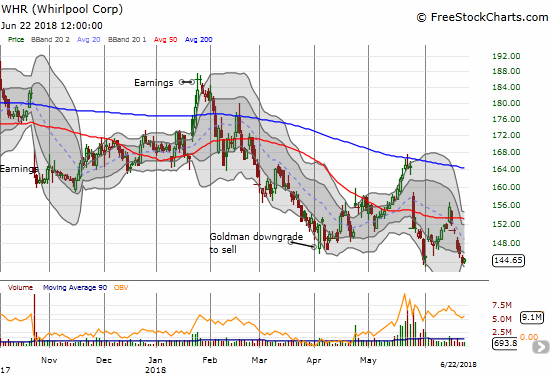
Whirlpool (WHR)
On June 15th, WHR broke down below 50DMA support for the second time in a month. The stock sold off for 4 more days to close at a new (marginal) 16-month low. WHR has a sizable dependence on international retail sales as well as the health of the U.S. housing market. I am guessing WHR is suffering from growing bearish sentiment on both sides. A Bollinger Band squeeze is starting to form and could provide the next sustained direction for the stock.
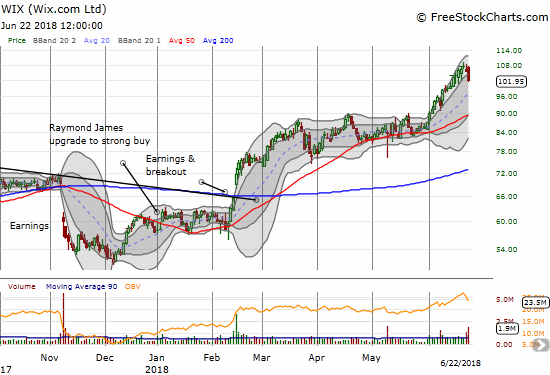
Wix.com (WIX)
WIX has a subtler topping pattern; it only attracted my attention because of general weakness in tech. WIX broke out the first day of June to a new all-time high and basically ran straight up from there until Friday. The 3.5% drop ended the bullish uptrend through the upper-Bollinger Band (BB) channel. Even if I do not trade WIX, keeping an eye on such hot stocks gives incremental insight into the market’s appetite for risk and its willingness to pay large premiums for growth.
— – —
FOLLOW Dr. Duru’s commentary on financial markets via email, StockTwits, Twitter, and even Instagram!
“Above the 40” uses the percentage of stocks trading above their respective 40-day moving averages (DMAs) to assess the technical health of the stock market and to identify extremes in market sentiment that are likely to reverse. Abbreviated as AT40, Above the 40 is an alternative label for “T2108” which was created by Worden. Learn more about T2108 on my T2108 Resource Page. AT200, or T2107, measures the percentage of stocks trading above their respective 200DMAs.
Active AT40 (T2108) periods: Day #88 over 20%, Day #57 over 30%, Day #52 over 40%, Day #34 over 50%, Day #17 over 60% (overperiod), Day #8 under 70% (underperiod)
Daily AT40 (T2108)
")
Black line: AT40 (T2108) (% measured on the right)
Red line: Overbought threshold (70%); Blue line: Oversold threshold (20%)
Weekly AT40 (T2108)

*All charts created using freestockcharts.com unless otherwise stated
The charts above are my LATEST updates independent of the date of this given AT40 post. For my latest AT40 post click here.
Related links:
The AT40 (T2108) Resource Page
You can follow real-time T2108 commentary on twitter using the #T2108 or #AT40 hashtags. T2108-related trades and other trades are occasionally posted on twitter using the #120trade hashtag.
Be careful out there!
Full disclosure: long SPY puts, long INTC calls, long BHP puts, long GLD and SLV shares (core positions), long GLD puts and long SLV calls (pairs trade), short SPLK, long NVDA calls
*Charting notes: FreeStockCharts.com stock prices are not adjusted for dividends. TradingView.com charts for currencies use Tokyo time as the start of the forex trading day. FreeStockCharts.com currency charts are based on Eastern U.S. time to define the trading day.