
AT40 = 65.7% of stocks are trading above their respective 40-day moving averages (DMAs)
AT200 = 55.3% of stocks are trading above their respective 200DMAs (a 4-month high)
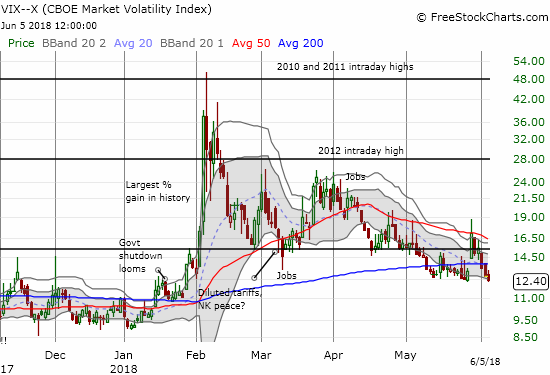
VIX = 12.4
Short-term Trading Call: neutral
Commentary
A month ago I pounded the table for Apple (AAPL). I was tempted to extend that sentiment to the stock market, but I resisted with a cautiously bearish short-term trading call because of several concerns:
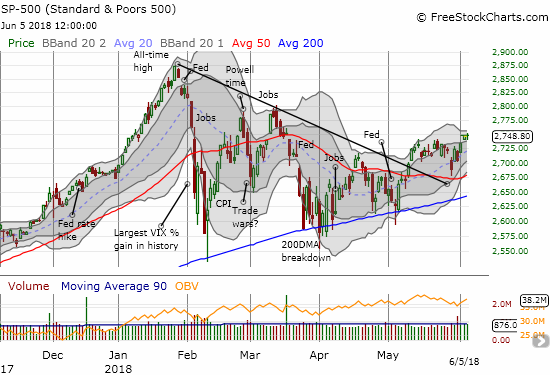
“The S&P 500 remains firmly stuck in a triangle pattern. I need to see the index close above the peak from the last 50DMA breakout AND show follow through buying. My favorite technical indicator, AT40 (T2108), the percentage of stocks trading above their respective 40DMAs, was very weak until Friday. Even with the S&P 500 making another amazing 200DMA comeback on Thursday, AT40 closed at a 3 week low. At 53.5%, AT40 has more upside, but it is still in “show me” mode after a bearish rejection from the 70% overbought threshold on April 19th. Finally, the S&P 500 has now responded poorly to the last three meetings from the Federal Reserve. In other words, I think it is very possible AAPL powers higher without dragging much of the general market with it as investors and traders seeking ‘safety’ in equities bias their money toward AAPL and away from a lot of other options.”
Since those words on May 4th, AAPL has gained 5.4%, and the S&P 500 (SPY) is up 3.2%. In that time, I also flipped the short-term trading call back to neutral. With AAPL leading the charge with a fresh breakout and bullish upside resolution to a Bollinger Band (BB) squeeze, I am tempted once again to get bullish.
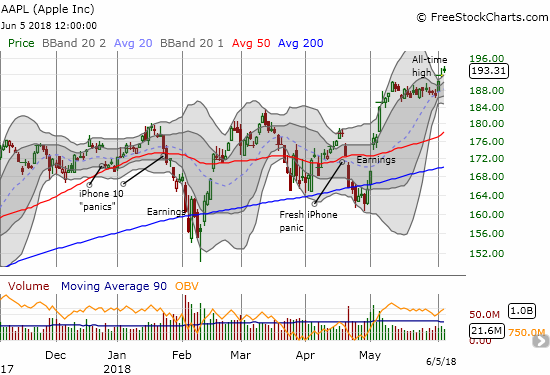
AAPL is just 5% or so away from becoming the world’s first trillion dollar market cap company and yet, I still cannot quite flip bullish on the general stock market. I am not just worried about another poor reaction to a Fed monetary policy announcement…which is coming up next week on June 13th.
AT40 is STILL struggling under the overbought (70%) threshold. At 65.6%, AT40 is even below last week’s high and below the high in the week prior that triggered my latest bout of caution. Until buyers get strong enough to push the stock market overbought and broaden the rally, I am stuck on neutral.
The volatility index, the VIX, is testing its latest lows and making put option hedges cheap once again. I have accumulated a fresh position in call options on ProShares Ultra VIX Short-Term Futures (UVXY). I think this is a great time to add one more tranche as a hedge against the market getting manic all over again over some fresh macro-economic trigger.
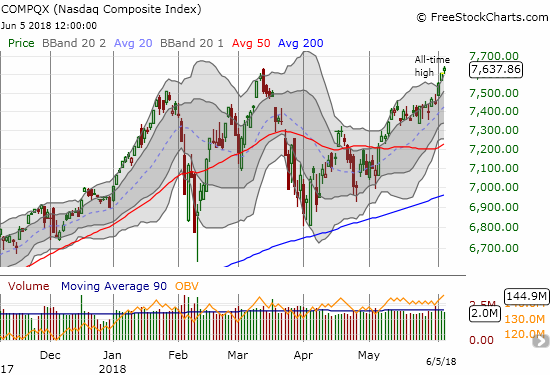
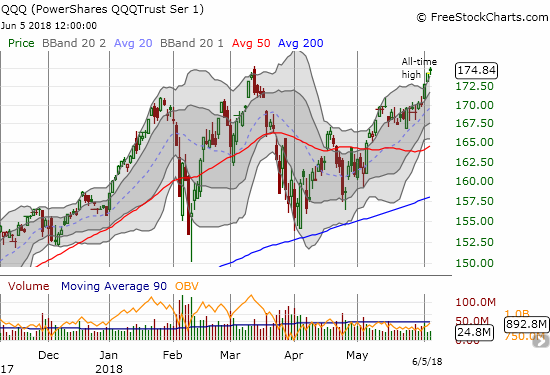
The AAPL temptation is particularly strong because the major indices each look good. The S&P 500 (SPY) is a laggard, but it is holding last week’s breakout. The NASDAQ and the PowerShares QQQ ETF (QQQ) are each following through with more buying following all-time highs.
AT200 (T2107), the percentage of stocks trading above their respective 200DMAs, is also supporting bulls and buyers. This longer-term indicator made a new 4-month high at 55.3%. So when the time comes to get bullish, there will still be plenty of stocks to pick from with longer-term upside potential.
— – —
FOLLOW Dr. Duru’s commentary on financial markets via email, StockTwits, Twitter, and even Instagram!
“Above the 40” uses the percentage of stocks trading above their respective 40-day moving averages (DMAs) to assess the technical health of the stock market and to identify extremes in market sentiment that are likely to reverse. Abbreviated as AT40, Above the 40 is an alternative label for “T2108” which was created by Worden. Learn more about T2108 on my T2108 Resource Page. AT200, or T2107, measures the percentage of stocks trading above their respective 200DMAs.
Active AT40 (T2108) periods: Day #75 over 20%, Day #44 over 30%, Day #39 over 40%, Day #21 over 50%, Day #4 over 60% (overperiod), Day #89 under 70%
Daily AT40 (T2108)
")
Black line: AT40 (T2108) (% measured on the right)
Red line: Overbought threshold (70%); Blue line: Oversold threshold (20%)
Weekly AT40 (T2108)

*All charts created using freestockcharts.com unless otherwise stated
The charts above are my LATEST updates independent of the date of this given AT40 post. For my latest AT40 post click here.
Related links:
The AT40 (T2108) Resource Page
You can follow real-time T2108 commentary on twitter using the #T2108 or #AT40 hashtags. T2108-related trades and other trades are occasionally posted on twitter using the #120trade hashtag.
Be careful out there!
Full disclosure: long UVXY calls,
*Charting notes: FreeStockCharts.com stock prices are not adjusted for dividends. TradingView.com charts for currencies use Tokyo time as the start of the forex trading day. FreeStockCharts.com currency charts are based on Eastern U.S. time to define the trading day.