
AT40 = 48.5% of stocks are trading above their respective 40-day moving averages (DMAs)
AT200 = 52.9% of stocks are trading above their respective 200DMAs
VIX = 14.6 (11.5% drop)
Short-term Trading Call: bullish
Commentary
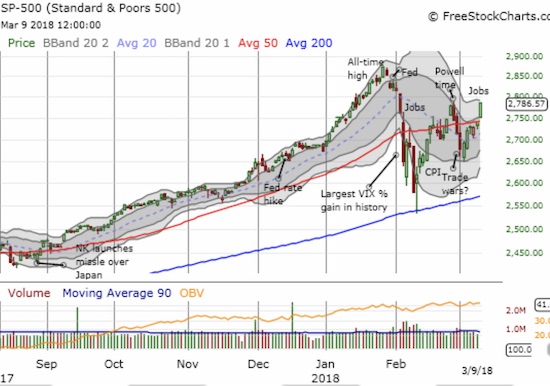
The (expected) plunge in the volatility index, the VIX, says it all…the stock market is ready to return to its originally scheduled programming.
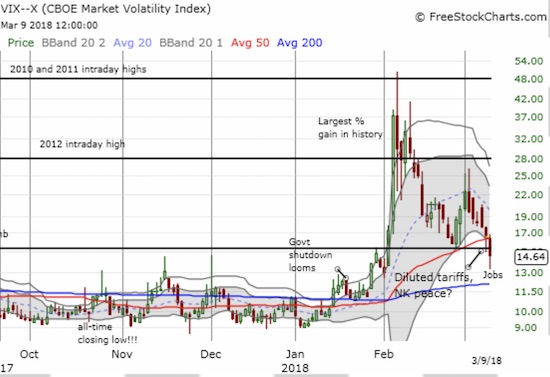
It was a news-filled week and almost everything worked toward relieving market anxieties: President Trump announced tariffs that represented concessions to political and economic pressures; the jobs report for February delivered a goldilocks report with a bushel full of jobs, minor wage inflation, and a monthly increase in the size of the labor force that was last this large 35 years ago; and a surprise bonus with North Korea claiming it is ready to negotiate denuclearization of the Korean peninsula. Essentially every significant and palpable negative headwind whisked right off the market’s radar.
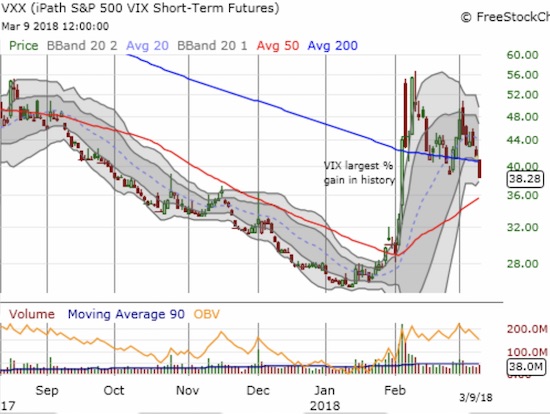
I used this occasion to cover my short in the iPath S&P 500 VIX ST Futures ETN (VXX). While I was bolstered by a hedge with call options in the ProShares Ultra VIX Short-Term Futures (UVXY), I was determined to fade VXX given what I saw as the high certainty of an imminent volatility implosion. I will continue this fading strategy if VXX shares remain available for shorting. However, I highly suspect the short volatility trade will get very popular all over again. Note that VXX has yet to reverse all its gains from the day the VIX soared at its highest percentage in history. I am still projecting an eventual complete reversal and more.
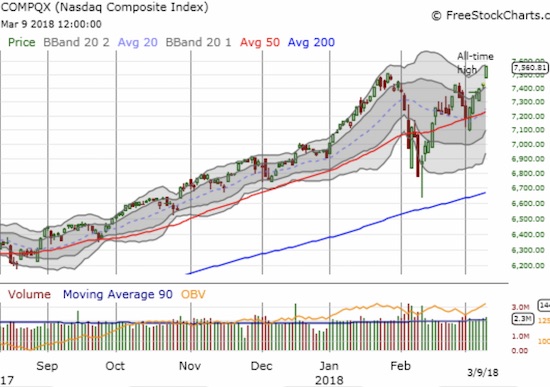
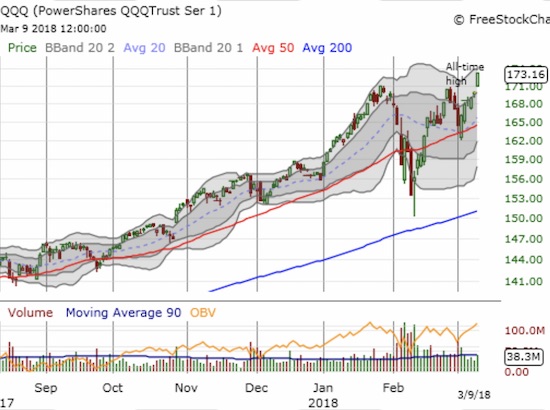
Part of the stock market’s original programming is to achieve all-time highs. The NASDAQ and the PowerShares QQQ ETF (QQQ) answered the casting call with 1.8% and 1.9% gains respectively. The S&P 500 (SPY) is scrambling to catch-up with a 1.7% gain that represents a convincing breakout above its 50-day moving average (DMA) and its highest close since February’s job report.
The iShares Russell 2000 ETF (IWM) gained 1.6% and is just a point away from its all-time closing high.
I am frankly surprised that any of the major indices could pull off a new all-time high so soon after February’s breakdown. I just assumed the S&P 500 would be stuck between its all-time high and its picture-perfect test of 200DMA support for several months to come. Now I have to take a new all-time high seriously. Accordingly, I bumped the short-term trading call from neutral all the way to bullish. I reloaded on SPY shares and calls. The easy stop loss is a close below the 50DMA. Note that this trade is not about anticipating some new catalyst to boost the stock market yet higher. This trade is about the return of regularly scheduled programming; the resumption of the previous momentum that rode on narratives of high consumer confidence, a strengthening American economy, and robust global growth.
AT40 (T2108), the percentage of stocks trading above their respective 40DMAs, confirmed the bullish day by soaring from 39.5% to 48.4%. This level is its highest since the February jobs report. AT200 (T2107), the percentage of stocks trading above their respective 200DMAs, is back above 50% and a marginal new high for this bounce from oversold conditions.
The currency markets are also on board with the refreshed bullish sentiment. The Australian dollar soared across the board. AUD/JPY almost gained 1% in what looks like a confirmation of a successful test of the April, 2017 intraday low (you just can’t make this stuff up!). I still grew my short AUD/JPY position as a hedge while I get busy with bullish trades elsewhere in forex.
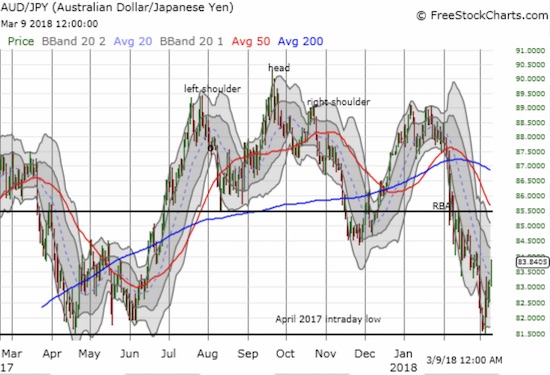
CHART REVIEWS
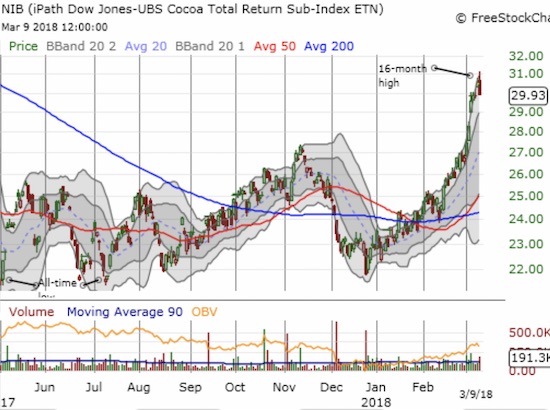
iPath Bloomberg Cocoa SubTR ETN (NIB)
Sold core position in $NIB. It was a wild ride since last year! Will be buying dips…assuming another one comes! #cocoa pic.twitter.com/Njw3ahmRuK
— Dr. Duru (@DrDuru) March 8, 2018
I write extensively about cocoa and trading the representative ETN NIB. On Thursday I took profits on my core position. I have not turned bearish. Instead, the recent run-up looks very extended, and I want to meet the next dip with aggressive buying. I could not do that while still holding the extremely large position that I had.
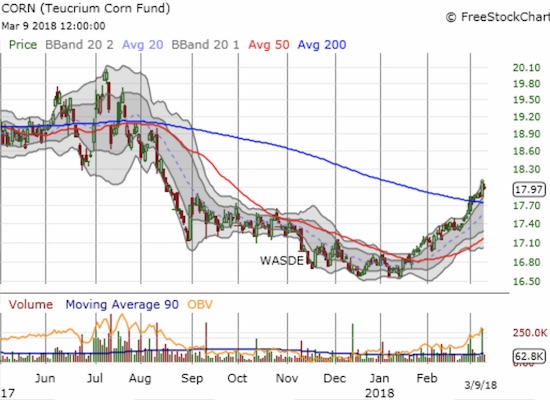
Teucrium Corn ETF (CORN)
Looks like it is time to pay more attention to corn again. The Teucrium Corn ETF broke out from its downtrending 200DMA. I assume this breakout confirms the December/January double-bottom. However, I need to review the latest and upcoming crop reports to regain my confidence. When I last wrote about CORN, I lamented that CORN broke below a price barrier I thought would hold. Yet the drop below the cost of production and seasonal factors encouraged me to look forward to an eventual price rally. Almost two months later that rally launched.
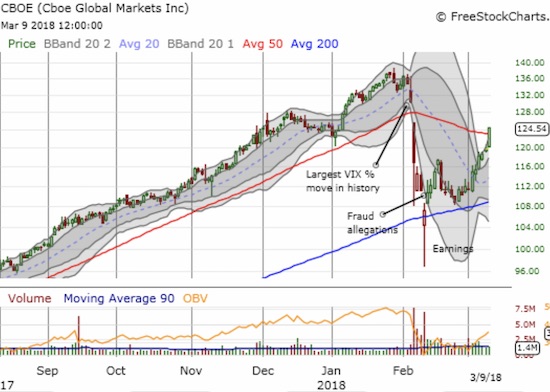
Cboe Global Markets, Inc. (CBOE)
With volatility finally imploding as expected, I took another look at CBOE. As I mentioned earlier, I expect the fade volatility trade to quickly regain momentum. CBOE remains the best way to play the trading volume. My abundance of caution with the stock kept me out even as CBOE bounced away from 200DMA support, but I am ready to go with Friday’s 50DMA breakout. I will be accumulating a substantial position as long as the 200DMA holds as support.
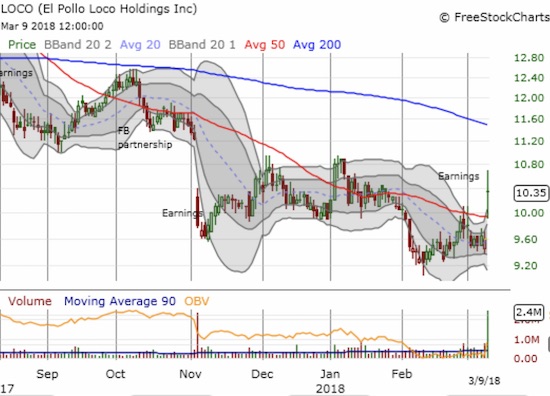
El Pollo Loco Holdings, Inc. (LOCO)
The chicken trade is trying to make a comeback. Post-earnings LOCO gained 7.8% on 6x average volume. That kind of trading volume on buying pressure is good enough to confirm a bottom. I will be eating up shares with an easy stop on a complete reversal of all the post-earnings gains. LOCO is loco cheap at this point with a 14.2 forward P/E, 1.0 price/sales ratio, and a 1.5 price/book ratio.
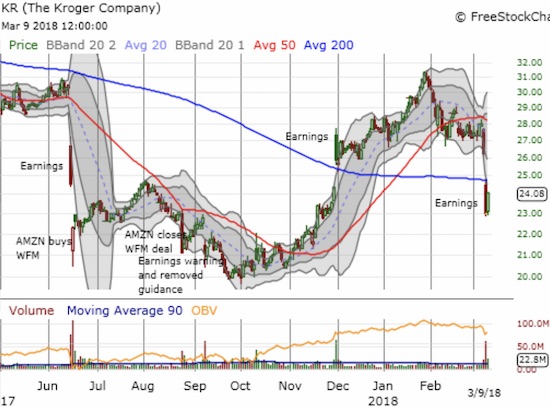
Kroger (KR)
KR was a great trade on the rebound from an Amazon panic. Unfortunately, the latest earnings debacle confirms that the business is fundamentally flawed in the eyes of investors. Price competition is brutal in groceries, and the CEO likely underlined investor fears in the Q&A period with this response (from the Seeking Alpha transcript):
“As I’ve said before, we’re not going to lose on price, but we’re not out there trying to lead the market down. And as you know, as part of Restock Kroger, we committed to improving operating margin dollars by 400 million over the next three years.”
I am not clear on how you win on price without leading the market on the downward slope! KR lost 12.4% post-earnings. It was a gap down that confirmed 50DMA resistance and cracked 200DMA support. The post-earnings gains from November are now all gone. While KR rebounded 4.8% on Friday, I am not interested in trying to bottom-fish again here, at least not without a further discount like the one I snatched with the Amazon panic.
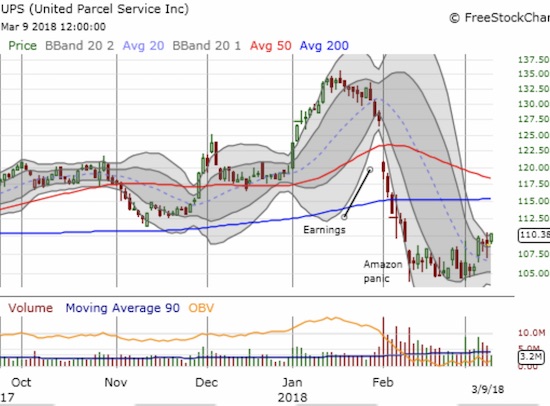
United Parcel Service, Inc. (UPS)
Speaking of Amazon panics, UPS is finally pulling away from its own bout of Amazon panic a month ago. Given the stock first broke down from earnings and is below both 50 and 200DMAs, the stock carries substantial risk. I am willing to take the risk given package delivery is a growth business. The easy stop loss is a new post Amazon panic low.
Other trades related to previous posts past 2 trading days: added a second USCR call option (I need to write an earnings update!); second leg of AAPL calendar spread expired worthless – I should have taken the small profit I had when AAPL started falling from $180 last week; I returned to my normal AAPL weekly trade starting on Thursday with just one call – it sold on Friday after hitting a double. I am hoping to get a dip on Monday, but I am not optimistic; started a new call spread in TWTR; I am in accumulation mode as SSTI made new all-time highs
— – —
FOLLOW Dr. Duru’s commentary on financial markets via email, StockTwits, Twitter, and even Instagram!
“Above the 40” uses the percentage of stocks trading above their respective 40-day moving averages (DMAs) to assess the technical health of the stock market and to identify extremes in market sentiment that are likely to reverse. Abbreviated as AT40, Above the 40 is an alternative label for “T2108” which was created by Worden. Learn more about T2108 on my T2108 Resource Page. AT200, or T2107, measures the percentage of stocks trading above their respective 200DMAs.
Active AT40 (T2108) periods: Day #16 over 20%, Day #5 over 30%, Day #1 over 40% (overperiod ending 22 days under 40%), Day #23 under 50%, Day #24 under 60%, Day #30 under 70%
Daily AT40 (T2108)
")
Black line: AT40 (T2108) (% measured on the right)
Red line: Overbought threshold (70%); Blue line: Oversold threshold (20%)
Weekly AT40 (T2108)

*All charts created using freestockcharts.com unless otherwise stated
The charts above are my LATEST updates independent of the date of this given AT40 post. For my latest AT40 post click here.
Related links:
The AT40 (T2108) Resource Page
You can follow real-time T2108 commentary on twitter using the #T2108 or #AT40 hashtags. T2108-related trades and other trades are occasionally posted on twitter using the #120trade hashtag.
Be careful out there!
Full disclosure: long SPY calendar call spread, long SPY shares and calls, short AUD/JPY, long CORN, TWTR call spread, long USCR calls, long SSTI
*Charting notes: FreeStockCharts.com uses midnight U.S. Eastern time as the close for currencies. Stock prices are not adjusted for dividends.
You should treat your stocks as real interest into your owned business instead of just simple things you can trade.