
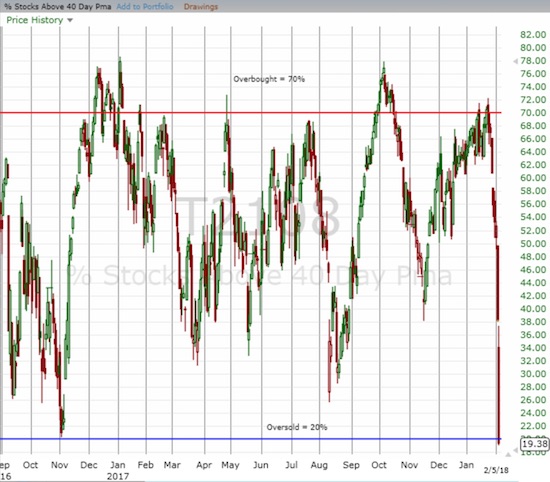
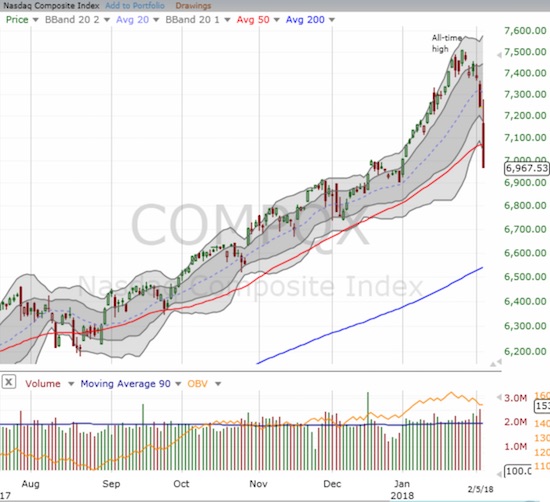
AT40 = 19.4% of stocks are trading above their respective 40-day moving averages (DMAs) – first oversold day after 19 percentage point plunge
AT200 = 45.8% of stocks are trading above their respective 200DMAs
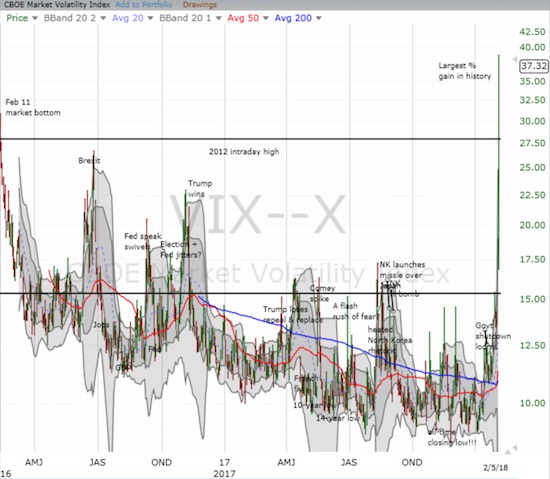
VIX = 37.3 (115.6% increase! The largest since at least 1990)
Short-term Trading Call: cautiously bullish – oh so many caveats below
Commentary
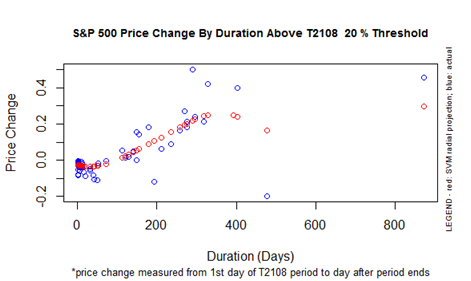
It was the JP Morgan bottom. On February 12, 2016, almost two years ago, AT40 (T2108), the percentage of stocks trading above their respective 40DMAs, bounced out of oversold conditions (below 20%). AT40 stayed out of oversold conditions for a near record 488 trading days. This period is called a “20% overperiod” because AT40 traded above 20%. Over that time, the S&P 500 gained 42%. In price performance, this past 20% overperiod ranks #3 since at least 1986 where my data end. In duration, this period ranks as the second longest. This was a truly historic moment for the stock market.
AT40 closed at 19.4% and is oversold. The aggressive trading strategy calls for buying right away because the typical oversold period only lasts 1 or 2 days. If the oversold period lasts longer, then the next wave of buying waits until the volatility index pulls back off a high. The conservative strategy calls for patiently waiting until the oversold period ends before buying. I see significant issues with both strategies given the unique nature of this sell-off.
Practically in flash crash territory at this point. $SPY #T2108 #AT40
— Dr. Duru (@DrDuru) February 5, 2018
First, the market entered this oversold period with the volatility index already surging. In fact, the VIX hit an historic level and clocked a record 115.6% one-day gain (the data go back to 1990). The VIX has not traded this high, 37.3, since the 38.1 intraday high on August 25, 2015. The VIX last closed higher on August 24, 2015 when I wrote about how to profit from an EPIC oversold period in the wake of the flash crash that I later dubbed the “August Angst.” So, if the sell-off continues, I have no good bearing on how much higher the VIX could go. The VIX SHOULD be topping out right here. Even a pullback in the VIX amid such high level of panic may not provide a good indicator of the end of the stampede.
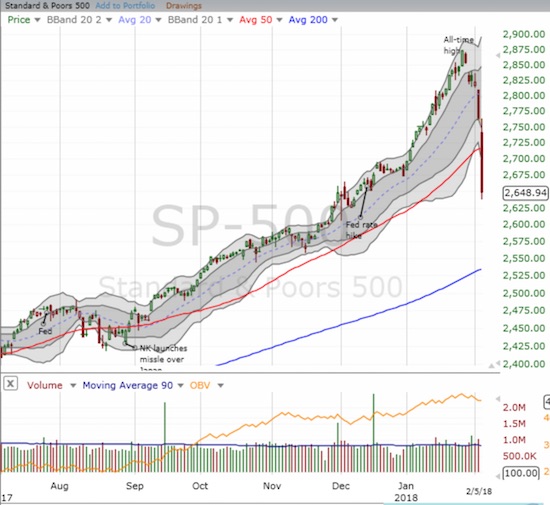
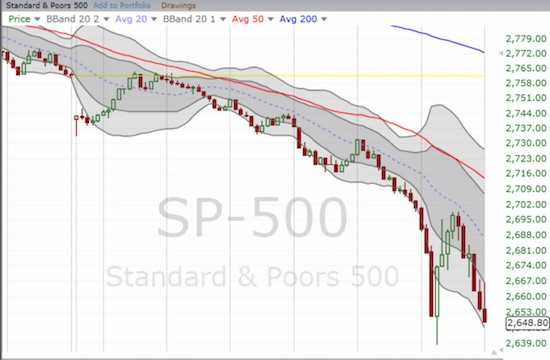
Second, the S&P 500 (SPY) broke down below its 50-day moving average. The 4.1% loss took the index well below its lower-Bollinger Band (BB) and instantly plunged the index into negative territory for the year, now down 0.9% year-to-date. Say goodbye to all that new retirement and passive investment money that flooded the market in January (Wall Street I am sure is grateful). The index was up 7.5% for the year at the all-time high just over a week ago. Buying the market after the oversold period ends would likely face a quick test of stamina as the S&P 500 plows into resistance from the 50DMA – very poor risk/reward.
I am left with a strategic dilemma that requires more nuance than I like, but I find it necessary. The oversold conditions require that I keep the short-term trading call at bullish. Given the market’s precarious nature, I am cautiously bullish. That caution means I will not buy aggressively until/unless the S&P 500 tests its uptrending 200DMA. Such an event would be the first test since the times around the presidential election. As the S&P 500 approaches 50DMA resistance, I will switch to neutral and have a bias to SELL rallies. I will switch back to cautiously bullish if/when the S&P 500 closes above 50DMA resistance AND sports follow-through buying. Until the market is solidly bullish again, the majority of my short-term trades will focus on the indices (SPY, SDS, SSO, and QQQ).
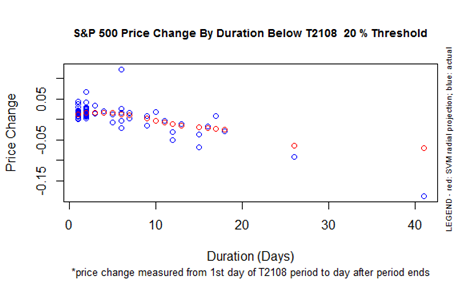
If AT40 languishes in oversold territory, I may occasionally make SMALL bearish bets to offset existing bullish positions. Note that the longer AT40 stays oversold, the worse the S&P 500 tends to perform.
My nuanced approach also comes from today’s trading experience. I started the day bullish and found validation when the S&P 500 bounced near my 2735 line in the sand that separated bullishness and bearishness. The switch in tone came mercifully swiftly, and I was not able to complete my shopping list. Shortly after the index made a new low, I had to pause. I next waited to see whether the buyers would show up at 2:30pm Eastern. They did not. Instead, the selling intensified, and I moved to get officially bearish. I loaded up on call options for ProShares UltraShort S&P500 (SDS) and set a limit order for a double. Much to my delight AND shock, the order filled in 25 minutes.
I next looked around and noticed the VIX was really going nuts. With my oversold trading plan in hand, I prepared orders to fade volatility anew. Shock and awe once again occurred as the short volatility products completely collapsed in the after-hours, and long volatility continued to rally.
ProShares Short VIX Short-Term Futures (SVXY) lost another 79% of its value. VelocityShares Daily Inverse VIX ST ETN (XIV) lost 84% of its value. The iPath® S&P 500 VIX ST Futures™ ETN (VXX) gained 29% while ProShares Ultra VIX Short-Term Futures (UVXY) only gained 27%. I am sure glad I stuck to options on these products. Still, this range of action makes little sense and suggests a serious technical breakdown in the way these products work. I am bracing for ripple effects into options pricing and then to stocks.
The market is teetering on some level of brokenness. I am resisting the urge to look for an explanation, a driver, a catalyst to deliver some logic to it all. I assume no one truly knows what is going on underneath the market’s twisted covers. As a result, I feel better prepared for whatever is coming.
Next largest % gain on #VIX was February 27, 2007 at 64.2%. $SPY double-topped later that year. Financial crisis ~18 months later. =gulp=
— Dr. Duru (@DrDuru) February 5, 2018
CHART REVIEWS
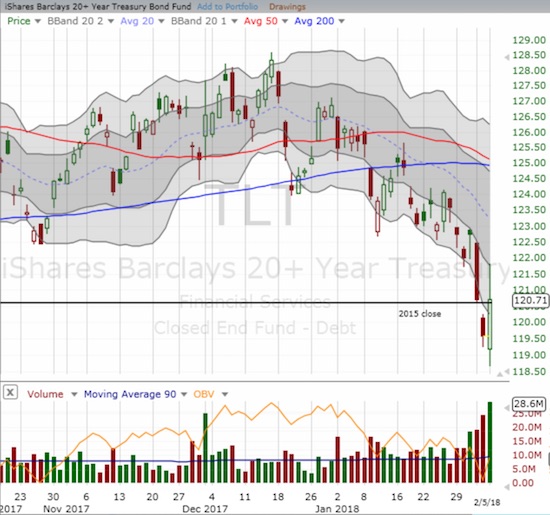
iShares 20+ Year Treasury Bond ETF (TLT)
Predicting Powell's first job as Fed Chair will be to reassure markets that rates will go up so slow we won't even notice… $TLT $SPY #VIX
— Dr. Duru (@DrDuru) February 5, 2018
On a day where broad-based selling smashed stocks through critical technical levels, TLT delivered one of the more interesting charts for me. TLT managed to gain 0.9% as bond yields backed off a bit. Fear acted like a counter-balance to the rates rising narrative that has dominated the headlines during this sell-off. I added more TLT calls today, and I continue to like long TLT as a hedge against a more serious market malaise. Just imagine the Fed talking about that happy place of higher rates while panic is in the (Wall) streets…
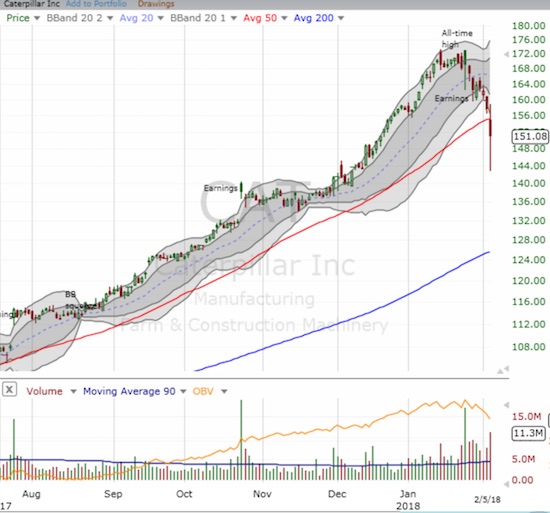
Caterpillar (CAT)
Typically, CAT is a stock I use to hedge bullishness. This cycle, I decided to go long. I THOUGHT CAT confirmed its uptrending 50DMA as support when the market bounced early. The day ended in calamity. CAT lost 4.1% but was down as much as 9.3% at its low of the day! Clearly, I need to switch CAT back to its former role.
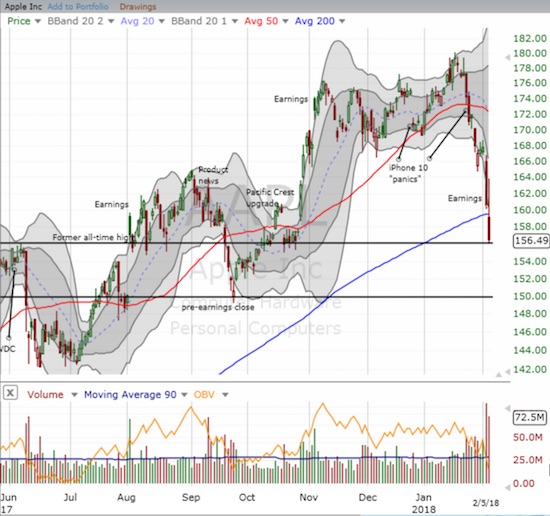
Apple (AAPL)
Really bad for sentiment: a bearish breakdown for $AAPL below 200DMA support.
— Dr. Duru (@DrDuru) February 5, 2018
Enough said…the post-earnings selling pressured kept CHASING AAPL. The stock is now down 7.5% year-to-date as it made a very bearish break of 200DMA support. AAPL was near the top of my shopping list at the market’s early bounce. I sure got some whiplash on that.
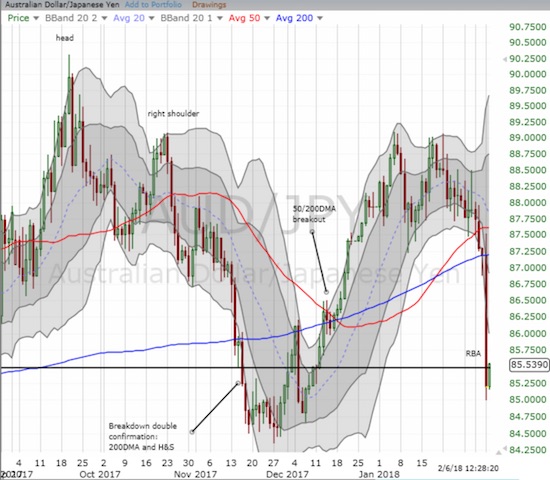
Australian dollar versus the Japanese yen (AUD/JPY)
Not stocks, but these currencies are important for understanding the context of market sentiment. Earlier in the day, AUD/JPY dropped right through 200DMA support and confirmed the day’s bearish vibes. I dutifully went short, but took profits when I noticed the tremendous surge in the VIX. At the time of typing, the Australian dollar is trying to rebound back to where it stood just ahead of the Reserve Bank of Australia’s (RBA) latest pronouncement on monetary policy. I am looking to aggressively fade AUD/JPY again and will be watching this sentiment indicator more closely than ever. (Also at the time of typing, Japan’s Nikkei index is down about 6%!)
— – —
FOLLOW Dr. Duru’s commentary on financial markets via email, StockTwits, Twitter, and even Instagram!
“Above the 40” uses the percentage of stocks trading above their respective 40-day moving averages (DMAs) to assess the technical health of the stock market and to identify extremes in market sentiment that are likely to reverse. Abbreviated as AT40, Above the 40 is an alternative label for “T2108” which was created by Worden. Learn more about T2108 on my T2108 Resource Page. AT200, or T2107, measures the percentage of stocks trading above their respective 200DMAs.
Active AT40 (T2108) periods: Day #1 under 20% (1st oversold day ending 488 days above 20%), Day #1 under 30% (ending 302 days above 30%), Day #2 under 40%, Day #2 under 50%, Day #5 under 60%, Day #9 under 70% (corrected from the last Above the 40 post)
Daily AT40 (T2108)
")
Black line: AT40 (T2108) (% measured on the right)
Red line: Overbought threshold (70%); Blue line: Oversold threshold (20%)
Weekly AT40 (T2108)

*All charts created using freestockcharts.com unless otherwise stated
The charts above are my LATEST updates independent of the date of this given AT40 post. For my latest AT40 post click here.
Related links:
The T2108 Resource Page
You can follow real-time T2108 commentary on twitter using the #T2108 or #AT40 hashtags. T2108-related trades and other trades are occasionally posted on twitter using the #120trade hashtag.
Be careful out there!
Full disclosure: long UVXY puts, long SVXY calls, long TLT calls, long CAT calls, long AAPL
*Charting notes: FreeStockCharts.com uses midnight U.S. Eastern time as the close for currencies. Stock prices are not adjusted for dividends.
Most of the ‘bargains’ went away by the close.
Unless things calm down, this is going to be a very tough market for traders, and it will be easy to get whipsawed.
But the truth is that a further decline would be very healthy in shaking out speculators (sorry, Duru!), as the market has just about gone straight up since the late Dec. 2015/early Jan. 2016 decline. It’s more than time for pullback. I’d love to see T2108 in the low teens….and if you recall, there was even a time it was in single digits….unlikely that will happen, but you never know….
No offense taken! 🙂
T2108 hit a low of 12 today, so that may be it. But I am definitely bracing for sellers to retest the lows.
Regardless, as I noted, my upside expectations are tightly capped for now. I hope to write an update later tonight.