
AT40 = 39.3% of stocks are trading above their respective 40-day moving averages (DMAs)
AT200 = 49.7% of stocks are trading above their respective 200DMAs
VIX = 17.8%
Short-term Trading Call: neutral
Commentary
“Dear President Trump:
We are writing to express deep concern about the prospect of broad, global tariffs on aluminum and steel imports. Because tariffs are taxes that make U.S. businesses less competitive and U.S. consumers poorer, any tariffs that are imposed should be designed to address specific distortions caused by unfair trade practices.” – letter to POTUS signed by 100 House Republicans.
This quote is from the beginning of a short letter 100 House Republicans sent to President Trump urging him to reconsider what initially appeared to be a willingness to launch a broad scale trade war against countries with whom the U.S. has trade deficits. The letter ended with specific recommendations for very limited and constrained conditions for implementing tariffs. With this letter, and other developments, the tripwire that the President pulled on a trade war is gradually getting defused. Accordingly, the risk to the stock market is fading. Of course, the President reserves the opportunity to upset the apple cart at any time for any reason, but for now, it seems very likely that the President will be constrained by multiple political and economic forces.
On the economic side, there is evidence that prices are already soaring in anticipation of tariffs. In a brief but fascinating interview on Marketplace, Delaware Steel CEO Lisa Goldenberg talked about how the price of steel her company delivers into the non-residential construction market spiked 30% in immediate response to Trump’s declaration of trade war. Goldenberg also emphatically predicted that Trump will rein in the most heated part of his rhetoric on tariffs; she is running her business as if the sudden windfall from tariff-inspired price gains will not last.
“This is once in a lifetime, this is where you make money. The question is, when this ‘falls apart,’ when this changes, I don’t want to be left with extraordinarily high-priced inventory. So I need to be extra, extra cautious. Let’s remember, there are no new tariffs. This is a conversation…
Of course they’re going to be pulled back, and they may be pulled back before they even happen. We will have tariffs….Do I think they will look like what’s proposed? No, I do not.”
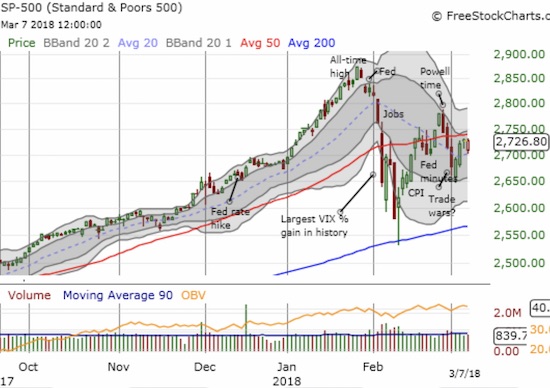
This extended preamble sets the stage for a market that is ready to confirm its post oversold recovery. The S&P 500 (SPY) has yet to pass a critical test of resistance at its 50-day moving average (DMA) and needs just one more nudge…
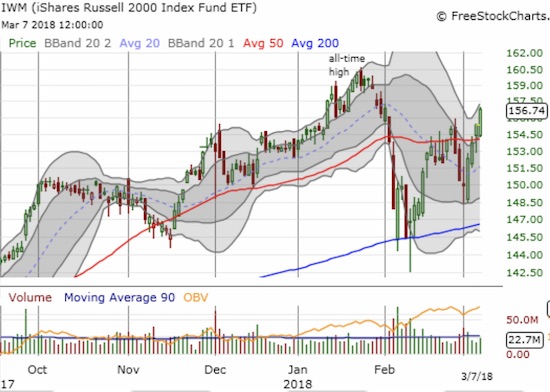
The NASDAQ and the PowerShares QQQ ETF (QQQ) managed to eke out the smallest of gains on the day. The big surprise was the Shares Russell 2000 ETF (IWM). IWM went from laggard to leader – its 0.9% gain today confirmed a 50DMA breakout.
The volatility index, the VIX, nudged downward for the fourth straight day. The VIX closed at 17.8. It went as high as 26.2 last Friday. The VIX will surely plunge below the 15.35 pivot if the market confirms its bullishness with an S&P 500 breaking out. The jobs report on Friday is a huge wildcard.
AT40 (T2108), the percentage of stocks trading above their respective 40DMAs, closed at 39.3%. The closing high since the last oversold period was 39.8%. So, like the S&P 500, AT40 is just one rally day away from a breakout that would signal the official return of control of the market to the buyers and bulls. Once (if?) that happens, I can flip my short-term trading call from neutral and back to (cautiously?) bullish. Note also that the currency market is in synch with the current market bounce with AUD/JPY jumping testing and jumping off its low on Monday.
CHART REVIEWS
Twilio (TWLO)
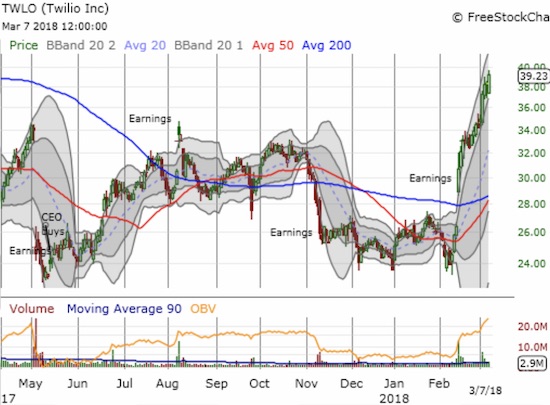
TWLO is back.
In mid-February, TWLO soared 16.2% after reporting well-received earnings. I was VERY late to catch on to the implications and only bought back into a position last week. TWLO has barely taken a breather on its way to a 4-month high. The stock took the scenic route, but it seems finally the CEO’s purchase almost a year ago is truly validated.
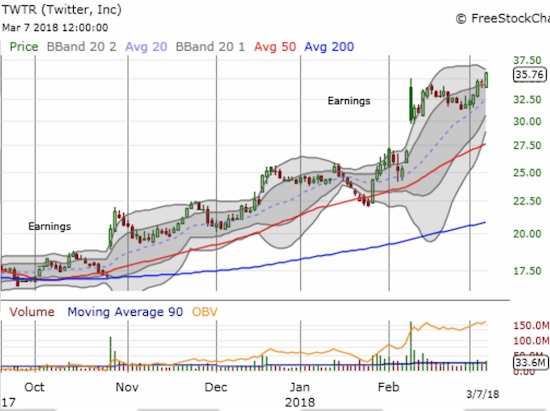
Twitter (TWTR)
I have yet to get a position going again in TWTR. I tried to get a good price on a call spread, but the stock failed to come back intraday. The stock made a new breakout to a new 2-year and 7-month high. Notice the first signs of a Bollinger Band (BB) squeeze forming around the price action.
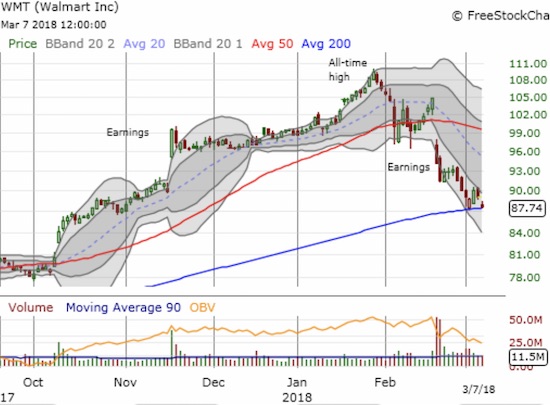
Walmart (WMT)
WMT is still moving opposite the post-oversold recovery story. The stock bounced off 200DMA support last Friday, but today retested that critical support line. A confirmed breakdown below this support would officially end my 2018 retail trade thesis. That thesis would shrivel to a recovery story for just a few select promising stocks.
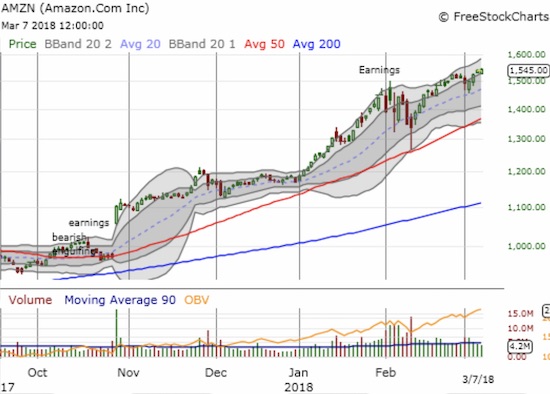
Amazon.com (AMZN)
AMZN is still showing off and is likely part of the reason WMT has yet to recover from its disastrous post-earnings response. Today, AMZN made a new marginal all-time high.
Trades related to previous posts past 3 trading days: flipped QQQ calls twice, bought CAT puts and shorted shares, flipped CAT calls, bought MCD calendar call spread, opened pairs trade long SLV calls and GLD puts, bought fresh AAPL call expiring next week as it appears last week’s calendar spread will end in a loss.
— – —
FOLLOW Dr. Duru’s commentary on financial markets via email, StockTwits, Twitter, and even Instagram!
“Above the 40” uses the percentage of stocks trading above their respective 40-day moving averages (DMAs) to assess the technical health of the stock market and to identify extremes in market sentiment that are likely to reverse. Abbreviated as AT40, Above the 40 is an alternative label for “T2108” which was created by Worden. Learn more about T2108 on my T2108 Resource Page. AT200, or T2107, measures the percentage of stocks trading above their respective 200DMAs.
Active AT40 (T2108) periods: Day #14 over 20% (overperiod), Day #3 over 30%, Day #21 under 40%, Day #21 under 50%, Day #22 under 60%, Day #28 under 70%
Daily AT40 (T2108)
")
Black line: AT40 (T2108) (% measured on the right)
Red line: Overbought threshold (70%); Blue line: Oversold threshold (20%)
Weekly AT40 (T2108)

*All charts created using freestockcharts.com unless otherwise stated
The charts above are my LATEST updates independent of the date of this given AT40 post. For my latest AT40 post click here.
Related links:
The AT40 (T2108) Resource Page
You can follow real-time T2108 commentary on twitter using the #T2108 or #AT40 hashtags. T2108-related trades and other trades are occasionally posted on twitter using the #120trade hashtag.
Be careful out there!
Full disclosure: short VXX, long UVXY calls, long SPY calendar call spread, long CAT puts and short shares, long TWLO, short AUD/JPY
*Charting notes: FreeStockCharts.com uses midnight U.S. Eastern time as the close for currencies. Stock prices are not adjusted for dividends.
My view is that the S&P 500 has formed a ceiling at 2730 that has acted as resistance continuously since the first day of March. The 50 DMA is slightly above, but I suspect 2730 is the actual ceiling. (The small difference is of little importance).
What’s crucial going forward is whether this barrier can be convincingly broken. The biggest “Trump card” (® 😉 was tax “reform”; it has been played, and the obligatory “sell the news” correction endured. Absent additional significant fiscal stimulus, why should market indexes continue higher?
(Update)
The oldest trick in the book to circumvent a resistance level is to gap above it on the open. The S&P 500 did that today to the 2730 level, but not to the 50 DMA… and 2730 re-asserted itself within 30 minutes.
Fascinating 😉 .
I honestly do not have a single catalyst for pushing the market higher. Until April earnings season, the market is more likely to hear bad news than good and headwinds continue to pile up.
So maybe the S&P 500 churns between 50DMA resistance and the recent lows until earnings?