
AT40 = 71.3% of stocks are trading above their respective 40-day moving averages (DMAs) – overbought day #2
AT200 = 58.6% of stocks are trading above their respective 200DMAs
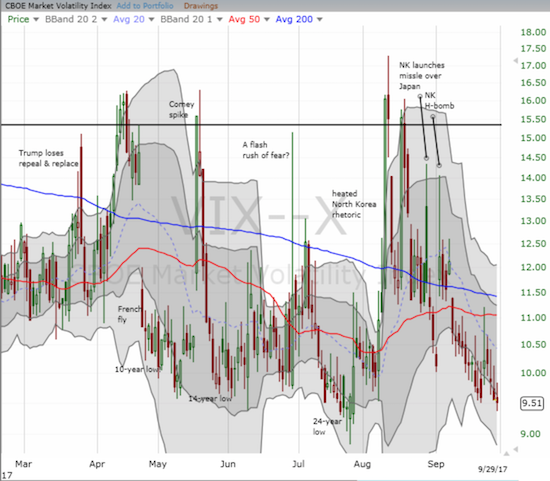
VIX = 9.5
Short-term Trading Call: bullish
Commentary
It looks like an overbought rally is truly underway.
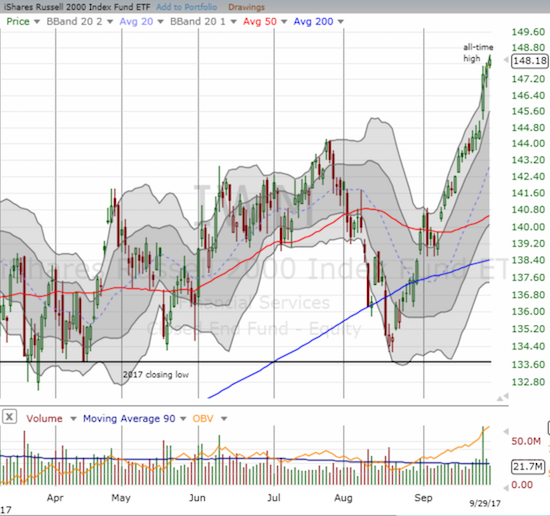
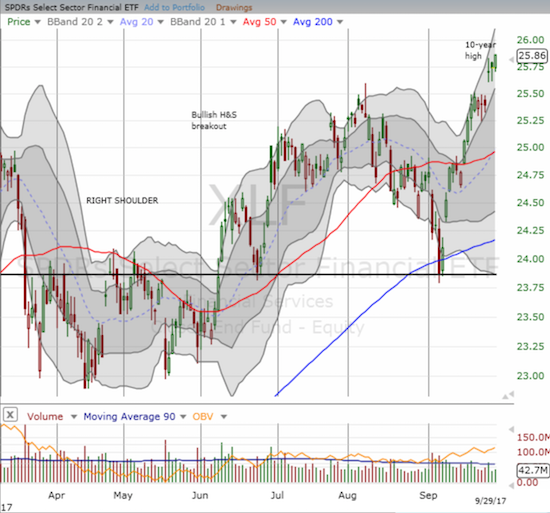
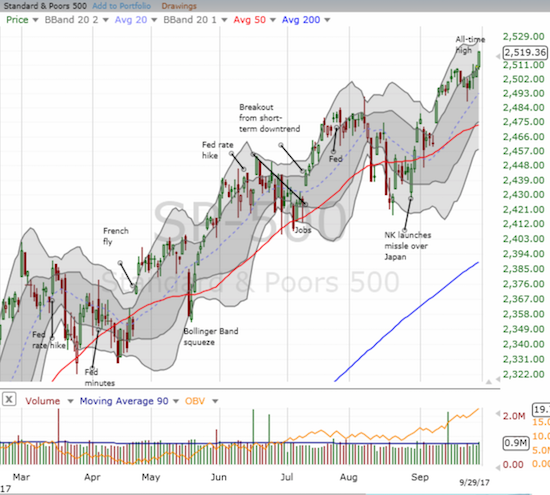
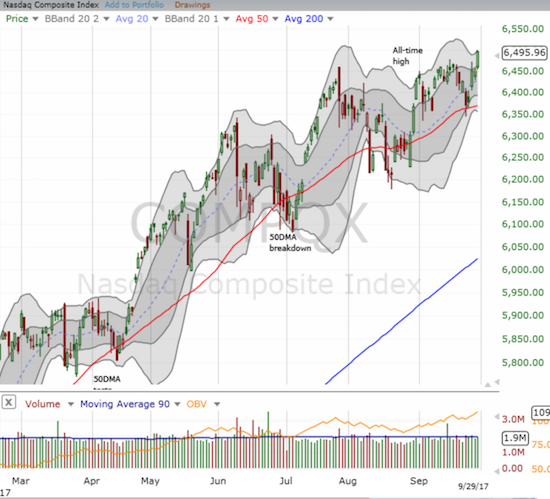
AT40 (T2108), the percentage of stocks closing above their 40-day moving averages (DMAs), closed at 71.3%, the second day of the overbought period. The iShares Russell 2000 ETF (IWM) gained for the 6th day in a row and the 23rd day of the last 28 since retesting its 2017 low. The Financial Select Sector SPDR ETF (XLF) closed at a fresh 10-year high by notching its 11th daily gain out of the last 16 days after retesting support formed from the 2017 breakout point in February. The S&P 500 (SPY) hit a convincing all-time high. The NASDAQ hit a new all-time high. The PowerShares QQQ ETF (QQQ) gained 0.7% but stopped well short of a new all-time high.
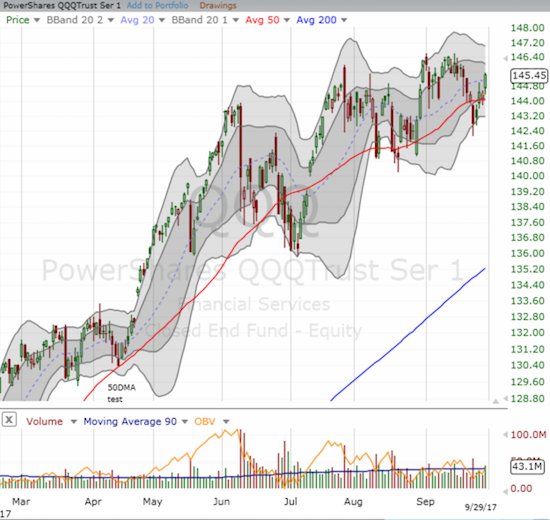
Per the plan I laid out in my last Above the 40 post, I am looking to load up on QQQ call options. I started on Friday when a lowball offer triggered, but I decided to take profits after the stock market rallied nicely into the close. I have also added XLF to my buy list.
The volatility index, the VIX, closed at a new low for this cycle. The VIX continues a creep toward history – a 24-year low and perhaps a new all-time low – which confirms the bullish sentiment.
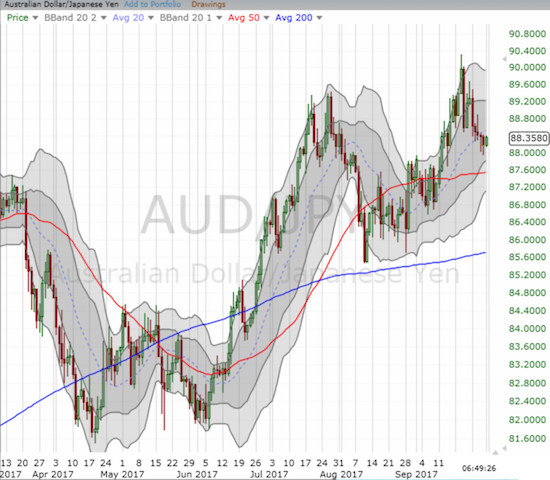
On the currency side, the Australian dollar is NOT confirming market bullishness. The currency hit a patch of weakness over the last week and a half. My favorite indicator, AUD/JPY, the Aussie against the Japanese yen, has dipped without breaking support. So while AUD/JPY is not flagging any bearishness, its failure to confirm bullishness is a mild warning to watch. I referenced the currency in an earlier post on iron ore.
October is the last of the three seasonally weak months, but there are no signs to indicate the month will deliver. Even if a sell-off finally erupts, the angst will most likely provide a very valuable dip to buy to play a rally as the seasonally strong period launches in November.
STOCK CHART REVIEWS
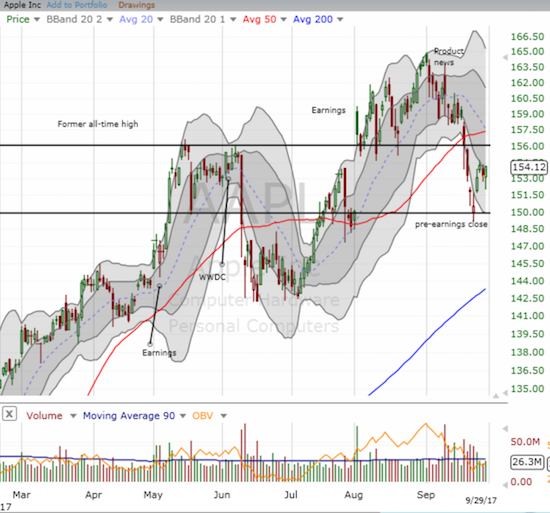
Apple (AAPL)
I do not (yet) have a play for call options this week for AAPL. Somehow the intraday dip on Friday did not trigger my lowball offer. I will be looking for a new entry on Monday and/or Tuesday.
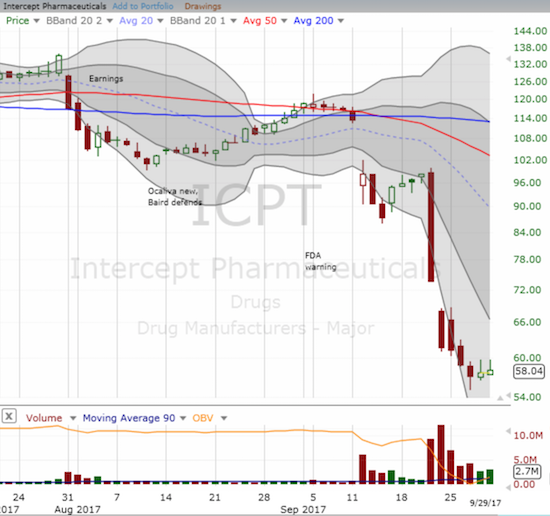
Intercept Pharmaceutical (ICPT)
I finally covered my short on ICPT as my hedging call option expired on Friday. The timing seemed right as it looked like ICPT was about to confirm a bottoming process. Instead, the stock faded from its high of the day two days in a row. I will likely go back to shorting if ICPT breaks below the recent low. I am undecided on how to play the stock, if at all, if a rally does ensue.
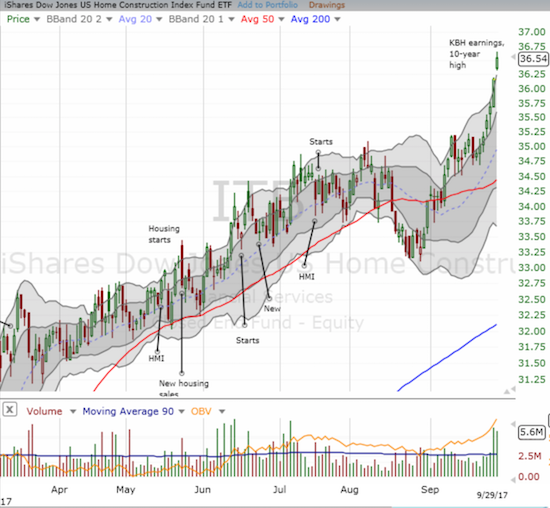
iShares US Home Construction ETF (ITB)
It looks like I will not get an opportunity to buy back into home builders at discount pricing! ITB tacked on another 1.0% on its way to a fresh 10-year high. ITB alone screams bullishness for the stock market.
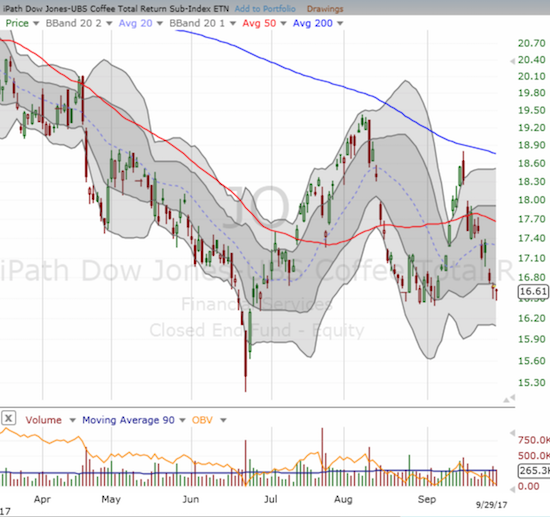
iPath Bloomberg Coffee SubTR ETN (JO)
I have stalked JO for a long time, watching its moves from week-to-week. I finally jumped aboard on Friday as JO retested support from its August low. I think the downside risk is limited to the June low. The downtrending 200DMA keeps coming up as tough upside resistance. I like trading coffee because its demand is strong and secular. The bout of weakness in 2017 is bound to transform into a strong rally at some point in the coming year or so – that’s my bet anyway!
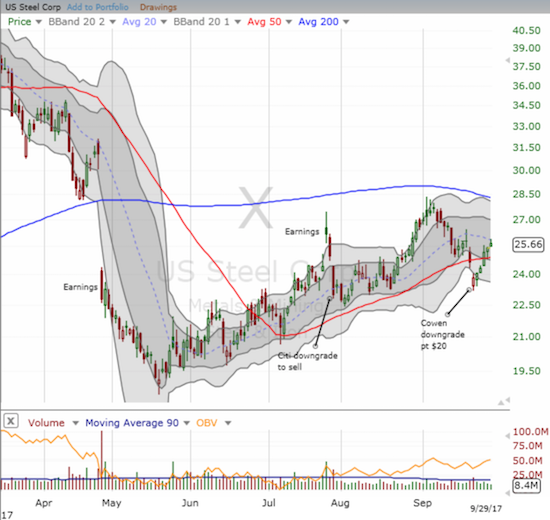
U.S Steel (X)
U.S. Steel looked “done” after a downgrade from Cohen punched it below 50DMA support. I dared to double down on my call positions anyway – so far, so good. X has rallied a surprising 5 days in a row. I am now looking for a retest of 200DMA resistance.
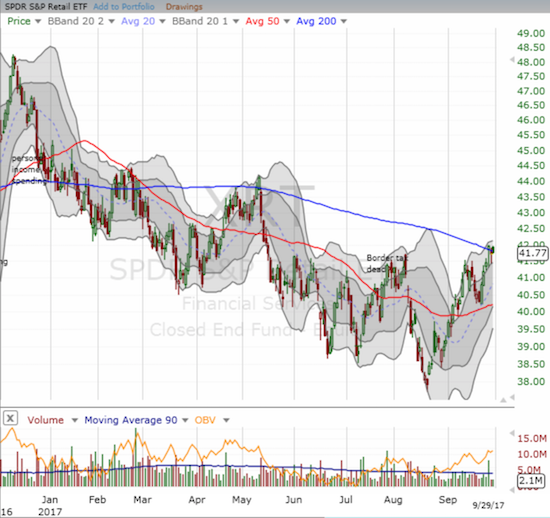
SPDR S&P Retail ETF (XRT)
Toys R Us filed for bankruptcy on September 19, 2017. According to the Washington Post, the company’s $7.5B in debt could cause a ripple effect in the industry as a small panic ensues. XRT dipped further on the heels of the news, but is now motoring higher. I am watching closely to see whether the ETF can finally break free of 200DMA resistance and confirm the breakout. Such a move would be incredibly bullish given all the negative news weighing heavily on retailers.
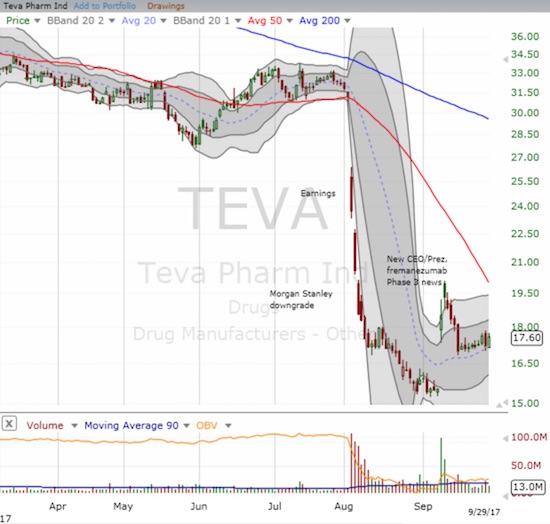
Teva Pharmaceutical Industries Limited (TEVA)
My sale of TEVA call options turned out to be well-timed. I am now looking to roll back in as 20DMA support holds. I was wondering whether I would get the next opportunity on a complete gap fill.
— – —
FOLLOW Dr. Duru’s commentary on financial markets via email, StockTwits, Twitter, and even Instagram!
“Above the 40” uses the percentage of stocks trading above their respective 40-day moving averages (DMAs) to assess the technical health of the stock market and to identify extremes in market sentiment that are likely to reverse. Abbreviated as AT40, Above the 40 is an alternative label for “T2108” which was created by Worden. Learn more about T2108 on my T2108 Resource Page. AT200, or T2107, measures the percentage of stocks trading above their respective 200DMAs.
Active AT40 (T2108) periods: Day #402 over 20%, Day #216 over 30%, Day #16 over 40%, Day #15 over 50%, Day #11 over 60%, Day #2 over 70% (overbought)
Daily AT40 (T2108)
")
Black line: AT40 (T2108) (% measured on the right)
Red line: Overbought threshold (70%); Blue line: Oversold threshold (20%)
Weekly AT40 (T2108)

*All charts created using freestockcharts.com unless otherwise stated
The charts above are my LATEST updates independent of the date of this given AT40 post. For my latest AT40 post click here.
Related links:
The T2108 Resource Page
You can follow real-time T2108 commentary on twitter using the #T2108 or #AT40 hashtags. T2108-related trades and other trades are occasionally posted on twitter using the #120trade hashtag.
Be careful out there!
Full disclosure: long JO, long X calls
*Charting notes: FreeStockCharts.com uses midnight U.S. Eastern time as the close for currencies. Stock prices are not adjusted for dividends.
With your previous reply, there is no turnover yet of leading indicators and no sign at all of US recession. However, I do wonder whether PMI’s have formed a short term peak at 60 a few months ago in the US. I don’t think it is likely to get better than that and a pullback to 55 would not be unusual. They with the recent weak inflation numbers might bring back recession fears.
The fed funds rate, if they raise in December would be more than the 10 year rate at the lowest period in the cycle. Historically recessions have occurred 6-30 months after this. This time could be different or it may take the longer end of the range. Given what the growth momentum was before the hiking cycle started, on this side monistic basis, one would tend to think the lag to recession would be lower.
SPX is strong still but I am really tempted to go long volatility next week. It feels like there is nothing on the horizon but everything is too good. The pricing in oarticular is great for volatility here. So I will be looking for signs of a short term topping process in the next 2 weeks in SPX. I may gut even enter a starter in VIX next week.
A guy I spoke to about 10 years ago told me that it takes about 7 years once you start seriously thinking about retiring. I didn’t understand what he was talking about at the time but I do now. I think it is good to have a clear goal. He also told me that he thought small cap 10 baggers are the way to go. That was not something that cohered with me but he was right that you need to look out for 10 baggers and they will move you there.
I might join you with the long coffee. Have been watching that.
Back to the 10 baggers, I expressed it incorrectly above. What didn’t cohere for me was the idea of buying small and mid caps for10 baggers returns in normal conditions. The fellow I spoke to was able to do this well but I don’t have this ability. What I have found works for me is buying when there is wholesale institutional liquidation. The risky stuff, small caps and stuff emerging from bankruptcy can do at least 10x. That is my goal this cycle. To be able to buy that sort of stuff in scale with capitulation selling. DD, we have both been in markets for long enough that we should be able to do this by now. I think the next step is to very carefully plan how that occurs and be patient.
I was listening to an audiobook of Ben Grahams securities analysis last week. Something I hadn’t noticed is the way he described the 1929 market very well. He wrote the book in the late 30’s or early 40’s. The 1929-1932 market was diabolical in that after falling 50%, it bounced, then proceeded to fall another 80%, destroying most investors. I think the only advantage of learning how to trade is to have the skills to play that sort of market. I think my goal is still to buy distressed junk at a low level with a wide stop and to be able to absorb that if it isn’t the bottom. However a moderate allocation e.g 400k, deployed at that juncture has a good chance of being 4M a few years later.
I think you really have to plan for that and visualise what you will do and how it could go wrong. I think it is very possible to have a significant allocation in 10 baggers. I have down it myself with 500k. I then blew about 1M shorting SPX a few years ago thinking the China scare was the next GFC. Hopefully I learnt a valuable lesson there. That loss taught me more than anything has to date. Sometimes you have to win big and lose big to learn. What it taught me is that you can make 10x taking the other side of wholesale liquidation but you’re not likely to be able to make even 2X shorting. Unless it is in a movie or something. I have met a few people who have said they made a large return buying distressed junk or real estate during a crisis but I haven’t met anyone who has made a lot shorting the market or picking a top. So I’m not sure what I was smoking when I took on the large SPX trade.
The other thing is position sizing. There are 2 ways to get leverage during a crisis. You can either buy distressed junk which may go out of business if things don’t recover or you can buy normal stuff with leverage. I am not sure which is riskier. Technically you should be able to see it through if the dividends or cash flows are more than the cost of the leverage but you may well be margined out before then. I think leverage works better with distressed real estate because you can’t or are very unlikely to be margin called.
I read a book by Phil Town and listened to a YouTube video where he described what you are supposed to during a bear market. What he says is precisely right. But he says people can do this by reading 15 minutes of finance per week (or per au or something very minimal) and subscribing to some service (like his). But there is so little chance the average investor can do this. If you can do this during a bear market – deploy capital effectively at the bottom, then you will be in the top .1% of investors and you will be likely to have very significant outsized returns. It is so simple but so insanely hard to do because there are so many ways to get distracted and stuff up.
With Phil Town and Benjamin Graham, I read all this stuff 15 years ago but I only just grasp it now fully (or so I think, but maybe I haven’t ?). I am trying to find out if there are other angles that can trip me up. I can imagine things melting up for another 3 years and I’m prepared for that. I can imagine things dipping and then powering on. I can imagine things falling apart and topping out in the next 6 months. Something else diabolical may happen. I guess that is where watching the charts can be useful. But make sure you have a plan about how to play the next bear market.
As an aside, I live in Australia which has had the most insanely long period between recessions (now about 26 years). So things can definately go for longer…
Whew. That was a lot! 🙂
I agree with everything you say. I will just say two main things…
One: During the financial crisis, I thought I had learned well from the dotcom bust that I needed to buy the panic and hold on no matter what. So I was a buyer when things first imploded in late 2008. But I went in too deep and couldn’t hold through the next wave of selling. Even worse, in February 2009, I attended a seminar hosted by ETrade featuring a very famous investor/trader (I can’t remember his name). One thing I distinctly remember from that seminar: he said “things are never coming back.” At that point I felt very smart for being bearish the market. You can imagine what happened next. When the bottom came in March, I expected even more profits. Within a blink, those shorts were blown out! It took me until 2010/2011 to finally screw my head back on right and realize that what was happening was not just another relief rally.
Now after these two experiences, you would think I will be ready to do as you say during the next panic, right? I sure hope so! My deep interest in formally developing my AT40 (T2108) analysis is to get me much more disciplined at respecting the extremes of the market. So I THINK I will be very ready for the next go-round.
TWO: I can’t honestly I say I know how to recognize and stick with the 10-baggers. It is a great skill. A friend of mine over at SwingTradeBot.com has nurtured this kind of discipline.
Regarding profits shorting versus going long, going long is definitely the higher reward/risk approach. The attraction of being short is that the money can come quickly when you get it right. But gosh timing is *everything*!