
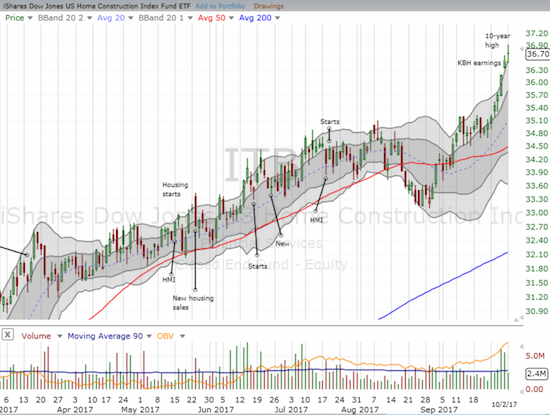
The last Housing Market Review covered data reported in August, 2017 for July, 2017. At the time, I described a change in tone that made me wary and even got me anticipating a larger pullback. The iShares U.S. Home Construction ETF (ITB) was struggling below its 50-day moving average (DMA) since a 2-month period starting in September, 2016. Soon after that post, ITB began a rally that has now taken it to a fresh 10-year high.
Source: StockCharts
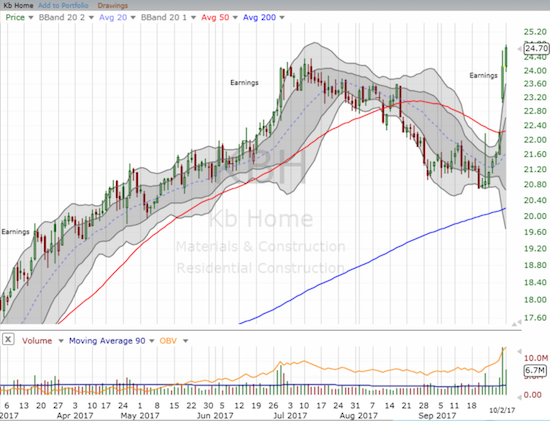
So particularly thanks to strong earnings from KB Home (KBH) the tone has changed 180 degrees. Yet, the housing data are not following the home builders to these lofty heights. In fact, new home sales look worse, builder sentiment and existing home sales have clearly topped out for the time being, and soaring home prices are seemingly raising more alarms. Housing starts are maintaining a robust uptrend but this trend could now portend a growing surplus of inventory. To be clear, I have not gone from bullish to bearish on the housing market. Instead, I have grown a lot more cautious on my bullishness.
Source: StockCharts
New Residential Construction (Housing Starts) – August, 2017
Single-family housing starts for July were revised downward from 856,000 to 838,000. August starts increased month-over-month by 1.6% to 851,000. On an annual basis, single-family housing starts soared 17.1%, well above last month’s 10.9% year-over-year jump. The first eight months of 2017 have delivered close to and above double-digit percentage gains meaning that the uptrend remains well intact.
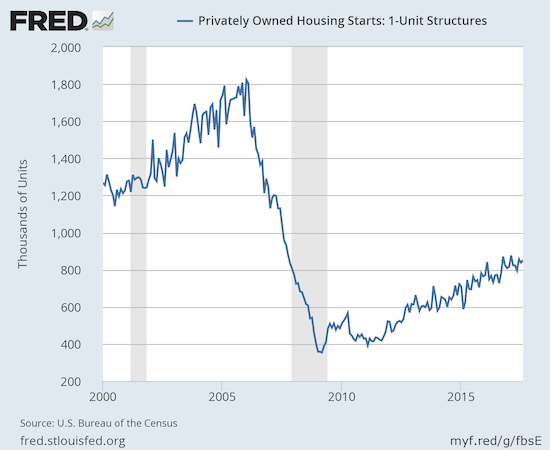
Source: US. Bureau of the Census, Privately Owned Housing Starts: 1-Unit Structures [HOUST1F], retrieved from FRED, Federal Reserve Bank of St. Louis, September 24, 2017.
After three months of wide deviations, the regional changes have been more uniform for the last three months. The Northeast, Midwest, South, and West each jumped 13.6%, 16.7%, 8.2%, and 12.9% respectively in July. For August these percentages were, respectively, 26.9%, -2.7%, 22.8%, and 14.6%.
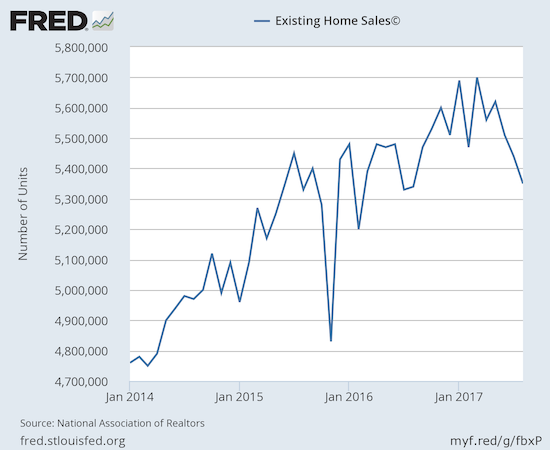
Existing Home Sales – August, 2017
The routine description for existing sales is usually sales decline because of a shortage of inventory and sales increase in spite of inventory shortages. For August, 2017, Hurricane Harvey hit Texas and Louisiana and also imposed its will on existing home sales. Sales declined on a monthly basis for the fourth month in five and marginally increased on an annual basis.
For January 2017, existing home sales hit levels not seen since February, 2007. For February 2017, existing home sales dropped sharply and rebounded sharply in March to a new post-recession high. Sales since have gone up and down like a yo-yo, but the declines of the last two months have likely confirmed a top. The NAR took this opportunity to call out a familiar problem with existing home sales:
“What’s ailing the housing market and continues to weigh on overall sales is the inadequate levels of available inventory and the upward pressure it’s putting on prices in several parts of the country. Sales have been unable to break out because there are simply not enough homes for sale.”
Hurricane Harvey had a heavy impact on sales in the South, but the NAR expects these sales to return in 2018. During the press conference, the NAR indicated it expects 2017 annual sales to go lower than 2016 because of the hurricane. Surely September’s hurricane that impacted Florida and Georgia will further dampen sales for the year.
The seasonally adjusted annualized sales of 5.35M were down 1.7% month-over-month from 5.44M in sales for July (not revised). Sales have declined 4 of the last 5 months. Year-over-year sales barely increased 0.2% (compare to the steady stream of year-over-year increases: November 15.4%, December 0.7%, January 3.8%, February 5.4%, March 5.9%, April 1.6%, May 2.7%, June 0.7%, July 2.1%). Again, I think sales have topped for now especially since seasonal forces suggest that sales peak somewhere in the Spring or Summer.
(recall that the NAR no longer makes data available before 2013. For more historical data to 1999 click here)
Source: National Association of Realtors, Existing Home Sales© [EXHOSLUSM495S], retrieved from FRED, Federal Reserve Bank of St. Louis, September 24, 2017.
First-time buyers dropped to 31% from 33%. This share has essentially been stuck in the low 30s all year. The average for 2016 was 35%. The NAR lamented with a familiar tone:
“Market conditions continue to be stressful and challenging for both prospective first-time buyers and homeowners looking to trade up…The ongoing rise in home prices is straining the budgets of some of these would-be buyers, and what is available for sale is moving off the market quickly because supply remains minimal in the lower- and mid-price ranges.”
The absolute level of inventory of existing homes fell year-over-year for the 27th straight month. Recall that during the June press conference, the NAR talked about a housing crisis in supply in some housing markets. The 1.88M homes for sale represented a 6.5% decrease from the previous August. The string of year-over-year declines has been remarkable: starting from 2016…August -10.1%, September -6.8%, October -4.3%, November -9.3%, December -6.3%, January -7.1%, February -6.4%, March -6.6%, April -9.0%, May -8.4%, June -7.1%, and July -9.0.
In December, inventory hit 3.6 months of sales and a new absolute low measured from 1999 when the NAR began tracking. At 4.2 months of sales, relative inventory stayed even with July and was down from the 4.5 months a year ago.
Investors purchased 15% of existing homes in August, a jump from July’s 13% and 12% a year ago. As I note every month, investor appetite is far from satiated.
For August, the regional performances distinctly show the impact of the hurricane as the South was the only region to fall year-over-year: Northeast +1.4%, Midwest +0.8%, South -0.9%, West +0.8%. All regions logged year-over-year price jumps: Northeast 5.6%, Midwest 5.0%, South 5.4%, West 7.7%. Note how the hurricane-driven drop in sales in the South apparently did little to nothing to slow the pace of price increases there.
August’s 5.6% year-over-year increase in the overall median price of an existing home incredibly represents the 66th consecutive month of year-over-year increases. The median price of $253,500 fell from July’s $258,800 but is still above May’s previous record of $252,800. The NAR appeared startled by May’s price surge and issued an alarm. That alarm seemed to grow in July as the NAR used the press conference to dismiss the notion of a housing bubble. In September’s press conference, the NAR used the occasion of an upcoming statement on monetary policy from the U.S. Federal Reserve to complain that the Fed does not see the price pressures from housing imposed on consumers. The Fed treats housing like an asset, similar to stocks. However, the NAR did not paint the full story because the Fed DOES include a measure of imputed rents in its inflation calculation.
For example, here is a quote from a research white paper published by the New York Federal Reserve (2015): “The single largest item in most household budgets is payment for shelter. Accordingly, ‘rent of shelter’—or housing—has a large weight in the Consumer Price Index (CPI) and the Personal Consumption Expenditures (PCE) deflator, the two major indices of U.S. consumer prices.” So I would argue that the Fed’s persistence in talking rate hikes despite an inflation rate that stubbornly remains below target could be partially explained by the Fed’s wariness, NOT ignorance, of housing inflation. Still, it is clear that the NAR gets incrementally more worried about housing inflation with each passing month.
Single-family sales decreased 2.1% on a monthly basis and increased on a yearly basis by 0.4%. The median price of $255,500 was up 5.6% year-over-year; the past four months have delivered similar year-over-year gains.
“Single-family home sales decreased 2.1 percent to a seasonally adjusted annual rate of 4.74 million in August from 4.84 million in July, but are still 0.4 percent above the 4.72 million pace a year ago. The median existing single-family home price was $255,500 in August, up 5.6 percent from August 2016.”
New Residential Sales – August, 2017
Gains in new single-family home sales for May cooled down the near panic over the three straight months of decline in housing construction. Unfortunately, sales took a particularly large plunge in July that threatened to break the years-long uptrend. For August, hurricane-impacted sales numbers have put the uptrend further in jeopardy.
The Census Bureau revised July sales of new single-family homes upward from 571,000 to 580,000. New home sales for August dropped 3.4% month-over-month and dropped 1.2% year-over-year to 571,000.
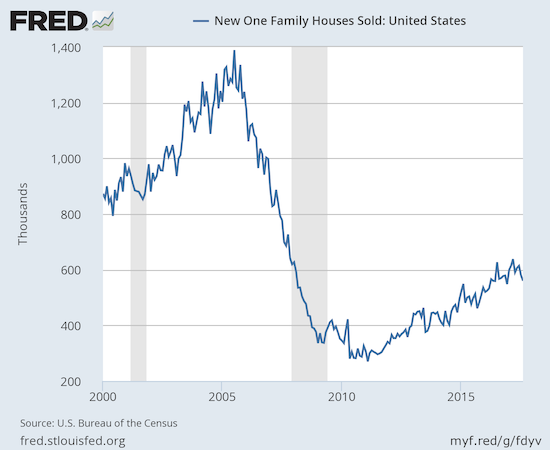
Source: US. Bureau of the Census, New One Family Houses Sold: United States [HSN1F], retrieved from FRED, Federal Reserve Bank of St. Louis, September 27, 2017.
New home inventory increased from 5.8 to 6.1 months of supply. A market for homes is in balance at 6 months of supply. However, inventory has not been this high since October, 2011 – around the trough of the housing bust. Since inventory has been slowly increasing all year, I do not think this latest jump can be discounted as a hurricane effect. I am not yet alarmed by the inventory trend, but I will be if prices start downward alongside increasing inventory. The median price of $300,200 is down significantly from July’s $319,900 but is up slightly from a year ago at $298,000. These dynamics will be extremely important to watch in coming months. I find it ironic that the market responded to the new home sales report by sending the iShares US Home Construction ETF (ITB) to a new 10+ year high on the day.
On a regional basis, new home sales returned to very divergent results. The Northeast rebounded sharply with a 65.2% year-over-year gain. The Midwest and the West also gained 4.5% and 4.3% respectively. The South declined 9.2%, most likely a hurricane effect.
The distribution of sales across price changes took on some extremely large shifts. They were dramatic enough for me to put aside my observations from the last several Housing Market Reviews. The most dramatic shift came at the mid-range with the percent of sales surging from 30% to 36%, three percentage points higher than a year ago. Share in ALL other price ranges fell except at the highest range, $750,000+, which remained flat at 6%. If this shift sustains, it could flag a deterioration in certain markets. Again, however, shifts in these price distributions have exhibited volatile behavior this year.
Note that the Census Bureau released a series of corrections to historical data on new residential sales. From the report:
“Median and average sales prices in Table 1 and sales price distributions in Table 2 have been corrected for October 2014 through January 2017 to include additional response data that had been omitted from previously tabulated estimates. Monthly median and average prices were revised downward about 1.2% on average. U.S. total quarterly and annual prices had somewhat larger downward revisions of up to 4.2%.”
Home Builder Confidence: The Housing Market Index– September, 2017
In March, builder confidence soared to a new 12-year high at 71. The HMI remains stalled just under that 12-year high. April dropped to 68, May increased just a point to 69, June dropped to 66, July dropped further to 64, August bounced back to 67, and September dropped back to 64. The National Association of Home Builders (NAHB) flagged the recent hurricanes for weighing on sentiment: “The recent hurricanes have intensified our members’ concerns about the availability of labor and the cost of building materials…Once the rebuilding process is underway, I expect builder confidence will return to the high levels we saw this spring.”
I am a bit skeptical of this claim because the rebuilding process will most likely confirm the concerns of builders. I have already heard anecdotes from Houston about the extreme scarcity of contractors and the resulting inability to get rehabilitations done.
The increased demand from rebuilding can only exacerbate already pre-existing shortages. As a reminder for comparison, here are the concerns stated in the June HMI:
“As the housing market strengthens and more buyers enter the market, builders continue to express their frustration over an ongoing shortage of skilled labor and buildable lots that is impeding stronger growth in the single-family sector.”
My earlier expectation for a new post-recession high is essentially null and void at this point. All three components of the Housing Market Index (HMI) suggest that new highs are out of reach for this year. Single-family detached present is back to its lowest point of the year and has taken on a slightly downward bias. Single-family detached next six months just keeps bouncing between a tight range. The traffic of prospective buyers has trended downward since it hit a peak in March of this year.
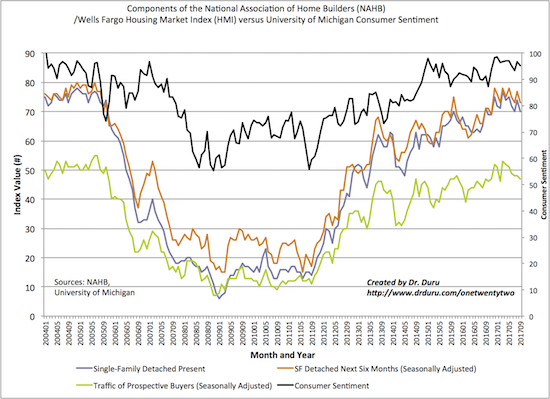
Source: NAHB
For May and June, there was an interesting disparity in the regional changes in HMI. In May, the West finally broke out from the flatline of the previous 4 months with a 80 reading. The West plunged in June back to 71 to a near 1-year low. For July, the West increased to 74 and for August it came within 1 month of the high from May. The South made the most improvement with an over 10% pop back to within 1 point of the year’s high of 71. The disparities in September seemingly confirm that a top is in for the year. The Northeast continues to show little momentum (since April) as its HMI increased by a point. The Midwest and the South were major drags with drops of 6 and 4 points respectively. The West stands out as it increased by 2 points and sits within 1 point of the year’s high set in May.
Parting thoughts
Issues of housing affordability continue to attract an increasing portion of the time I dedicate to studying the housing market. This past month, two stories about the impact of unaffordable housing caught my attention: Oxford, Mississippi and Tahoe, CA.
Oxford, Mississippi
The story on Oxford, MS surprised me because I think of Mississippi as having a very low cost of housing and living. It turns out both are true but wages for low-income earners are low enough to make housing unaffordable even in MS.
Oxford is a college town housing the University of Mississippi. Apparently, students and working class residents alike have a hard time affording rent. Earlier this year, the town hosted a forum called “Ideas On Tap: What Happened to Affordable Housing?” The city’s plan to close down an affordable housing complex caused concern as many residents, transitional vouchers in hand, were struggling to find new housing. Some residents opposed a plan to build a new affordable housing complex in a wooded area that they thought should be preserved. One participant in the forum worried that Oxford would turn into a city available only to the upper-class. Students in the School of Journalism and New Media at the University of Mississippi created a series dedicated to affordability issues. Last year, Mississippi Today went as far to declare a housing crisis created by a combination of high rents and low wages.
In other words, affordability issues are not the preserve of heavily populated coastal regions. The dynamics of a growing housing crunch are playing out across the spectrum.
Tahoe, CA
The Tahoe area has perhaps a more predictable housing affordability problem. The area is full of expensive vacation homes that are not inhabited year-round. Rentals to vacationers can squeeze out vacancy for the service workers required to keep the tourism industry humming. Many workers try to live in cheaper Reno and commute for about an hour into Tahoe. Yet, with unemployment extremely low in Reno, the long commutes quickly become unattractive to these workers.
The mismatch between housing stock and housing seekers became so acute that Tahoe and Truckee, California formed The Mountain Housing Council to address the problem. In a meeting launching the Council, the mayor of Truckee, Morgan Goodwin, revealed how he felt the issues of housing availability at a personal level:
“‘I have a confession to make…I am a renter.’ Goodwin said he was recently given notice to relocate after his landlord decided to use the home to vacation in over the summer.”
Here is the mission statement for The Mountain Housing Council:
“Welcome to the Mountain Housing Council of Tahoe Truckee. This Council brings together a wide range of committed stakeholders to take on the unique and pressing challenges of housing in the North Tahoe-Truckee region: availability, variety and affordability. The goal is to build on what was learned in the 2016 Regional Housing Study, to accelerate solutions to the region’s housing problems, and to bring together government agencies, developers, land owners, nonprofit organizations, businesses, potential funders and the people of the region to implement those solutions.”
The Council describes the affordability problem this way:
“Of those who are living here full time, 67 percent are paying more than 30 percent of their income (considered overpaying), while 26 percent are paying more than half their income for housing. Within the 474 below market rate units in the area, zero are available, with waits of 6 months to 2 years.
All those numbers add up to teachers who can’t afford to live here, employers unable to staff their businesses, and would-be community members that contribute to our economy, our culture and our vitality – moving away.”
As if to confirm its seriousness, the Council provides an extensive list of resources for anyone concerned about housing affordability. The list includes references to a number of housing innovations and services. The site also includes two video interviews of businessmen who took matters into their own hands. One is from long-time Tahoe businessman David Wilderotter of Tahoe Dave’s. Wilderotter vouches for his seasonal employees with landlords by guaranteeing rent will be paid. He even helps with rental deposits and provides mortgage assistance for those with good credit who want to be more permanent residents. Wilderotter has also bought some property to provide employee housing.
A KEY quote (at the end of the video): “…I am buying this house as an investment in my employees, and I’ll make my money on THEM, not the house. Eventually, maybe I can even turn that house over to a good employee, and then I’ve got a guy forever.”
Andrew Laughlin of Tahoe City Kayak and Sand Harbor Rentals deployed similar strategies after one summer having to work 7 months with only two TOTAL days off.
The videos struck me because I have long marveled at the stickiness of wages for service and lower-income workers in the face of spiraling housing costs. These Tahoe area businessmen provide unique cases of businesses stepping up to make sure that housing costs do not cause labor shortages. Buying multi-family dwellings strikes me as a particularly effective way of controlling housing costs for workers. These stories indicate a labor market dependent on workers who already live elsewhere and thus are mobile and likely to find other job options. These businesses are forced to compete.
As the housing data demonstrate, affordability and availability issues are not going away anytime soon. Without deeper solutions, this brewing crisis has the potential to harm the housing industry in general. Given that potential, I will continue to highlight regional stories that uncover the extent of the problem and/or provide hope for solutions.
Be careful out there!
Full disclosure: no positions
DD, I am wary of housing affordability arguments. I think the liquidity effects swamp that. It will be interesting to see if the slowing from interest rate rises is a blip or whether it causes the housing market to roll over. I think it is too early to say and am skeptical but who knows.
I live in Sydney where the average house price is 1.1M now. I think it is about 20x average earnings or something. So anyone bearish on house prices on valuation alone has been crushed. So affordability is one factor but not a very important one recently.
Thanks for your thoughts on my weekend brain explosion. There are just so many ways to stuff up what seems very easy, your experience of shorting 2009 reminds me of being short AUD at the end of the China scare. I think the main benefit from being in contact with good traders is that they will tell you when you are on the wrong side. I remember speaking to a fellow trader and he said “B, commodities aren’t in a bear market anymore@”. Now I didn’t like hearing this at the time but then I looked at the chart and thought F@& me dead, he is right, WTF am I doing with this massive short AUD position. I am going to get absolutely annihilated. So I got out at a big loss but didn’t lose my shirt.
I heard a great description of the game of shorting today. The bloke said it was like betting on who would win in a chess game. So it is silly to do this at the beginning because it is just a crapshoot (50/50). It’s also not optimal to take a position in the middle of the game when things are still evenish. You want to take a position when it becomes obvious who will win, about 2/3 through. I would add to the analogy that shorting is like picking who will win in a chess game with a twist that at the end of the game, or when one of the players loses in the chess game, the whole game blows up and if you are still holding your position you lose everything. Or everything you have gets given to the other side. So to short successfully you have to pick who will win and get the hell out of there before the game finishes because if you are still holding at the end, the whole situation reverses and you are likely to be blown to smithereens with one powerful rally. It is truly bad being short at the end of a bear market !
The buying junk at the bottom is like picking up stuff when it looks dead. I am still thinking of a good analogy but I can’t think of one. The only thing I can thing of is that of picking up a player after they’ve been left for dead and beaten senseless by the mob. But they can’t actually be dead. If they are dead, it is not such a good choice pick.
>During the financial crisis, I thought I had learned well from the dotcom bust that I needed to buy the panic and hold on no matter what. So I was a buyer when things first imploded in late 2008. But I went in too deep and couldn’t hold through the next wave of selling.
Very true. I have this disease called going in too hard, too early also. I think the way to get around that is to consciously be very, very lazy and slow with getting in. and then only 1/4 of the position in a bear market. Another 1/4 at what is perceived as the bottom, the other 1/4 when it goes another 20% below that and the other 1/4 on the way up. This would have not worked in the 1929 market though so perhaps it is better to forget about the scaling in and just have one level with a stoploss. But then who can pick the bottom and you risk missing it. Probably best to scale in with a stoploss. Or scale in with no stoploss and no leverage. I am still pondering this and my inclination is the latter.
I’m listening to the macrovoices podcasts on YouTube at the moment. It is good stuff.
Regarding the housing market: I am not making any specific projections on housing here, and rarely do. What I am saying is that I see the affordability issue looming larger and larger. There are clearly still buyers out there at the high price points and who knows when they run out (foreign buyers are certainly helping). I am diving back into the earnings reports of builders to have more to say on this.
Regarding shorting: you are basically referring to the old adage that ends with “pigs get slaughtered.” When you are short, you simply cannot afford to try to squeeze out every penny of profit. Because when the turn comes, it can be fast and furious and send every seller running. The last thing you want as a short is to stand there as the herd of buyers comes stampeding in!
I think my AT40 (T2108) framework will come in handy in the next big sell-off. With hindsight, scaling in 2008 in a retirement account would have made the most sense. Instead, I was mainly gunning in a trading account. My thinking was that I wouldn’t touch the retirement account until I was very confident about the bottom. Of course, while I was trying to screw my head back on post-2009, I failed to invest in much for the long-term. From a trading perspective, I need to be faster with the stop losses so that I would have the will and cash to play the next round the market delivered!
I follow Australia pretty closely. The housing market has been truly astounding in the major cities (excluding Perth of course). I see affordability issues becoming very acute there. I even saw a conference of economists and policy makers last year talking about bringing in rent control for the first time in Australia. Sure the housing market may not implode, BUT the problems are real and getting acute!