
AT40 = 53.0% of stocks are trading above their respective 40-day moving averages (DMAs)
AT200 = 51.1% of stocks are trading above their respective 200DMAs
VIX = 10.7 (down 11.5%)
Short-term Trading Call: neutral (see below for caveats)
Commentary
I had no idea that the previous tensions in the stock market fully priced in the likely economic damage from Hurricane Irma, the possible turmoil of budget ceiling battles in the U.S. political machinery, and/or the potential for another missile test from North Korea over the weekend. Yet, pundits seemed to use some combination of relief from these three catalysts to explain the market’s big rally on September 11th – a day on which Americans take pause to honor those lost 16 years ago to terrorism and to forget (briefly) our internal differences and strife.
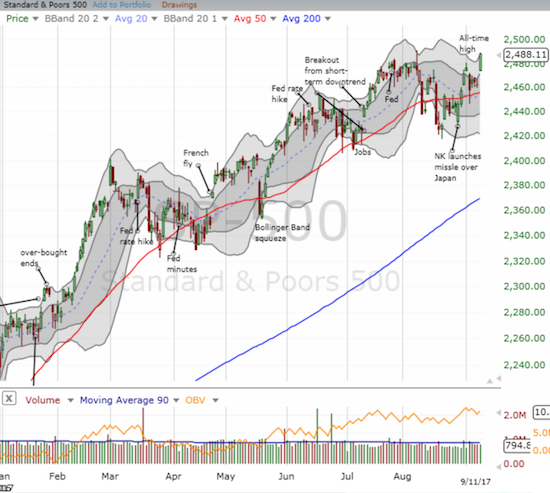
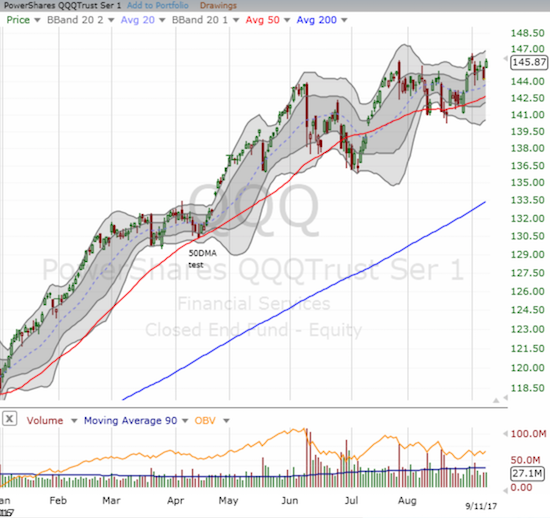
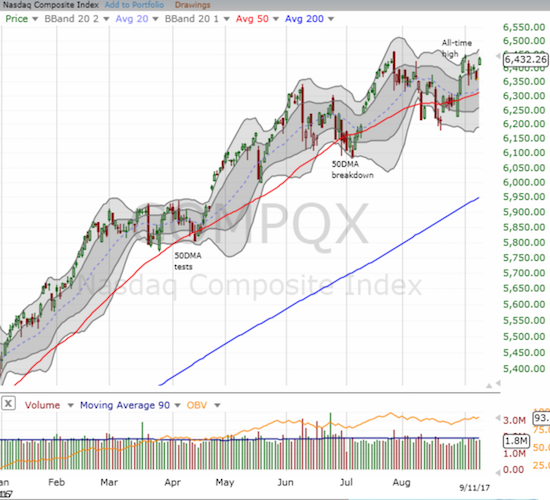
The S&P 500 (SPY) gained 1.1% to a new all-time high. One more day of buying will force me to switch my trading call from neutral to cautiously bullish. I will only reluctantly make this change given the calendar is still in the seasonally weak period for the stock market. The NASDAQ gained 1.1% and the PowerShares QQQ Trust (QQQ) gained 1.2%. AT40 (T2108), the percentage of stocks trading above their respective 40-day moving averages (DMAs), definitively confirmed the bullishness of the day by running all the way up from 44.9% to 53.0%.
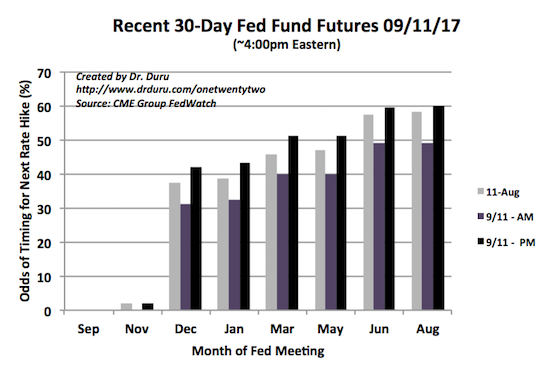
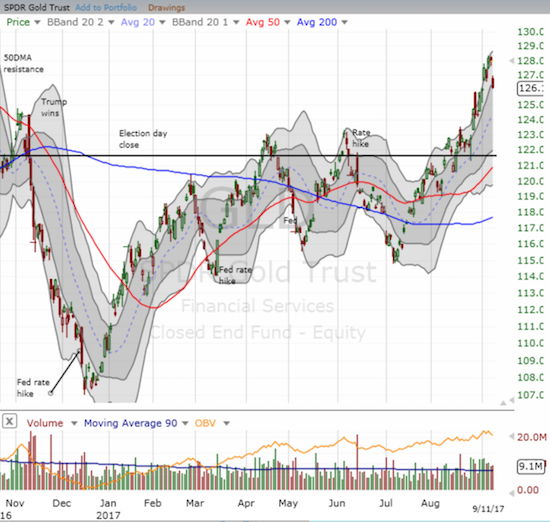
The 30-Day Fed Fund Futures provided another clear example of the burst of euphoria that came out of the day’s trading. I checked the futures early in the morning about 5 hours before U.S. trading began and then again 10 hours after trading ended. Before trading began, the market fell just short of believing in a 50/50 chance of the timing for the NEXT rate hike from the U.S. Federal Reserve to come in June or August of 2018. After good tidings swept through the market, those odds surged such that the timing moved forward to March, 2018. The impact sent U.S. treasury yields higher, the U.S. dollar off its latest bottoming attempt, and precious metals down to the bottom of uptrend channels.
Given my short-term bullishness on gold and silver I used this opportunity to load up on a new tranche of call options on the iShares Silver Trust (SLV) expiring in October.

The day’s celebration also drove the volatility index, the VIX, right back to an extremely low level. When I last studied the data on periods of extremely low volatility, I concluded that September would be the time bullish implications for extremely low volatility finally came to an end. Instead, traders tamed volatility once again. For good measure, I took advantage of the lower prices to add another call option on ProShares Ultra VIX Short-Term Futures ETF (UVXY) as a hedge against bullishness.
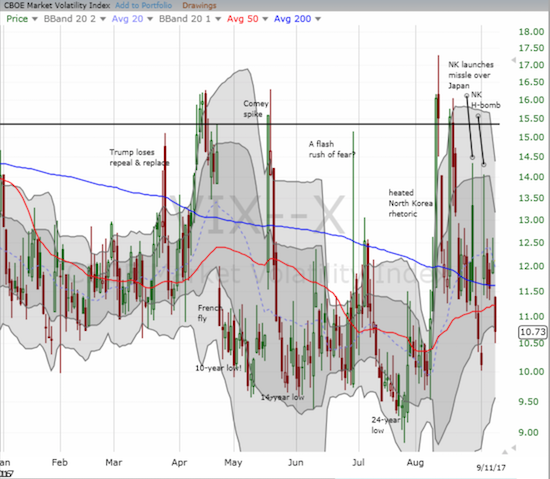
I will need to revisit my study of periods of extremely low volatility and reassess the way I project out the potential end of the period. Specifically, I need to take better account of what happens when the VIX falls in and out of extremely low levels in rapid succession.
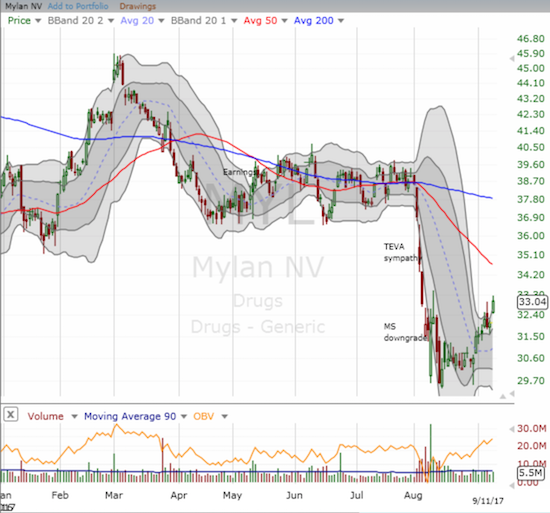
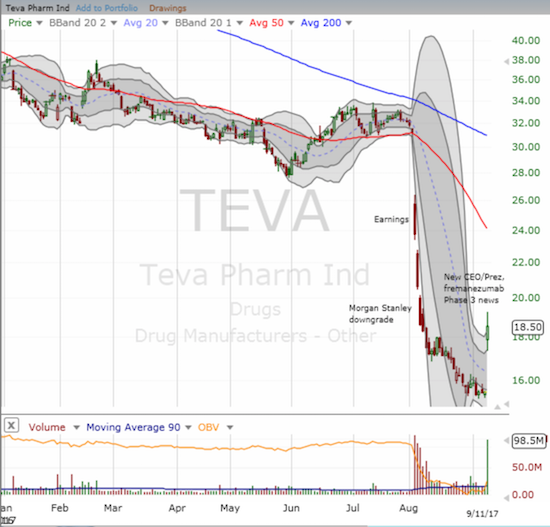
I am long overdue for an update on my trade on Mylan (MYL) and Teva Pharmaceuticals (TEVA) from a month ago. MYL swooned one more time after I posted on the trade. The recent bounce off the bottom brought my position into a marginal profit. I had more conviction on TEVA, but the stock kept selling off for the rest of August. Thinking I may have been overly aggressive in accumulating call options as the stock sank, I started buying shares that I planned to hold past the October expiration of the call options. Good news came in the form of a new CEO/President and promising results from a drug trial in Phase 3. TEVA at one point gapped over 22%; the stock ended the day with a 19.4% gain. I sold my shares and kept my call options (which almost got back to even!).
Some other quick trading updates…
- For those of you who caught my lamenting on IHS Markit (INFO) and bought on my stubborn refusal to let go of the investment, you are now sitting on a 10% or so gain. INFO made a very marginal new all-time high on the day.
- InterXion (INXN) has resumed a robust uptrend and left a trail of new all-time highs since its last breakout in mid-July.
- Surprisingly, the iShares U.S. Home Construction ETF (ITB) has traded right back to its high from 5 weeks ago. In my last Housing Market Review, I noted a change in tone that appeared to portend more selling pressure for home builders.
- Apple (AAPL) obliged this week’s round of call options with a jump of 1.8%. As promised, I promptly took my profits ahead of the company’s product announcements on the 12th.
- {Updated 9/12/17 after reviewing trade executions} NVIDIA (NVDA) popped a healthy 3.2% and once again confirmed 50DMA support. I took profits on the call option I bought Friday.
- Blue Apron (APRN) is still roughly flat from my speculative purchase a month ago. The good news is that the stock looks like it is forming a solid base. The Bollinger Bands (BB) are tightening and tilting ever so subtly toward an upside breakout. A new low invalidates this trade.

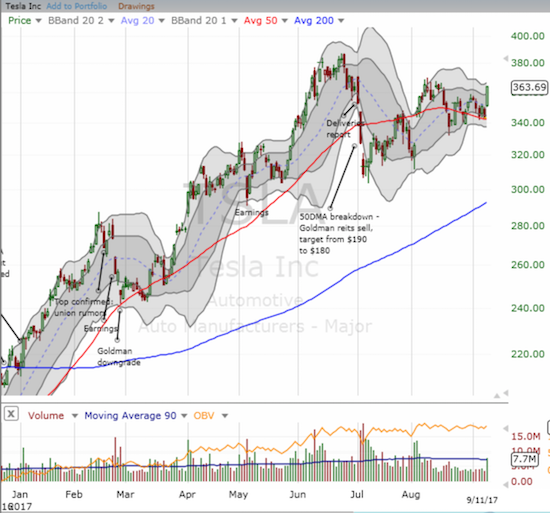
Tesla Motors (TSLA) provided yet one more sign of the good times for the market…and ended the chances that my put options bought as a hedge will close in the green. TSLA soared a very convincing 5.9% with a move that definitively confirmed 50DMA support.
— – —
FOLLOW Dr. Duru’s commentary on financial markets via email, StockTwits, Twitter, and even Instagram!
“Above the 40” uses the percentage of stocks trading above their respective 40-day moving averages (DMAs) to assess the technical health of the stock market and to identify extremes in market sentiment that are likely to reverse. Abbreviated as AT40, Above the 40 is an alternative label for “T2108” which was created by Worden. Learn more about T2108 on my T2108 Resource Page. AT200, or T2107, measures the percentage of stocks trading above their respective 200DMAs.
Active AT40 (T2108) periods: Day #392 over 20%, Day #206 over 30%, Day #6 over 40% (overperiod), Day #23 under 50% (underperiod), Day #29 under 60%, Day #152 under 70%
Daily AT40 (T2108)
")
Black line: AT40 (T2108) (% measured on the right)
Red line: Overbought threshold (70%); Blue line: Oversold threshold (20%)
Weekly AT40 (T2108)

*All charts created using freestockcharts.com unless otherwise stated
The charts above are my LATEST updates independent of the date of this given AT40 post. For my latest AT40 post click here.
Related links:
The T2108 Resource Page
You can follow real-time T2108 commentary on twitter using the #T2108 or #AT40 hashtags. T2108-related trades and other trades are occasionally posted on twitter using the #120trade hashtag.
Be careful out there!
Full disclosure: long SLV shares and calls, long GLD, long TSLA puts, long UVXY calls, long TEVA calls, long MYL calls
*Charting notes: FreeStockCharts.com uses midnight U.S. Eastern time as the close for currencies. Stock prices are not adjusted for dividends.