
AT40 = 48.1% of stocks are trading above their respective 40-day moving averages (DMAs)
AT200 = 55.4% of stocks are trading above their respective 200DMAs
VIX = 12.5 (volatility index)
Short-term Trading Call: neutral
Commentary

Diabolically, the stock market has put my head on the proverbial swivel.
I earlier noted how the NASDAQ in particular has bounced up and down like a yo-yo from day-to-day with a downward bias but to start this week I found comfort in a bullish rotation out of tech stocks into the rest of the stock market. Conditions deteriorated so much from there that today I downgraded my short-term trading call from cautiously bullish to neutral.
On Wednesday, tech stocks stuck to the yo-yo theme. The NASDAQ gapped away from its lower-Bollinger Band (BB) and returned to resistance at its 50-day moving average (DMA). The PowerShares QQQ ETF (QQQ) also traversed the entire range of its lower-BBs. Unfortunately, “conservation of energy” applied itself this time by sucking money out the rest of the market. AT40 (T2108), the percentage of stocks trading above their respective 40DMAs, lost all its gains from the previous trading day before bouncing off that low slightly. It was a move abrupt enough and deep enough to raise my alarm bells. As a reminder, when AT40 fades away from the overbought threshold (over 70%), I tend to get relatively more bearish on the stock market: I treat such a move as indicative of buyer’s exhaustion. In this case, I waited for confirmation, and Thursday delivered big-time confirmation!
During trading today (Thursday, July 6, 2017) AT40 essentially plunged. My favorite technical indicator lost another 11 percentage points and closed at 48.1%. This move was indicative of a poor day on the market. The NASDAQ lost 1.0% and closed at a new 7-week low. QQQ fared slightly better with a 0.9% loss and bounced from its low to avoid closing below Monday’s low.

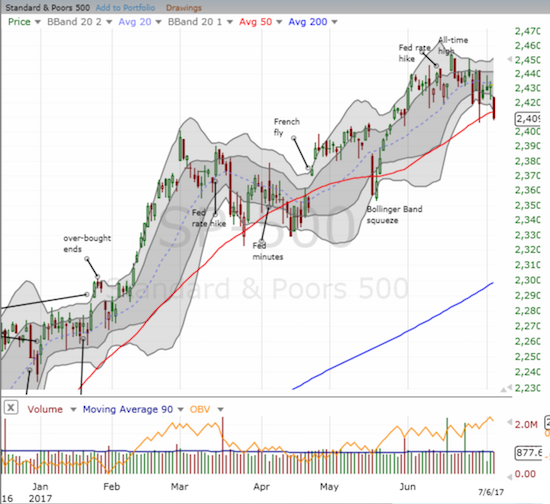
This time, the money running from tech did NOT help the rest of the market. Indices and ETFs took hits, some quite heavy. The Financial Select Sector SPDR ETF (XLF) lost 0.7%. The Energy Select Sector SPDR ETF (XLE) lost 1.1%. The SPDR S&P Retail ETF (XRT) lost 2.2%. REITs were slammed with the Dow Jones Equity All REIT Total losing 1.8%. The iShares Russell 2000 ETF (IWM) lost 1.7%. The S&P 500 (SPY) managed to eke out a small gain on Wednesday but luck ran out today as selling pressure broke down the index. The S&P 500 lost 0.9% and managed to close below its 50DMA for the first time since mid-May.
With selling pressure felt throughout the market, the volatility index, the VIX, further confirmed the ominous mood by jumping 13.3%. The VIX now looks ready to make another run at the all-important 15.35 pivot.
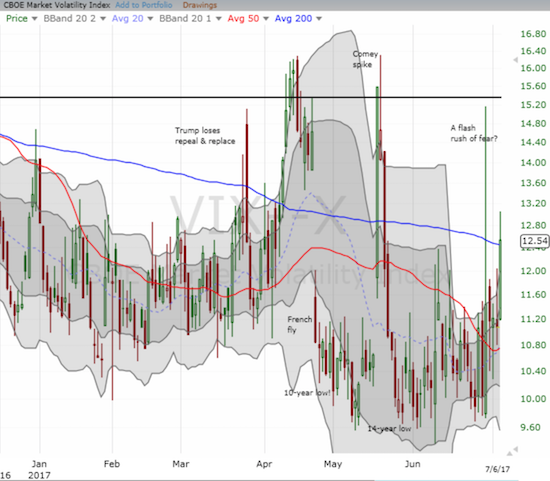 The volatility index, the VIX, has obtained an upward bias in the last week.[/caption]
With another jobs report coming on Friday, I am avoiding over-interpreting this action. Even after seeing the market’s reaction to the jobs report, I will have to stay wary with earnings season soon to start. However, all else being equal, I have quickly transitioned my sentiment along with AT40’s sharp reversal in fortunes. Note well that sudden and deep drops in AT40 from any level can act as a short-term oversold trading signal, aka “quasi-oversold.”
Trading action
Despite my mood shift, I did not take any direct action to get incrementally more bearish. In fact, I quickly locked in profits on my latest tranche of put options on Apple (AAPL). I also sold my put options on Netflix (NFLX). Again, I interpret my consistent success with AAPL put options as indicative of an increasingly bearish bias in big cap tech. I faded NFLX as an extension of that observation.
My call options on ProShares Ultra VIX Short-Term Futures (UVXY) opened with enough green to trade back to flat. I held them looking for more green, but UVXY faded before closing near its high of the day. With expiration coming on Friday, I decided not to risk losing the hard fought recovery. My UVXY put options expire next Friday.
Given the churn in the market, I decided to swing for some SPY call options. I will have a quick trigger on these options expiring in two weeks.
Now on to some dramatic action in individual stocks…
Auto parts
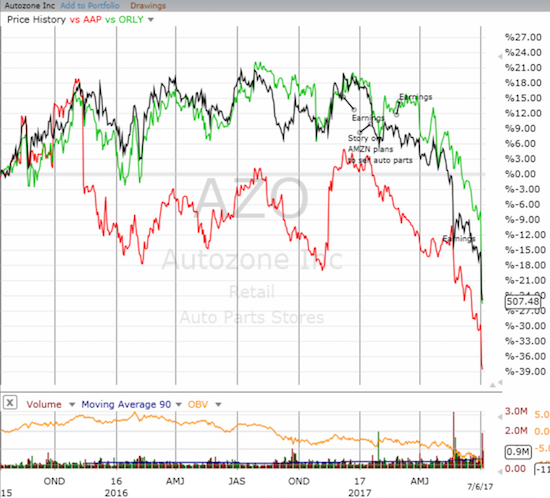
On Wednesday, O’Reilly Automotive, Inc. (ORLY) delivered a pre-earnings warning that sent massive shockwaves through the auto parts sector. ORLY lost a whopping 18.9%. Even mighty Autozone (AZO) was slammed for a 9.6% loss. Obviously, if it turns out ORLY is suffering from company-specific issues, then the likes of AZO and Advanced Auto Parts (AAP) are way oversold. However, the auto parts companies have traded in tandem particularly since a mid-January story about AMZN’s interest in the auto parts sector. While ORLY recovered briefly from that hit, AAP and AZO never closed higher again. I have largely missed the big trades here, but today I finally faded Monro Muffler Brake, Inc. (MNRO).
Tesla (TSLA)
Nothing says “change of sentiment” better than a speculative stock getting hammered into a breakdown. TSLA initially traded up in response to its latest report on deliveries and company performance. The celebration lasted all of 45 minutes. Sellers have not let up since.
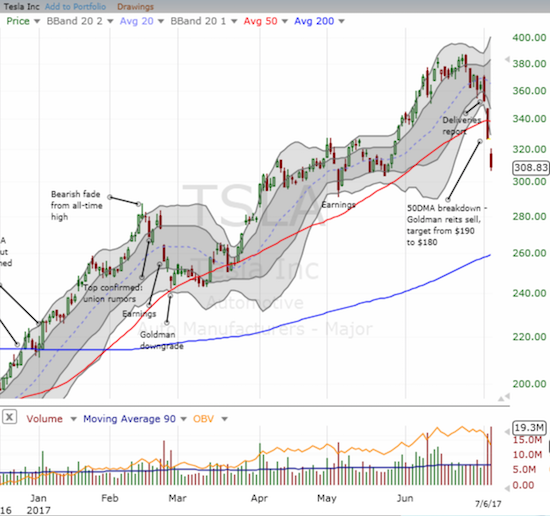
With TSLA now over-stretched well below its lower-BB, I decided to make a hedged play with an upside bias. I bought a small amount of shares (20) and a 290/280 put spread. I am looking for TSLA to rebound eventually toward its 50DMA. Along the way, I see near-term downside risk as a test of uptrending 200DMA support: at which point the put spread would more than pay for losses on shares. I will need to stop out the shares if they drop further from there.
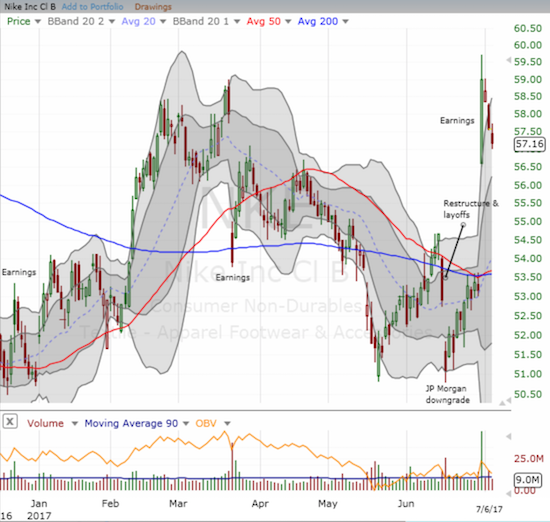
Nike (NKE)
I first tried to fade the post-earnings run-up on NKE contrary to my typical strategy of late to follow post-earnings momentum. Today, I felt relieved to get the opportunity to slink out of my position at a minimal loss. I rationalized the trade thinking the stock simply seemed to over-react as a trigger-finger reversal of the doom and gloom preceding earnings. After watching NKE manage another 5.5% gain on the post-earnings day well above its upper-BB, I realized that this moment could represent a key sentiment change. After closing out my short, I turned right around and bought some shares. I kept some powder dry to accumulate more shares in case the market throws out another cheaper opportunity.
Messages from forex
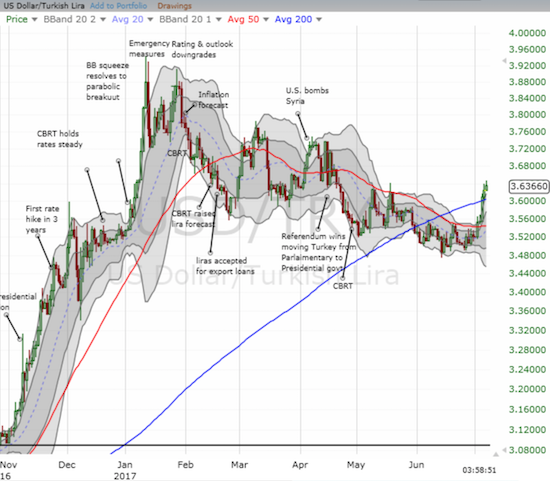
With interest rates on the rise again, the space for carry trades has suddenly become a lot more uncomfortable. Two of my favorites have experienced notable reversals. The Turkish lira has weakened enough to send USD/TRY punching through 200DMA resistance. Since I only have a very small short, I am hanging on for a bit longer…and no longer than that! (My strategy of actively flipping positions served me well here).
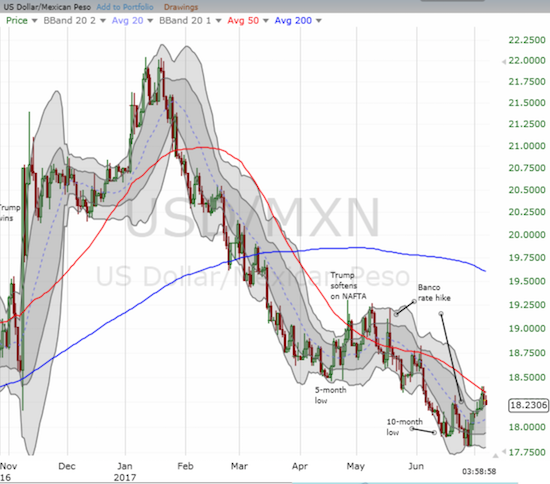
The Mexican peso has steadily marched higher almost every day since Banco de Mexico hiked rates. USD/MXN is now bumping against 50DMA resistance. To-date I have done well fading rallies and locking in profits on pullbacks. That routine may be on its last legs here…
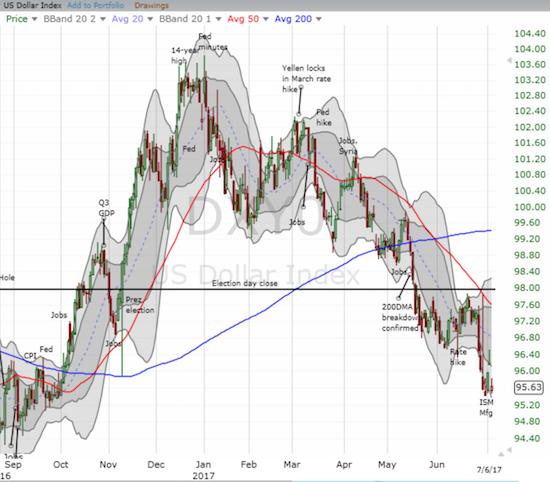
While these carry trades are taking a turn for the worse, the U.S. dollar index (DXY0) is actually still selling off! After a great response to the ISM manufacturing report, the U.S. dollar index finds itself already turning in a complete reversal of those gains. The jobs report should deliver an important test of the market’s (dis)interest in the U.S. dollar.
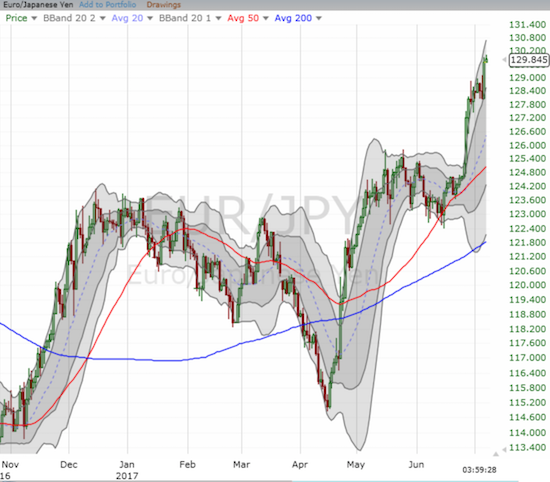
The weakness of the Japanese yen (FXY) continues to amaze me. If it were not for the general market’s relatively big yawn toward North Korea, I would have concluded that traders are trying to get out of the way of Japan for fear of geo-political tensions. Absent that, I would have then expected carry trades to do very well in general with yen weakness representing a risk-on environment. So, I have had a very mixed approach to trading the yen. I have accumulated yen longs against the British pound and the Australian dollar, but I have done very short-term flips shorting the yen against the euro and the U.S. dollar. If a major risk-off trade comes ripping through forex, I hope I am still net long the yen.
It doesn’t matter until it does
Speaking of North Korea…
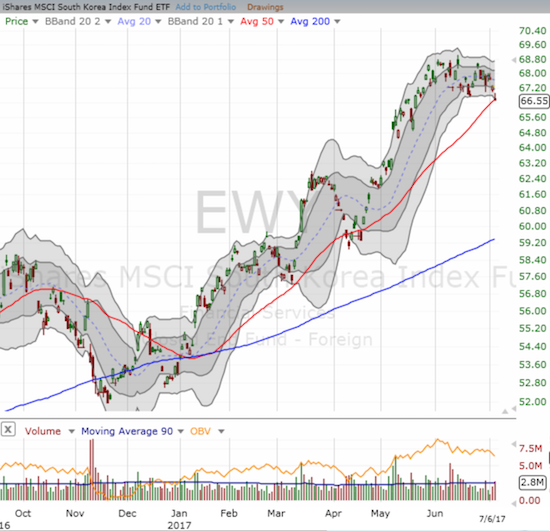
Amazingly, the market has show little concern with the worsening geo-political situation in North Korea. Not even the stock market in South Korea has blinked much. The iShares MSCI South Korea Capped ETF (EWY) finally looks toppy with a test of 50DMA support, but the chart hardly rings alarm bells.
I try not to dwell on political drama in this blog, but I am making a key exception in this case. I think the risk of war is VERY real and present. I see the North Koreans steadily pressing the envelope of U.S. (and hopefully international) patience. Launching a test of a missile that can reach Alaska is a major escalation and provocation. I see that the Russians have concluded they have little to no interest in helping dissolve tensions and in disarming North Korea’s nuclear capabilities. Indeed, I think the Russians would love to see the U.S. get bogged down in an extended conflict in Korea. If China gets dragged into it, all the better. I think China has a deep and vested interest in preventing war (think hundreds of thousands of refugees pouring over the border into China), but the country sits in a conflicted spot. Making matters worse, North Korea has lately shown little concern for China’s opinions (of course, China’s warnings could be all show and no substance). In other words, the recipe is here for a war and a very tragic and destructive one at that. This powder keg has built over decades; I shudder to think of what fury lies underneath the surface.
Today, these risks matter little to the market. But when they do matter, they will REALLY matter. Before the pundits and commentators deliver explanations after the fact, I think traders in particular would do well to position for higher risks. Put options are cheap right now thanks to the still low VIX. Unless (until?) the Korean situation is resolved relatively peacefully (and I do not see how it will happen), I will not let a single trading day end without having at least a few put options in my pocket no matter what my short-term trading call says.
Be careful out there!
— – —
FOLLOW Dr. Duru’s commentary on financial markets via email, StockTwits, Twitter, and even Instagram!
“Above the 40” uses the percentage of stocks trading above their respective 40-day moving averages (DMAs) to assess the technical health of the stock market and to identify extremes in market sentiment that are likely to reverse. Abbreviated as AT40, Above the 40 is an alternative label for “T2108” which was created by Worden. Learn more about T2108 on my T2108 Resource Page. AT200, or T2107, measures the percentage of stocks trading above their respective 200DMAs.
Active AT40 (T2108) periods: Day #348 over 20%, Day #162 over 30%, Day #29 over 40% (overperiod), Day #1 under 50% (ending 7 days above 50%) (underperiod), Day #2 under 60%, Day #108 under 70% (corrected 7/7/17)
Daily AT40 (T2108)
")
Black line: AT40 (T2108) (% measured on the right)
Red line: Overbought threshold (70%); Blue line: Oversold threshold (20%)
Weekly AT40 (T2108)

*All charts created using freestockcharts.com unless otherwise stated
The charts above are my LATEST updates independent of the date of this given AT40 post. For my latest AT40 post click here.
Related links:
The T2108 Resource Page
You can follow real-time T2108 commentary on twitter using the #T2108 or #AT40 hashtags. T2108-related trades and other trades are occasionally posted on twitter using the #120trade hashtag.
Be careful out there!
Full disclosure: long SPY call options, long UVXY put options, short MNRO, long NKE, short USD/TRY, short USD/MXN, long EUR/JPY, short GBPJPY, short AUD/JPY, long TSLA, long TSLA put spread
*Charting notes: FreeStockCharts.com uses midnight U.S. Eastern time as the close for currencies.