
AT40 = 65.0% of stocks are trading above their respective 40-day moving averages (DMAs)
AT200 = 60.5% of stocks are trading above their respective 200DMAs
VIX = 11.3 (volatility index)
Short-term Trading Call: cautiously bullish
Commentary
During the big June 9th swoon in tech stocks, I was surprised to observe how well the stock market (in aggregate) performed. From Above the 40 at that time:
“While the carnage in big cap tech stocks was painfully clear – the PowerShares QQQ ETF (QQQ) declined 2.5% and the NASDAQ Composite declined 1.8% – most of the remaining stock universe was blissfully unaware of the pain.
My favorite technical indicator, AT40 (T2108), the percentage of stocks trading above their respective 40-day moving averages (DMAs), says it all. AT40 increased a solid 6.5 percentage points from 52.1% to 58.6%.”
Amazingly, a similar, albeit a little less dramatic, divergence happened to start the second half of the year. On July 3rd, a holiday-shortened trading day, the NASDAQ dropped 0.5% and the PowerShares QQQ ETF (QQQ) lost a convincing 1.1% which confirmed its 50DMA breakdown. At the same time, AT40 soared from 57.2% to 65.0%. My favorite technical indicator is now within sight of its first overbought reading (above 70%) in 106 trading days.
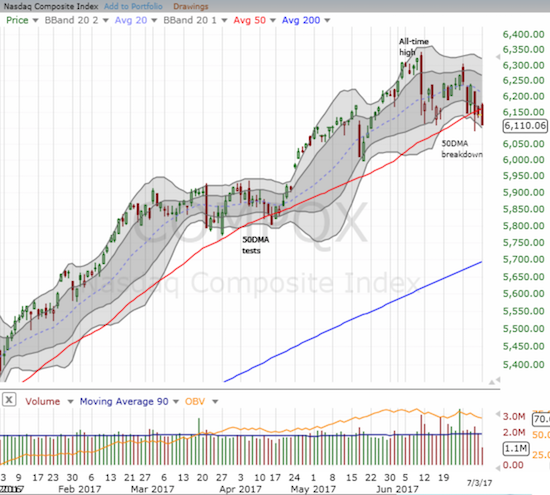
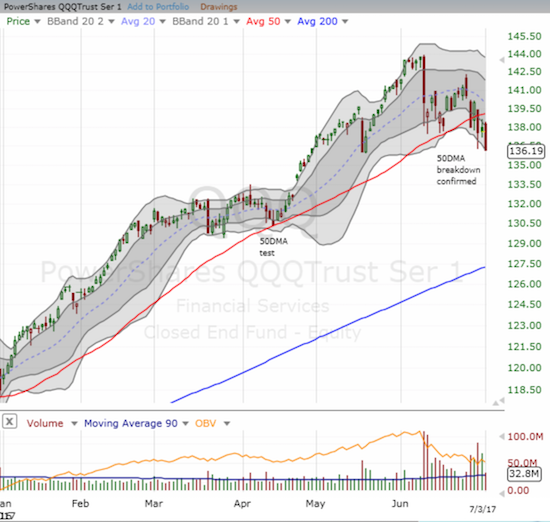
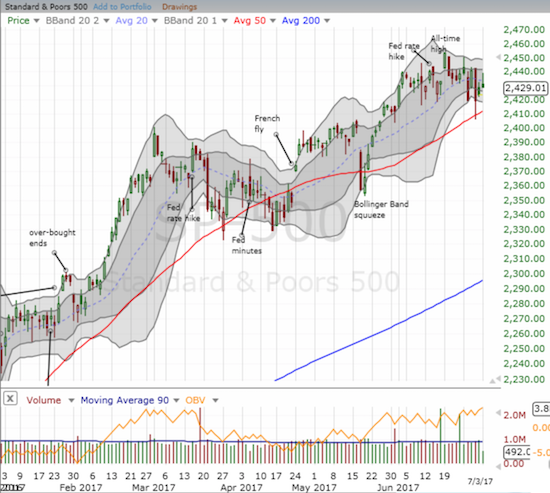
The S&P 500 (SPY) barely provided any clues to the divergence as it eked out a 0.2% gain after fading from its highs. I sold my SPY call options into the initial rally as I was nervous from seeing big cap tech wobble. I am still holding my QQQ call options with Apple (AAPL) put options as a pairs trade.
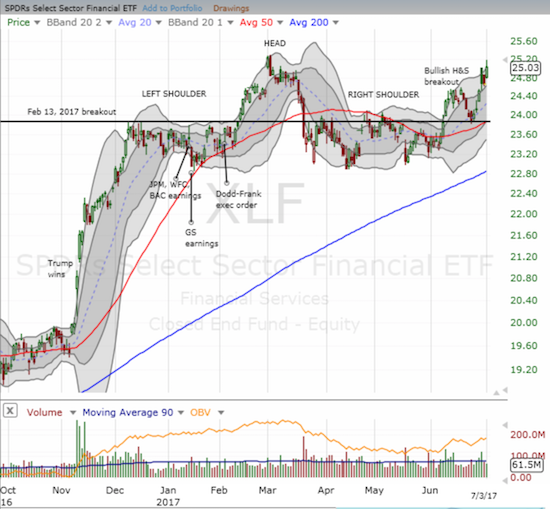
Some of the biggest gainers of the day were PowerShares DB Agriculture ETF (DBA) at +1.5%, Energy Select Sector SPDR ETF (XLE) at +1.9%, and, most importantly, Financial Select Sector SPDR ETF (XLF) at 1.5%. Financials were bolstered by yet another pick-up in long-term Treasury bond yields. While I wish I loaded up on DBA when I intimated that the ag sector was oversold, I did use the extended relief rally in ag to lock in profits on my Deere (DE) call options.
Even retail managed a small rally with SPDR S&P Retail ETF (XRT) gaining 0.7% on the day (I decided here to lock in profits on my bullish call spread on Nordstrom (JWN) – still buying dips). In other words, money clearly left tech for other (cheaper) pastures. I consider this a bullish rotation because the money bleeding out of tech is not weighing the market down and instead is helping to broaden the market’s strength. When AT40 increases, more stocks are participating in the market’s gains.
With earnings season starting in about two weeks, we should get a major test of this process of cashing in on tech and loading up on the market’s laggards and bargains. In the meantime, I will be watching closely how AT40 behaves around the overbought threshold: a bearish fade from 70% or a bullish break above 70%. My read on the market will start with the technical results of this critical test.
Be careful out there!
— – —
FOLLOW Dr. Duru’s commentary on financial markets via email, StockTwits, Twitter, and even Instagram!
“Above the 40” uses the percentage of stocks trading above their respective 40-day moving averages (DMAs) to assess the technical health of the stock market and to identify extremes in market sentiment that are likely to reverse. Abbreviated as AT40, Above the 40 is an alternative label for “T2108” which was created by Worden. Learn more about T2108 on my T2108 Resource Page. AT200, or T2107, measures the percentage of stocks trading above their respective 200DMAs.
Active AT40 (T2108) periods: Day #346 over 20%, Day #160 over 30%, Day #27 over 40%, Day #6 over 50%, Day #1 over 60% (overperiod ending 8 days under 60%), Day #106 under 70% (underperiod)
Daily AT40 (T2108)
")
Black line: AT40 (T2108) (% measured on the right)
Red line: Overbought threshold (70%); Blue line: Oversold threshold (20%)
Weekly AT40 (T2108)

*All charts created using freestockcharts.com unless otherwise stated
The charts above are my LATEST updates independent of the date of this given AT40 post. For my latest AT40 post click here.
Related links:
The T2108 Resource Page
You can follow real-time T2108 commentary on twitter using the #T2108 or #AT40 hashtags. T2108-related trades and other trades are occasionally posted on twitter using the #120trade hashtag.
Be careful out there!
Full disclosure: long QQQ call options
*Charting notes: FreeStockCharts.com uses midnight U.S. Eastern time as the close for currencies.
I am cussing myself for leaving the short nzd.cad trade too early and missing out the last week and moving to a long gold position which has been trickling down all week. Any thoughts on gold?
Whilst everyone is fixated on us data this week, I think what will determine the quarter is whether the Chinese will loosen again before their nov meeting. If they do, which they have in the past that would be a wind up for the reflationary trade. I am not sure what the best expression of that would be – long copper, gold or oil ? My base case is a stagnant US H2 and resurgent China. That would juice S&P slightly but I think resources will move more.
The Canadian dollar has been amazingly strong lately!
As long as interest rate are climbing, I am staying away from precious metals (beyond my existing core positions). I am already accumulating long TLT September call options as a hedge against a market calamity, so I have no need to rush into gold trades.
You are REALLY looking ahead on China! Is there a history of anticipating the November loosening months in advance? Resources and the Australian dollar should be the best bets there….
I figure with Chinese lending and growth impulse rolling over currently, they will need to add liquidity soon or risk a downturn. My guess is they will announce some mild or moderate easing measures before the November meeting to ensure a smooth period around and after the meeting. This might happen in August or it may not. With currency reserves increasing they may not feel they need to ease but with the property bubble they have and reliance on growth lending, I think they have to ease soon. I am long gold here and will take the loss if they don’t ease. However, if they don’t ease, I think their economy will be at risk of rolling over and taking the global economy with it and they know this. Which is why they have eased at slowing points in the past. If they ease, that will reinflate the housing bubble and keep their economy chugging until mid 2018.
Interesting spec length accumulating in MXN (ie getting extreme) and I am tempted to short MXN to hedge gold long. Short interest in CAD probably 2/3 wrung out now.
Pondering long JPY currently. Maybe just a small position. No one is expecting the BOJ to move to a hawkish bias ever. The consensus is they have rates pinned to 0.1% permanently. Any shift in this perception will have a large effect and specpositioning in JPY is quite short (not extreme) but possibly too short given the trend for other CB’s to catch up to the fed in tightening. Hawkish ideas about euro pretty well priced in and now consensus. Regressed on rate differentials eur.usd should be 1.1 or less. Draghi will have to deliver for eur.usd to rally to 1.18 and eur is getting into the short zone from my perspective in terms of news flow, sentiment and actual fundamentals. Short eur.jpy interesting from a positioning perspective.
I am not sure why speculators have built such a large long interest in MXN and NZD, possibly carry related. Or MXN an overreaction to the previous excessive short MXN position after Trump. I don’t follow MXN or NZD much but am tempted to short both to hedge out gold long.
On thinking it through more,
Jpy long would perhaps not hedge gold exposure much but still an attractive idea
Gold seems to have zero juice here. I just bought SLV call options expiring in August. I am playing an oversold rebound but the options were cheap enough to go out two months so I did. I figure that means expectations are for a lot more downside for precious metals. I agree JPY long does not hedge gold exposure. JPY is on its own track now as the BoJ is completely out of step with the global tightening of monetary policy.
Overall, I am still more inclined to join trends than fight them. EUR/JPY looks like a major breakout. I prefer buying dips on that one.
I continue to be surprised at the outsized strength in CAD. I finally caught some shorting GBP/CAD.
Still a fan of USD/MXN short but I think the trade may have run out of steam around 18. Just covered my latest swing trade. I am going to aggressively short USD/MXN if 18 breaks solidly.
Good point about gold DD, it is looking very poor. I am thinking of now of cutting the position rather than hedging, so that probably means there is a bounce next week and I will try to offload into that.
Mxn, I have no position, but oil where it is and Banxico one wonders would be more inclined to cut than raise rates. So there might be a rise in MXN if the Canadians raise next week but I would be more inclined to sell
into that than the other way. Looks like the BOC will hike next week. If they don’t CAD might be another buy on the pullback from that disappointment (90% chance of hike now implied). If they do hike it could be a sell soon after. I prefer selling NZD though if there is a BOC hike. NZD probably will pop if that occurs and spec log interest in that is extreme given the usual volume in that pair.
Thanks for the heads up on the Bank of Canada! I am about to post a piece on the Canadian dollar and didn’t have a policy meeting in the radar. I agree with your assessment in the potential paths forward. Where did you get the info on the odds of a hike. 90% seems extremely high. I can’t imagine a hike just yet. And even if one happens, the Bank will make it abundantly clear they are not about to go on a hike cycle. Disappointment all around for hawks I think.
The 90% I read on Friday about the implied probability from short rate futures before and after the meeting. I think there can be differences in calculation that can yield a +\~10% but implied probability is well over 80% after the strong Canadian employment number on Friday. I think there is a good chance they hike. What will be interesting is whether they adopt a hiking bias. The real sleeper, which has slipped below most people’s radars until now is the strength in employment in Canada. They have been printing 40k employment numbers for the last 6 months and that would be like 400k NFPs in the US. 0.5% is clearly no longer justified with the employment strength, housing bubble or not.
What I find interesting is that Japan has also had good employment growth and if this continues, at some stage this will start to affect whether people think the BOJ will keep rates at 0. There is no inflation yet but a few more months of strong japanese employment could see it back to the mid 2’s. May’s result of 3.1 might have been an aberration as the previous months were 3, 3.1, 3, 2.8 and 2.8. That is something to watch I reckon.
NZ have election in September so I doubt they hike before then. Also they hiked too early last time and had to reverse it so will be slow to act this time. They also have the highest rates in the developed world. I have no idea why there is such a large long interest developing in NZD with an election around the corner.
So the good news then is that a lot of people are getting to work!
I had no idea Japan was getting such good numbers. Did the BoJ just affirm its QE program or even increase it again? I thought perhaps that was behind this surge in weakness. The yen certainly will soar the second the market even sniffs any kind of monetary tightening in Japan.
Thanks for the comment about gold. It prompted me to get out of that. Sometimes you hold a losing position for too long. It is as a relief to get out of it and back short nzd.cad.
It will be very interesting to watch the yen. Yes the BOJ reaffirmed being dovish and this caused yen to weaken. But I think this will make it more prone to strengthening. If the Canadians hike due to employment strength, the spotlight will be on employment reports elsewhere. The BOJ will reaffirm their dovish bias but I think this doubt about future hawkish move will be enough to move JPY. I wonder if 120 is the maximum because QE will have to be reduced at some point in 2018. In the situation of increasing employment and the inflation but the BOJ pinning rates to zero, where would the yen go ? Rate differentials would indicate 120 but the anticipation of inflation suddenly makes Japanese equities more attractive and the yen should move 10% just as the euro has on that.
Like in the euro there is a massive structural short interest in yen as well as a modest spec short interest short term. Everyone who was going to has sold Japanese assets and when some buying comes there should be a reasonable move in yen, independent of any risk off move or BOJ actual policy changes. I suspect that even the notion that the BOJ pull back on the dovishness will have a lot of carry traders with their pants down.
This has me interested in moving from short nzd.cad to short nzd.jpy, NZD is overbought and jpy could turn
I don’t follow NZD but you have me convinced that the time is nigh to be going long yen!
I am still very wary of this idea the Bank of Canada is hiking. I haven’t yet managed to post about it.