
AT40 = 54.6% of stocks are trading above their respective 40-day moving averages (DMAs)
AT200 = 56.5% of stocks are trading above their respective 200DMAs
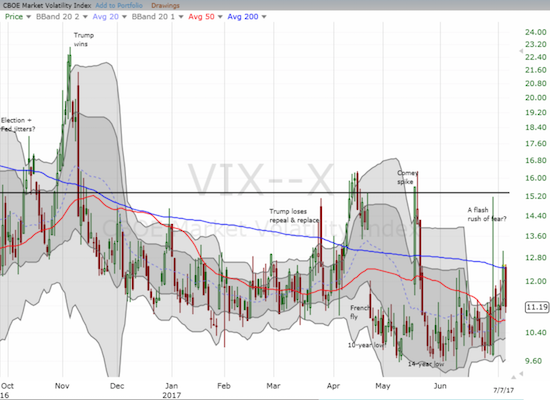
VIX = 11.2 (10.8% drop) (volatility index)
Short-term Trading Call: neutral
Commentary

Source: Giphy
There are all sorts of nicknames possible for a churning market. In this edition of “Above the 40,” I use a yo-yo to describe the market’s tantalizing lurches up and down. These moves within shouting distance of all-time highs must be frustrating bears and bulls alike who want to stick by a trade for more than a hot minute. (For example, the market gave me less than half a trading day to profit nicely from my latest put on Chipotle Mexican Grill (CMG), and I failed to seize the opportunity – the benefits of a trailing stop to preserve profits!).
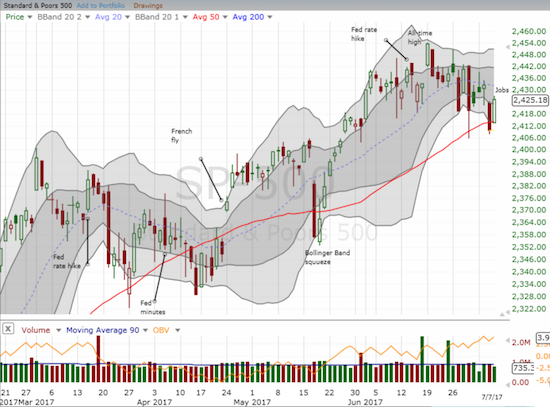
Friday’s catalyst was presumably the U.S. non-farm payrolls – the jobs report – for June, 2017. Strong numbers put the market right back into a good mood. The S&P 500 (SPY) delivered the bounce that I anticipated. The move allowed me to close out my call options on SPY with a near double.
Almost clocked a double. Sold $SPY calls here. #122trade
— Dr. Duru (@DrDuru) July 7, 2017
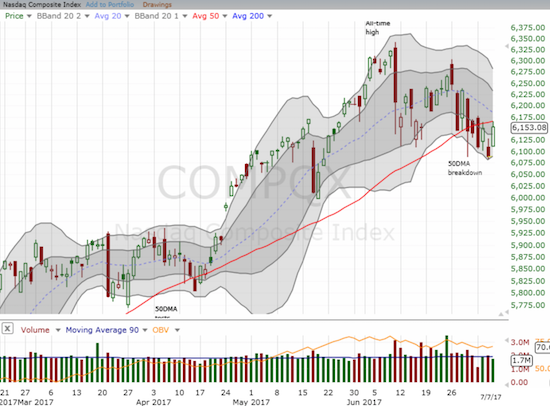
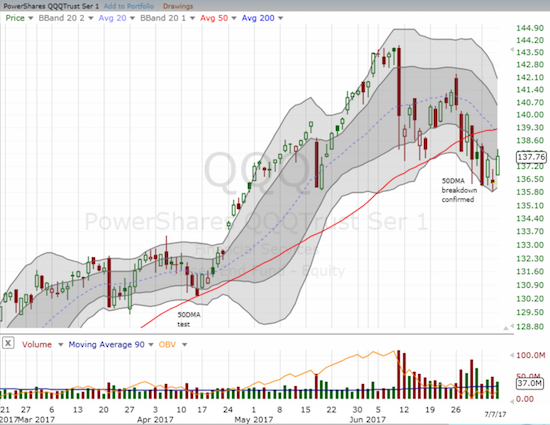
The NASDAQ also benefited from the good mood for the day. The tech-laden index gained 1.0%, enough to neatly touch resistance at its 50-day moving average (DMA). The PowerShares QQQ ETF (QQQ) increased by a similar amount and reached the top of its downtrend channel.
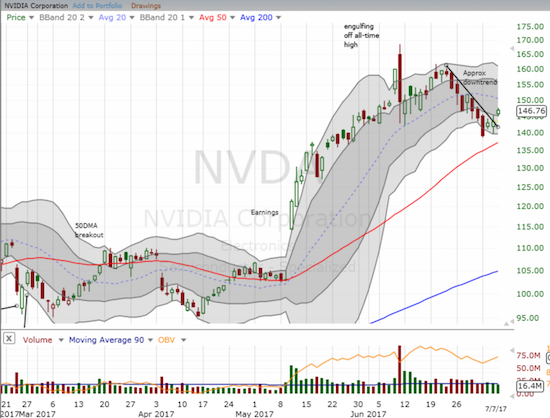
I used the bounce to reload on put options on Apple (AAPL) and on Netflix (NFLX). AAPL performed in-line with the NASDAQ and NFLX zipped higher by 2.7%. Amazon.com (AMZN) and Facebook (FB) were the two “usual suspects” which changed their technical positioning with solid breakouts above 50DMA resistance. Both stocks closed on downtrending 20DMAs. Nvidia (NVDA) is starting to look ready for another run-up. The stock logged its third consecutive gain and today confirmed a break above its short-term downtrend.
AT40 (T2108), the percentage of stocks trading above their respective 40-day moving averages (DMA), confirmed the return of rosy sentiment with a very solid rebound. The jump from 48.1% to 54.6% seemingly confirmed my opinion that a steep and rapid 2-day drop for AT40 is a quasi-oversold trading condition that should be bought for a swing trade.
The volatility index, the VIX, imploded and lost all its gains from the previous day. At 11.2, the VIX essentially sits at an extremely low level once again. I still think the bias is upward but I decided to wait until Monday to reload on call options for ProShares Ultra VIX Short-Term Futures (UVXY). In a rare display of resilience, UVXY actually lost (6.8%) a lower percentage than the VIX (10.8%).
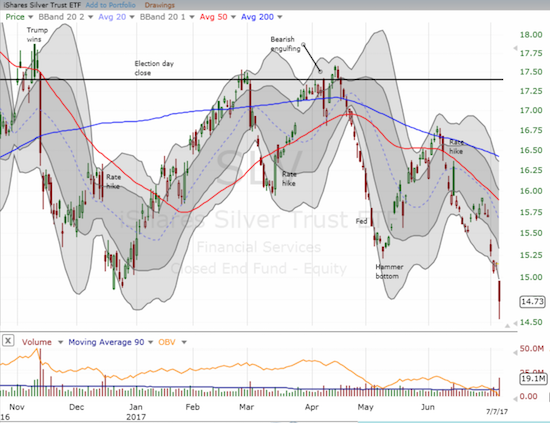
Long-term interest rates increased as a confirmation of stronger economic news. I stubbornly added yet more iShares 20+ Year Treasury Bond ETF (TLT) call options. This trade will be my last as TLT confirmed a breakdown below its 200DMA. I now turn to the precious metals which should trade lower when long-term rates go up. The iShares Silver Trust (SLV) lost almost 4% at its lows soon after which I decided to load up on September call options. SLV bounced nicely off its lows to finish the day with a 2.8% loss on very high trading volume. I am looking for a relief bounce to continue at least to get back to the lower-Bollinger Band (BB).
$SLV getting hammered. Well below lower-Bollinger Band. Time to play a relief bounce. #122trade pic.twitter.com/DdVXN045wY
— Dr. Duru (@DrDuru) July 7, 2017
Interestingly, speculators have slowly but surely backed off their “maximum bullishness” on silver. Net long contracts have not been this low since early January, 2016. Now I will forever wonder why in the world speculators were so bullish on silver in the midst of Fed rate hikes…
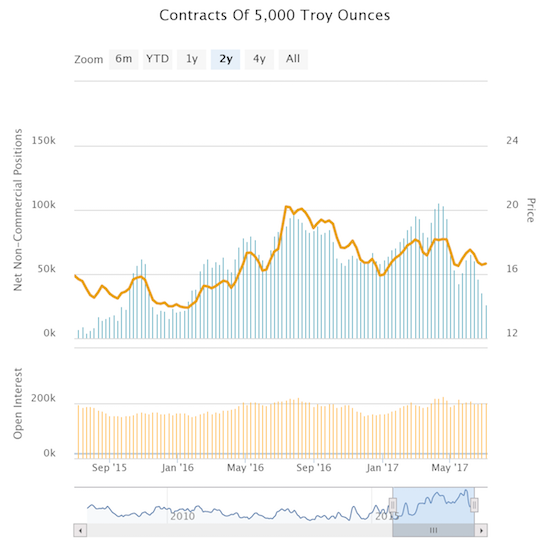
Source: Oanda’s CFTC’s Commitments of Traders
Going forward, I will continue to trade under the assumption that the market will reverse the moves of the previous day or days with an overall downward bias – until proven otherwise of course. My short-term trading call stays at neutral although the S&P 500 managed to reclaim its 50DMA support. To prove itself once more, the index needs a confirmed breakout to a new all-time high.
While the market churns away, AT40 has not crossed the thresholds of extremes for a VERY long time. The stock market has now gone 349 straight trading days without dropping under the 20% oversold threshold. The stock market has gone 109 straight trading days without an overbought reading (above 70%). The charts below show the extreme nature of these streaks.
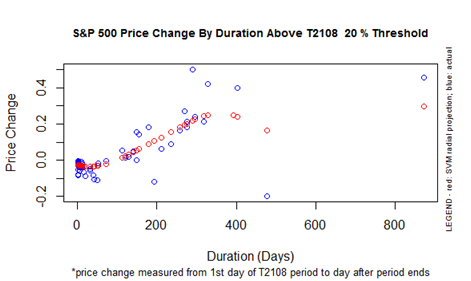
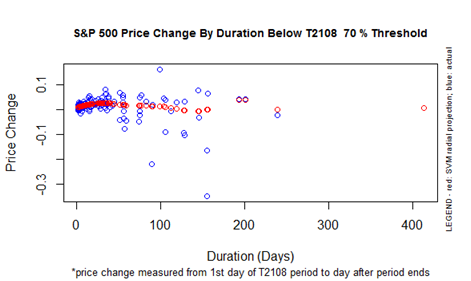
These charts were last updated in 2015, but they are sufficient for these purposes given the length of time AT40 has gone without hitting extremes. There are now only THREE other periods since 1991 where AT40 spent more time avoiding oversold trading conditions. More importantly, this extreme means that the projected performance of the S&P 500 tops out here. Note that AT40’s sharp moves demonstrate that a mild sell-off, say 5%, will likely suffice for taking AT40 under 20%. For the 70% underperiod, AT40 is not yet in rarefied air, but it is getting there. Combined these charts suggest that the S&P 500 will not make much more progress until overbought and/or oversold conditions occur.
Be careful out there!
— – —
FOLLOW Dr. Duru’s commentary on financial markets via email, StockTwits, Twitter, and even Instagram!
“Above the 40” uses the percentage of stocks trading above their respective 40-day moving averages (DMAs) to assess the technical health of the stock market and to identify extremes in market sentiment that are likely to reverse. Abbreviated as AT40, Above the 40 is an alternative label for “T2108” which was created by Worden. Learn more about T2108 on my T2108 Resource Page. AT200, or T2107, measures the percentage of stocks trading above their respective 200DMAs.
Active AT40 (T2108) periods: Day #349 over 20%, Day #163 over 30%, Day #30 over 40%, Day #1 over 50% (ending 1 day under 50%) (overperiod), Day #3 under 60% (underperiod), Day #109 under 70%
Daily AT40 (T2108)
")
Black line: AT40 (T2108) (% measured on the right)
Red line: Overbought threshold (70%); Blue line: Oversold threshold (20%)
Weekly AT40 (T2108)

*All charts created using freestockcharts.com unless otherwise stated
The charts above are my LATEST updates independent of the date of this given AT40 post. For my latest AT40 post click here.
Related links:
The T2108 Resource Page
You can follow real-time T2108 commentary on twitter using the #T2108 or #AT40 hashtags. T2108-related trades and other trades are occasionally posted on twitter using the #120trade hashtag.
Be careful out there!
Full disclosure: long UVXY puts, long NVDA call spread and puts, long AAPL puts, long NFLX puts, long SLV shares and calls
*Charting notes: FreeStockCharts.com uses midnight U.S. Eastern time as the close for currencies.