
(T2108 measures the percentage of stocks trading above their respective 40-day moving averages [DMAs]. It helps to identify extremes in market sentiment that are likely to reverse. To learn more about it, see my T2108 Resource Page. You can follow real-time T2108 commentary on twitter using the #T2108 hashtag. T2108-related trades and other trades are occasionally posted on twitter using the #120trade hashtag. T2107 measures the percentage of stocks trading above their respective 200DMAs)
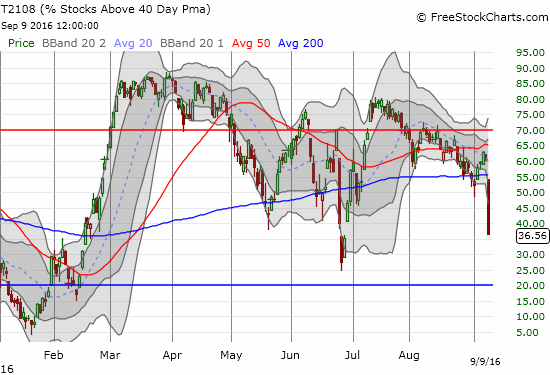
T2108 Status: 36.6%
T2107 Status: 68.8%
VIX Status: 17.5 (a 40% 1-day gain!)
General (Short-term) Trading Call: cautiously bearish
Active T2108 periods: Day #143 over 20%, Day #49 over 30%, Day #1 under 40% (new underperiod ending 47 days over 40%, 46 days over 50%, and 2 days over 60%), Day #25 under 70%
Commentary
It took a whole NINE trading days, but the entire scenario I laid out in the wake of Jackson Hole on August 26, 2016 FINALLY came to pass on September 9th.

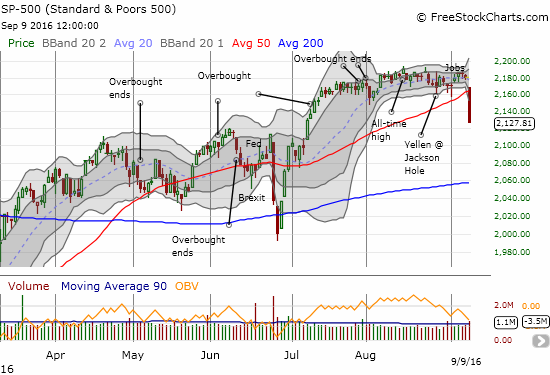
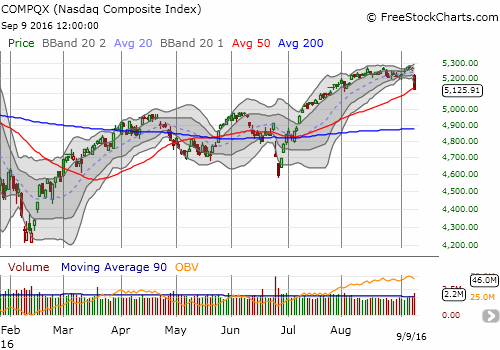
After Jackson Hole, I flipped my short-term trading bias from neutral to cautiously bearish as I braced for an increase in volatility in September. While the extended delay surprised me, I am even MORE surprised that all the calamity happened in just one trading day with almost no additional build up. I start with four charts that tell the entire story (with captions).

The alarm was caused by a barrage of Fedspeak and the feared Fedspeak to come ahead of the September 21st pronouncement from the U.S. Federal Reserve on monetary policy. After the dust settled, financial markets still expressed disbelief in the September rate hike scenario. The odds for a hike in December surged from 51.4% to 59.2%. September has been a wild month already with rate hike expectations going from December on to December off/March on and now December on again as economic news and Fedspeak have crossed up markets. My best guess is that the Fed scheduled the current barrage of chatter to begin convincing markets that a rate hike is coming in December no matter what. The Fed will NOT hike rates in September against the market’s expectations. The renewal of excited media speculation over a September hike serves the Fed purpose to set up a long runway to a December hike. Imagine the (temporary) relief that will come after the Fed fails to hike rates in September while at the same time signals a near certain December hike: “yay – only one rate hike this year instead of two!”. That meeting will likely be yet another great opportunity to fade volatility.
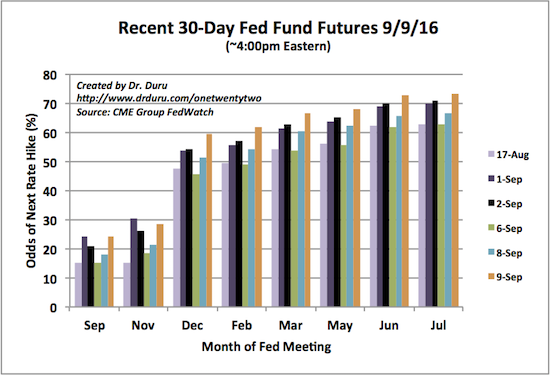
Source: CME FedWatch Tool
So once again T2108, the percentage of stocks trading above their respective 40DMAs, proved its enduring value. T2108’s on-going bearish divergence with the S&P 500 preceded this (so far) mini sell-off. I ALMOST got fooled by a brief flash of bullish divergence two days before the sell-off. However, I stayed committed by observing that T2108 had yet to return to overbought status. Of course, my main regret, with hindsight, is that my bearishness was cautious. As usual, this kind of panic selling presents a difficult dilemma for bears: the rubber band is stretched pretty far and can snap back at any time…and violently. So, I am not downgrading from cautiously bearish to bearish for several reasons:
- T2108 is already below its level after the first day of post-Brexit trading.
- Massive surges in the VIX are not sustained over extended periods of time. Since 1990, the VIX has only experienced 10 other trading days with larger one-day gains: in descending order – 2/27/07, 11/15/91, 7/23/90, 8/8/11 (euro crisis), 6/24/16 (post-Brexit), 8/21/15 (China devaluation), 8/24/15 (flash crash), 4/15/13, 2/4/94, 8/3/90. Even if this episode marks the beginning of an extended sell-off, an on-going and rapid increase in the VIX is bound to attract buyers/short-covering that cause sharp relief bounces along the way to oversold conditions.
- The S&P 500 is well below its lower-Bollinger Band (BB)
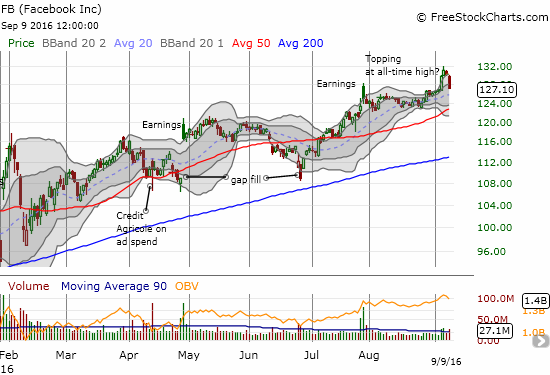
This one day of near panic selling pushed bearish technicals to extremes. Just one more day of selling could push T2108 toward or even into oversold territory (below 20%) and a bullish trading call. Given the mix of possibilities, I am staying cautiously bearish. My trading on the day demonstrates my nuanced approach to this juncture. As an example, I was so cautious with my bearishness, I married my ProShares UltraShort S&P500 (SDS) shares with two tranches of ProShares Ultra S&P500 (SSO) call options and closed out some older SSO put options (they had a tremendous one-day gain but I still had to close at a loss). I even bought two tranches of call options on Facebook (FB). However, my search for quick bounce plays ended there.
To demonstrate my thinking, I now take a trip through my trades of the day and a series of key charts. Note well that I closed out fortuitous bearish positions, took some losses, speculated on bounces, and opened up new bearish positions. It was quite a day.
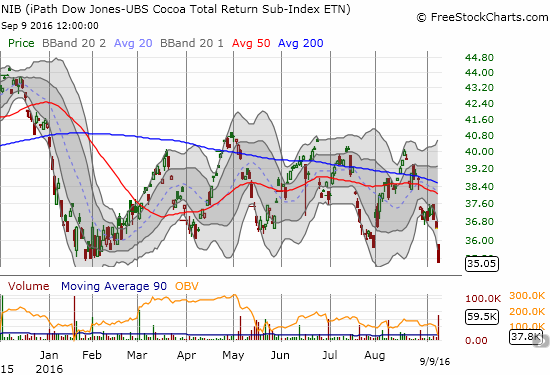
iPath Bloomberg Cocoa SubTR ETN (NIB)
NIB hit the bottom of the current trading range with a thud. Per the trading strategy I reprised at the end of August, I bought my first tranche of shares here.
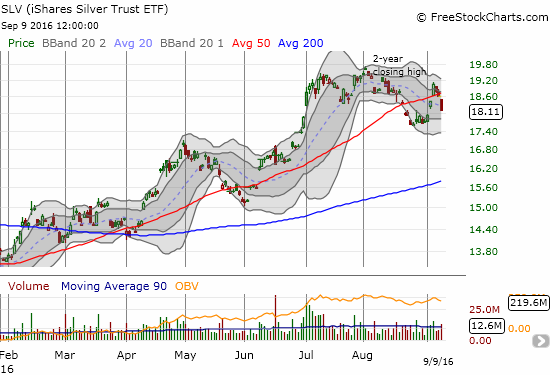
iShares Silver Trust (SLV)
I may have gained fresh sympathy for gold and silver just when my topping thesis may finally get confirmation. I ignored the latest Fedspeak that was spooking markets and launched into a fresh tranche of call options on iShares Silver Trust (SLV).
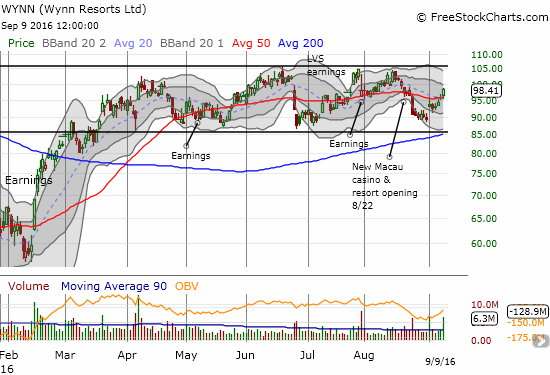
Wynn Resorts (WYNN)
Wynn Resorts (WYNN) was a nice surprise on the day. The stock managed to buck decisively the day’s panic. Not only did it gain 2.8% but also it closed at its high of the day…all on very strong buying volume. A story in Barron’s Asia provided the background: Macau gambling is recovering. I have maintained a bullish stance on WYNN ever since its CEO loaded up on shares last December. I actually got more bullish during this trading range given how a constant stream of negative analyst reports failed to knock the stock down for the count. My latest call options were a play on the trading range. I took profits today even though this relative strength suggests WYNN could soar even more on a general market rebound. With expiration in a week, a pullback on Monday could leave me with no time to recover. I decided to avoid the risk.
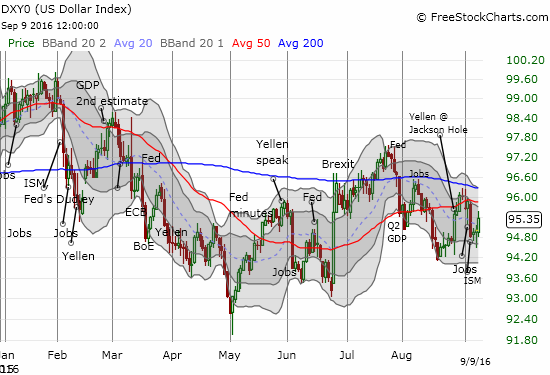
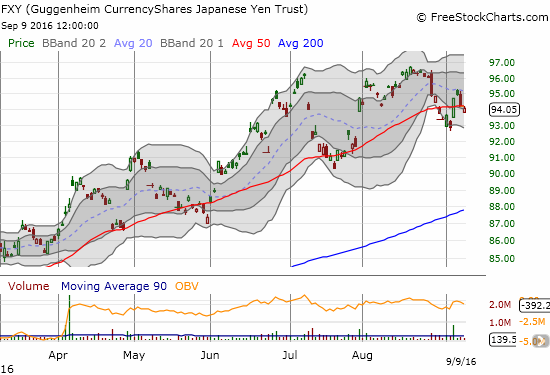
The U.S. Dollar index (DXY0)
The U.S. dollar (DXY0) was a huge beneficiary of the fear of Fed rate hikes. While the yo-yo that is my forex account swelled higher, I went after a fresh tranche of put options on CurrencyShares Japanese Yen ETF (FXY). I decided to go for expiration in a week for this next try and buy October puts if FXY turns around and rallies instead of following through on its fresh 50DMA breakdown.
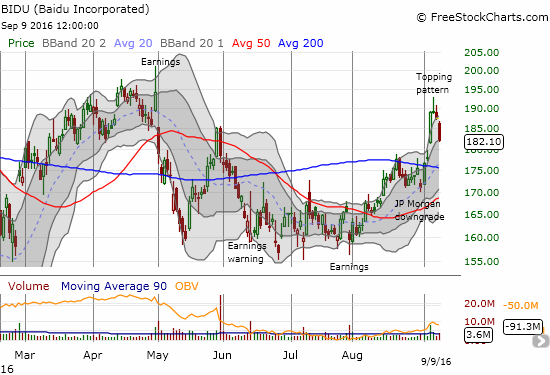
Baidu (BIDU)
My purchase of a put option on Baidu (BIDU) turned out very fortuitous. I took my profits as BIDU got “close enough” to hitting my first target of a reversal of Tuesday’s huge gain.
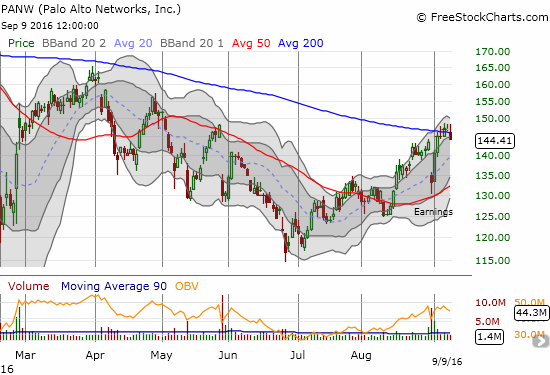
Palo Alto Networks (PANW)
With the quick success on BIDU and a big market sell-off underway, my eyes were more alert for topping patterns. I found another one in Palo Alto Networks (PANW). For four straight days, buyers have had trouble pushing away from 200DMA resistance. Given the stock just finished a snap reversal of post-earnings losses, a market sell-off makes the stock vulnerable all over again.
On a day like this, the charts explode with amazing moves and opportunity. The collection below are a small sample of the ones that caught my interest.
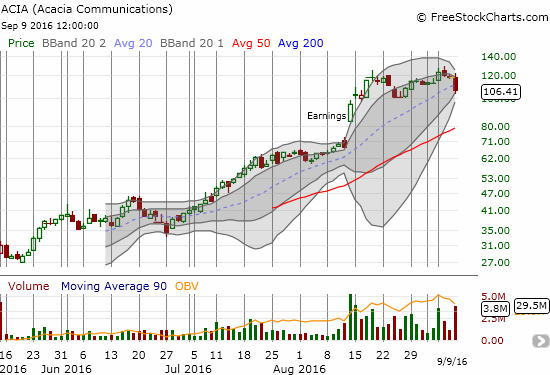
Acacia Communications, Inc. (ACIA)
I am still learning about the market’s latest darling ACIA. The stock debuted four months ago and is already up 244% since then. The monster gains did not dissuade Deutsche Bank from an untimely reiteration of its buy rating with a bump in its price target from $90 to $125. A potential Bollinger Band squeeze is building on ACIA, so I will be watching very closely for the resolution of the pattern – it should be VERY big. The last BB squeeze resolved bigtime to the upside with August earnings.
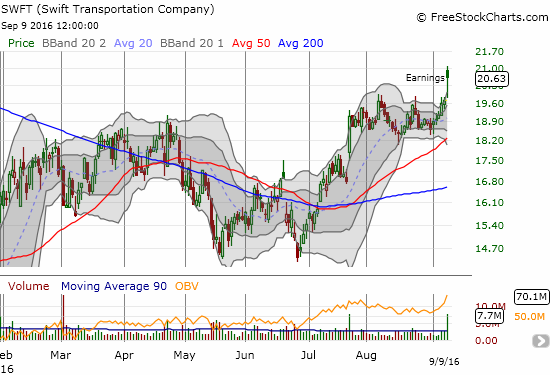
Swift Transportation Company (SWFT)
Ever since my trucking trade failed a year ago, I have yet to pull the trigger on truckers again. Looks like it is time to do another review of the sector as SWFT’s earnings were good enough to launch the stock against the market’s downpour.
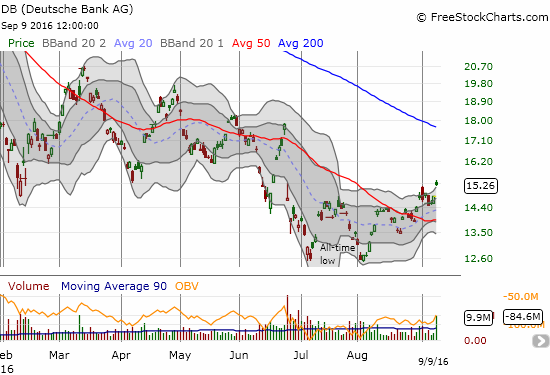
Deutsche Bank (DB)
Did DB manage to print a double bottom this summer at all-time lows? Suddenly the stock has cleared 50DMA resistance in convincing fashion and ruined what had been one of my most reliable trades for put options. My last tranche will surely expire this Friday worthless.
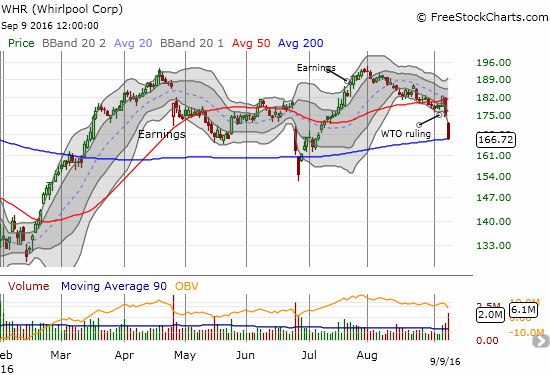
Whirlpool (WHR)
After Brexit, I targeted WHR for a fade after the company quickly moved to reassure the market that all was well with earnings. The subsequent market rally convinced me to stand down. Ironically enough, WHR did indeed top out soon after July earnings. One of my price alerts triggered Thursday as WHR confirmed 50DMA resistance, but I failed to move. On Friday, I regretted that omission as WHR was slammed for a second day in a row. The 4.6% loss took WHR right to 200DMA support. Suddenly, WHR is right back where it was in the immediate aftermath of Brexit.
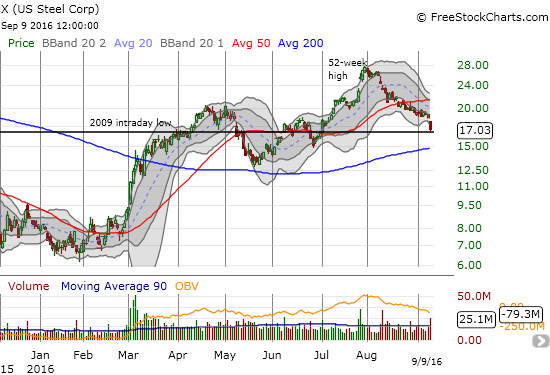
U.S. Steel (X)
U.S. Steel (X) has had an incredible 2016. At the 52-week high, X had gained 244%. Even now, X is still up 113% year-to-date. The near non-stop, drip-drop selling for over a month suggests X has found its top. The bearish turn will be confirmed if 200DMA support gives way. The high-volume selling and Friday’s 8.2% loss makes a retest all but certain within the next few weeks. I took profits on a put option right before the acceleration of the sell-off.
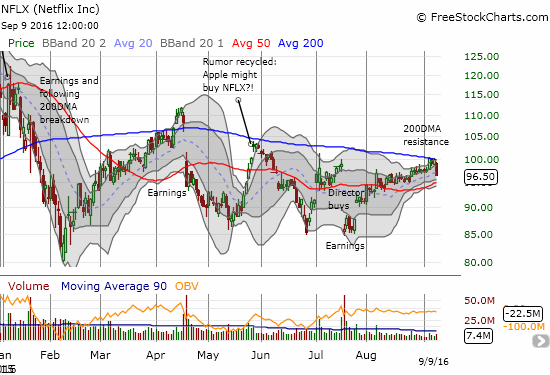
Netflix (NFLX)
NFLX finally got back to its old volatile ways. On Tuesday, NFLX soared 2.7% right into its 200DMA resistance. I used the move as an opportunity to launch a new hedged trade of calls and options. Friday’s 3.2% decline has dipped the puts deep into the green and the net position into profits. I decided to hold onto the position for now even with expiration coming up in a week.
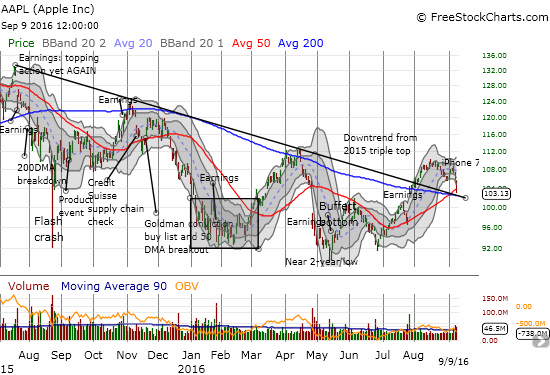
Apple (AAPL)
AAPL’s renewed woes continue. In my last T2108 Update I concluded 50/200DMA support was in play. AAPL has already cracked through the 50DMA. The former downtrend is also in play. I am assuming AAPL will cleave through more support on its way to at least a partial fill of its huge post-earnings gap up.
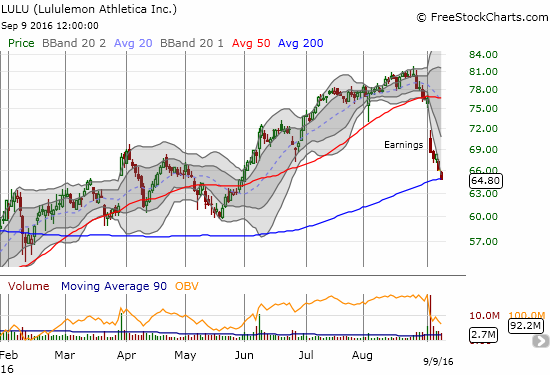
Lululemon Athletica Inc. (LULU)
After LULU reported disappointing earnings, the stock gapped down below 50DMA support and closed well below its lower-BB. I figured it would bounce quickly given its status as a (former) momentum stock that met over-extended selling. Buyers have hardly made a presence as LULU now tests its 200DMA support with the lower-BB happily guiding the stock downward.
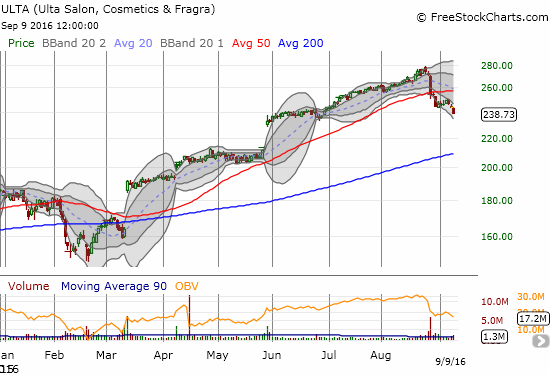
ULTA Salon, Cosmetics & Fragrance, Inc. (ULTA)
ULTA looked unstoppable until its latest earnings report. Friday’s selling has confirmed the 50DMA breakdown. I set a limit order to buy puts, but I never got filled. I have ULTA firmly planted on the short list as an extended market sell-off could put the May gap up into play as momentum chasers move to lock in profits ahead of faster sellers. ULTA is suffering a major technical breakdown and a top that is likely to hold for a while…of course, I could have said the same thing when ULTA last broke confirmed 50DMA resistance back in February! Either way, I am tracking this stock a lot more closely now.
SPDR S&P Retail ETF (XRT)
Retail in general is in fresh trouble. To start the week, I noted XRT’s struggle to hold support at its 50DMA. Since I had a bearish trading call in place, I was not looking to play a bounce and instead was waiting for support to give way. On Friday, that support gave way in a BIG way.
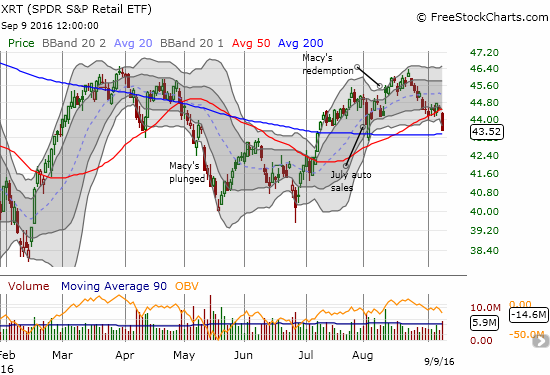
Other retailers are suffering critical failures. Wal-Mart (WMT) confirmed resistance at its 50DMA and lost 2.1% on the day. Home Depot (HD) lost 2.7% on its way to a major 200DMA breakdown. Lowe’s Companies (LOW) cracked 200DMA support on Wednesday, so its 3.2% loss on Friday confirmed the breakdown. Retail REIT Urstadt Biddle Properties Inc. (UBA) got a triple whammy as high-yielding stocks took a whack, investors responded poorly to earnings, and this after the stock was already wobbling from news that Macy’s planned to shut down a lot of stores nationwide. (Click the links to see charts).
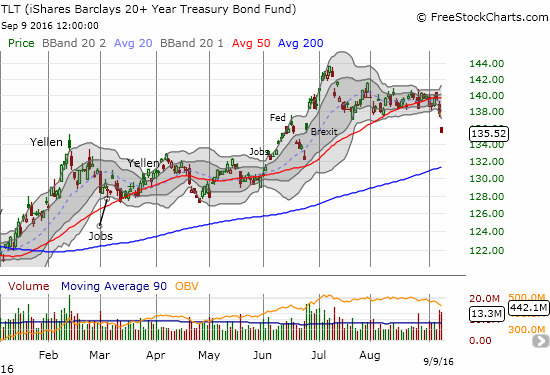
If nothing else demonstrates that the tides have turned, I conclude with this chart of the iShares 20+ Year Treasury Bond (TLT). A wedge and trading range have resolved definitively to the downside.

— – —
Daily T2108 vs the S&P 500
")
Black line: T2108 (measured on the right); Green line: S&P 500 (for comparative purposes)
Red line: T2108 Overbought (70%); Blue line: T2108 Oversold (20%)
Weekly T2108

*All charts created using freestockcharts.com unless otherwise stated
The charts above are the my LATEST updates independent of the date of this given T2108 post. For my latest T2108 post click here.
Related links:
The T2108 Resource Page
Be careful out there!
Full disclosure: long SDS, long SSO call options, long UVXY shares and short call option, long SVXY put options, long SLV call options, long FXY put options, long GLD, net long the U.S. dollar, long NIB, long PANW put options, long TLT call spread, long FB call options, long DB put options